Performance Management |
Feb. 27, 2026 |
||||||||||||||||||||||||||||||||||||||||||||||||||||||||||||||||||||||||||||||||||
|---|---|---|---|---|---|---|---|---|---|---|---|---|---|---|---|---|---|---|---|---|---|---|---|---|---|---|---|---|---|---|---|---|---|---|---|---|---|---|---|---|---|---|---|---|---|---|---|---|---|---|---|---|---|---|---|---|---|---|---|---|---|---|---|---|---|---|---|---|---|---|---|---|---|---|---|---|---|---|---|---|---|---|---|
| TCW Artificial Intelligence ETF | |||||||||||||||||||||||||||||||||||||||||||||||||||||||||||||||||||||||||||||||||||
| Prospectus [Line Items] | |||||||||||||||||||||||||||||||||||||||||||||||||||||||||||||||||||||||||||||||||||
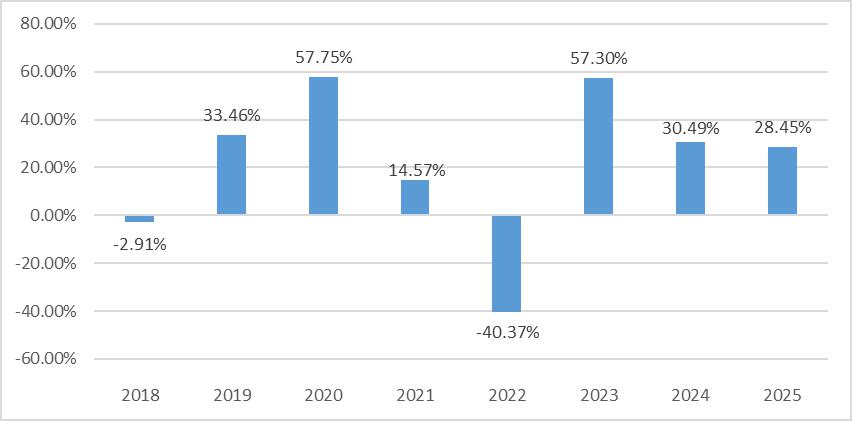
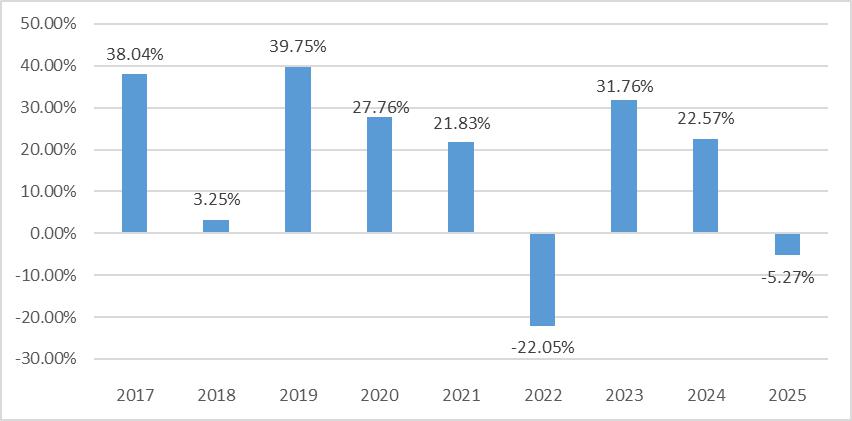
| Performance Narrative [Text Block] | Performance: The TCW Artificial Intelligence Equity Fund, a series of TCW Funds, Inc. (the “Predecessor Artificial Intelligence Mutual Fund”) was reorganized into the Fund on May 6, 2024. As a result of the reorganization, the Fund assumed the financial and performance history of the Predecessor Artificial Intelligence Mutual Fund. The Fund commenced operations May 6, 2024. The following bar chart and table provide some indication of the risks of investing in the Fund (and the Predecessor Artificial Intelligence Mutual Fund for periods prior to the reorganization) by showing how the Fund’s performance has varied from year to year. The table shows how the Fund’s average annual returns for 1 year, 5 years, and since inception compared with those of a broad measure of market performance. Had the Predecessor Artificial Intelligence Mutual Fund been structured as an ETF, its performance may have differed. The Fund’s (and the Predecessor Artificial Intelligence Mutual Fund’s) past performance (before and after taxes) is not necessarily an indication of how the Fund will perform in the future. Updated performance information will be available at no cost by visiting https://tcw.com or by calling (866) 364-1383. |
||||||||||||||||||||||||||||||||||||||||||||||||||||||||||||||||||||||||||||||||||
| Performance Past Does Not Indicate Future [Text] | The Fund’s (and the Predecessor Artificial Intelligence Mutual Fund’s) past performance (before and after taxes) is not necessarily an indication of how the Fund will perform in the future. | ||||||||||||||||||||||||||||||||||||||||||||||||||||||||||||||||||||||||||||||||||
| Performance One Year or Less [Text] | The TCW Artificial Intelligence Equity Fund, a series of TCW Funds, Inc. (the “Predecessor Artificial Intelligence Mutual Fund”) was reorganized into the Fund on May 6, 2024. As a result of the reorganization, the Fund assumed the financial and performance history of the Predecessor Artificial Intelligence Mutual Fund. The Fund commenced operations May 6, 2024. The following bar chart and table provide some indication of the risks of investing in the Fund (and the Predecessor Artificial Intelligence Mutual Fund for periods prior to the reorganization) by showing how the Fund’s performance has varied from year to year. The table shows how the Fund’s average annual returns for 1 year, 5 years, and since inception compared with those of a broad measure of market performance. | ||||||||||||||||||||||||||||||||||||||||||||||||||||||||||||||||||||||||||||||||||
| Bar Chart [Heading] | AVERAGE ANNUAL TOTAL RETURNS* (For the period ended December 31, 2025) | ||||||||||||||||||||||||||||||||||||||||||||||||||||||||||||||||||||||||||||||||||
| Bar Chart [Table] |
|
||||||||||||||||||||||||||||||||||||||||||||||||||||||||||||||||||||||||||||||||||
| Bar Chart Closing [Text Block] |
|
||||||||||||||||||||||||||||||||||||||||||||||||||||||||||||||||||||||||||||||||||
| Highest Quarterly Return, Label [Optional Text] | Best Quarter | ||||||||||||||||||||||||||||||||||||||||||||||||||||||||||||||||||||||||||||||||||
| Highest Quarterly Return | 34.85% | ||||||||||||||||||||||||||||||||||||||||||||||||||||||||||||||||||||||||||||||||||
| Highest Quarterly Return, Date | Jun. 30, 2020 | ||||||||||||||||||||||||||||||||||||||||||||||||||||||||||||||||||||||||||||||||||
| Lowest Quarterly Return, Label [Optional Text] | Worst Quarter | ||||||||||||||||||||||||||||||||||||||||||||||||||||||||||||||||||||||||||||||||||
| Lowest Quarterly Return | (25.32%) | ||||||||||||||||||||||||||||||||||||||||||||||||||||||||||||||||||||||||||||||||||
| Lowest Quarterly Return, Date | Jun. 30, 2022 | ||||||||||||||||||||||||||||||||||||||||||||||||||||||||||||||||||||||||||||||||||
| Performance Table Uses Highest Federal Rate | After-tax returns are calculated using the historical highest individual federal marginal income tax rates and do not reflect the impact of state and local taxes. | ||||||||||||||||||||||||||||||||||||||||||||||||||||||||||||||||||||||||||||||||||
| Performance Table Not Relevant to Tax Deferred | After-tax returns shown are not relevant to investors who hold shares through tax-advantaged arrangements, such as 401(k) plans or individual retirement accounts (“IRAs”). | ||||||||||||||||||||||||||||||||||||||||||||||||||||||||||||||||||||||||||||||||||
| Performance Table Explanation after Tax Higher | After-tax returns may exceed the return before taxes due to an assumed tax benefit from realizing a capital loss on a sale of shares. | ||||||||||||||||||||||||||||||||||||||||||||||||||||||||||||||||||||||||||||||||||
| Performance [Table] |
The Fund’s fiscal year end is October 31. The Fund’s most recent quarterly return (since the end of the last fiscal year) through January 31, 2026 was 0.23%.
|
||||||||||||||||||||||||||||||||||||||||||||||||||||||||||||||||||||||||||||||||||
| Performance Table One Class of after Tax Shown [Text] | Average annual total returns are shown on a before- and after-tax basis for the Fund. | ||||||||||||||||||||||||||||||||||||||||||||||||||||||||||||||||||||||||||||||||||
| Index No Deduction for Fees, Expenses, or Taxes [Text] | reflects no deduction for fees, expenses, or taxes | ||||||||||||||||||||||||||||||||||||||||||||||||||||||||||||||||||||||||||||||||||
| Performance Table Closing [Text Block] | Average annual total returns are shown on a before- and after-tax basis for the Fund. After-tax returns are calculated using the historical highest individual federal marginal income tax rates and do not reflect the impact of state and local taxes. Actual after-tax returns depend on an investor’s tax situation and may differ from those shown. After-tax returns shown are not relevant to investors who hold shares through tax-advantaged arrangements, such as 401(k) plans or individual retirement accounts (“IRAs”). After-tax returns may exceed the return before taxes due to an assumed tax benefit from realizing a capital loss on a sale of shares.
Also, shareholder reports containing financial and performance information will be mailed to shareholders semi-annually. Updated performance information will be available at no cost by visiting https://tcw.com or by calling (866) 364-1383. |
||||||||||||||||||||||||||||||||||||||||||||||||||||||||||||||||||||||||||||||||||
| Performance Availability Website Address [Text] | https://tcw.com | ||||||||||||||||||||||||||||||||||||||||||||||||||||||||||||||||||||||||||||||||||
| Performance Availability Phone [Text] | (866) 364-1383 | ||||||||||||||||||||||||||||||||||||||||||||||||||||||||||||||||||||||||||||||||||
| TCW Compounders ETF | |||||||||||||||||||||||||||||||||||||||||||||||||||||||||||||||||||||||||||||||||||
| Prospectus [Line Items] | |||||||||||||||||||||||||||||||||||||||||||||||||||||||||||||||||||||||||||||||||||
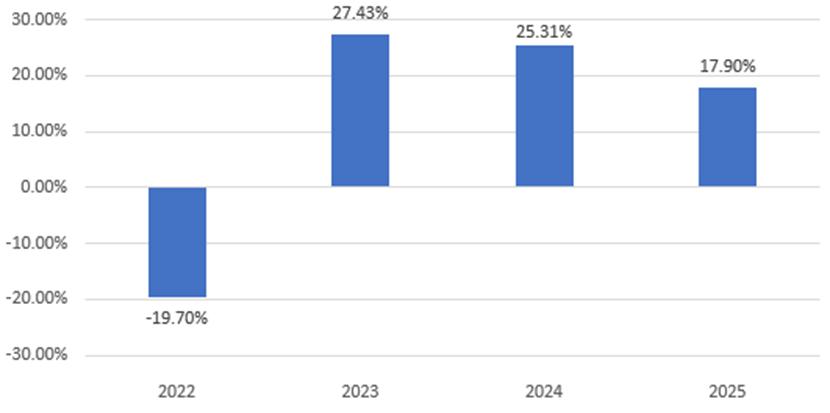
| Performance Narrative [Text Block] | Performance: The TCW New America Premier Equities Fund, a series of TCW Funds, Inc. (the “Predecessor Durable Growth Mutual Fund”) was reorganized into the Fund on May 6, 2024. As a result of the reorganization, the Fund assumed the financial and performance history of the Predecessor Durable Growth Mutual Fund. The Fund commenced operations May 6, 2024. The following bar chart and table provide some indication of the risks of investing in the Fund (and the Predecessor Durable Growth Mutual Fund for periods prior to the reorganization) by showing how the Fund’s performance has varied from year to year. The table shows how the Fund’s average annual returns for 1 year, 5 years, and since inception compared with those of a broad measure of market performance. Had the Predecessor Durable Growth Mutual Fund been structured as an ETF, its performance may have differed. The Fund’s (and the Predecessor Durable Growth Mutual Fund’s) past performance (before and after taxes) is not necessarily an indication of how the Fund will perform in the future. Updated performance information will be available at no cost by visiting https://tcw.com or by calling (866) 364-1383. |
||||||||||||||||||||||||||||||||||||||||||||||||||||||||||||||||||||||||||||||||||
| Performance Past Does Not Indicate Future [Text] | The Fund’s (and the Predecessor Durable Growth Mutual Fund’s) past performance (before and after taxes) is not necessarily an indication of how the Fund will perform in the future. | ||||||||||||||||||||||||||||||||||||||||||||||||||||||||||||||||||||||||||||||||||
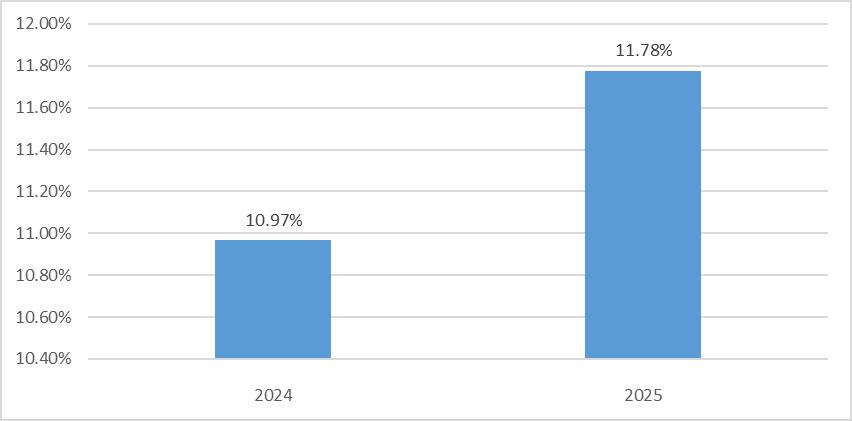
| Performance One Year or Less [Text] | The TCW New America Premier Equities Fund, a series of TCW Funds, Inc. (the “Predecessor Durable Growth Mutual Fund”) was reorganized into the Fund on May 6, 2024. As a result of the reorganization, the Fund assumed the financial and performance history of the Predecessor Durable Growth Mutual Fund. The Fund commenced operations May 6, 2024. The following bar chart and table provide some indication of the risks of investing in the Fund (and the Predecessor Durable Growth Mutual Fund for periods prior to the reorganization) by showing how the Fund’s performance has varied from year to year. The table shows how the Fund’s average annual returns for 1 year, 5 years, and since inception compared with those of a broad measure of market performance. | ||||||||||||||||||||||||||||||||||||||||||||||||||||||||||||||||||||||||||||||||||
| Bar Chart [Heading] | AVERAGE ANNUAL TOTAL RETURNS* (For the period ended December 31, 2025) | ||||||||||||||||||||||||||||||||||||||||||||||||||||||||||||||||||||||||||||||||||
| Bar Chart [Table] |
|
||||||||||||||||||||||||||||||||||||||||||||||||||||||||||||||||||||||||||||||||||
| Bar Chart Closing [Text Block] |
|
||||||||||||||||||||||||||||||||||||||||||||||||||||||||||||||||||||||||||||||||||
| Highest Quarterly Return, Label [Optional Text] | Best Quarter | ||||||||||||||||||||||||||||||||||||||||||||||||||||||||||||||||||||||||||||||||||
| Highest Quarterly Return | 21.56% | ||||||||||||||||||||||||||||||||||||||||||||||||||||||||||||||||||||||||||||||||||
| Highest Quarterly Return, Date | Jun. 30, 2020 | ||||||||||||||||||||||||||||||||||||||||||||||||||||||||||||||||||||||||||||||||||
| Lowest Quarterly Return, Label [Optional Text] | Worst Quarter | ||||||||||||||||||||||||||||||||||||||||||||||||||||||||||||||||||||||||||||||||||
| Lowest Quarterly Return | (16.60%) | ||||||||||||||||||||||||||||||||||||||||||||||||||||||||||||||||||||||||||||||||||
| Lowest Quarterly Return, Date | Mar. 31, 2022 | ||||||||||||||||||||||||||||||||||||||||||||||||||||||||||||||||||||||||||||||||||
| Performance Table Uses Highest Federal Rate | After-tax returns are calculated using the historical highest individual federal marginal income tax rates and do not reflect the impact of state and local taxes. | ||||||||||||||||||||||||||||||||||||||||||||||||||||||||||||||||||||||||||||||||||
| Performance Table Not Relevant to Tax Deferred | After-tax returns shown are not relevant to investors who hold shares through tax-advantaged arrangements, such as 401(k) plans or individual retirement accounts (“IRAs”). | ||||||||||||||||||||||||||||||||||||||||||||||||||||||||||||||||||||||||||||||||||
| Performance Table Explanation after Tax Higher | After-tax returns may exceed the return before taxes due to an assumed tax benefit from realizing a capital loss on a sale of shares. | ||||||||||||||||||||||||||||||||||||||||||||||||||||||||||||||||||||||||||||||||||
| Performance [Table] |
The Fund’s fiscal year end is October 31. The Fund’s most recent quarterly return (since the end of the last fiscal year) through January 31, 2026 was -3.41%.
|
||||||||||||||||||||||||||||||||||||||||||||||||||||||||||||||||||||||||||||||||||
| Performance Table One Class of after Tax Shown [Text] | Average annual total returns are shown on a before- and after-tax basis for the Fund. | ||||||||||||||||||||||||||||||||||||||||||||||||||||||||||||||||||||||||||||||||||
| Index No Deduction for Fees, Expenses, or Taxes [Text] | reflects no deduction for fees, expenses, or taxes | ||||||||||||||||||||||||||||||||||||||||||||||||||||||||||||||||||||||||||||||||||
| Performance Table Closing [Text Block] | Average annual total returns are shown on a before- and after-tax basis for the Fund. After-tax returns are calculated using the historical highest individual federal marginal income tax rates and do not reflect the impact of state and local taxes. Actual after-tax returns depend on an investor’s tax situation and may differ from those shown. After-tax returns shown are not relevant to investors who hold shares through tax-advantaged arrangements, such as 401(k) plans or individual retirement accounts (“IRAs”). After-tax returns may exceed the return before taxes due to an assumed tax benefit from realizing a capital loss on a sale of shares.
Also, shareholder reports containing financial and performance information will be mailed to shareholders semi-annually. Updated performance information will be available at no cost by visiting https://tcw.com or by calling (866) 364-1383. |
||||||||||||||||||||||||||||||||||||||||||||||||||||||||||||||||||||||||||||||||||
| Performance Availability Website Address [Text] | https://tcw.com | ||||||||||||||||||||||||||||||||||||||||||||||||||||||||||||||||||||||||||||||||||
| Performance Availability Phone [Text] | (866) 364-1383 | ||||||||||||||||||||||||||||||||||||||||||||||||||||||||||||||||||||||||||||||||||
| TCW Transform 500 ETF | |||||||||||||||||||||||||||||||||||||||||||||||||||||||||||||||||||||||||||||||||||
| Prospectus [Line Items] | |||||||||||||||||||||||||||||||||||||||||||||||||||||||||||||||||||||||||||||||||||
| Performance Narrative [Text Block] | Performance: The accompanying bar chart and table provide some indication of the risks of investing in the Fund. The bar chart shows changes in the Fund’s year-to-year performance and the table shows how the Fund’s average annual total returns for the one-year and since inception periods compared to that of a broad measure of market performance. The Fund’s past performance (before and after taxes) is not necessarily an indication of how the Fund will perform in the future. |
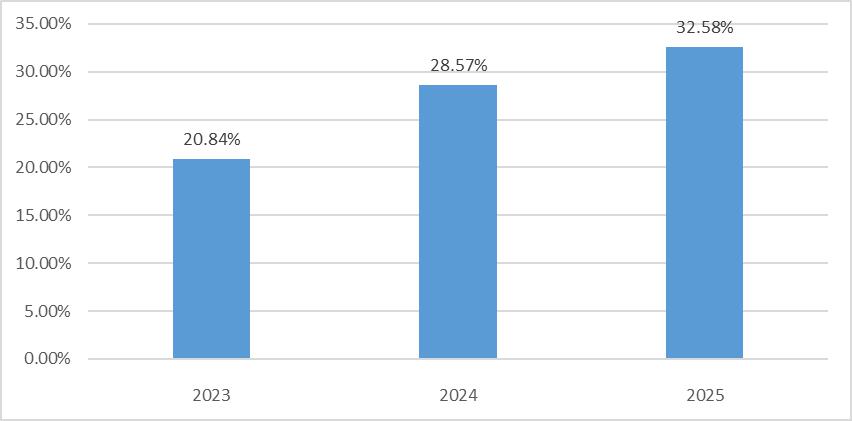
||||||||||||||||||||||||||||||||||||||||||||||||||||||||||||||||||||||||||||||||||
| Performance Past Does Not Indicate Future [Text] | The Fund’s past performance (before and after taxes) is not necessarily an indication of how the Fund will perform in the future. | ||||||||||||||||||||||||||||||||||||||||||||||||||||||||||||||||||||||||||||||||||
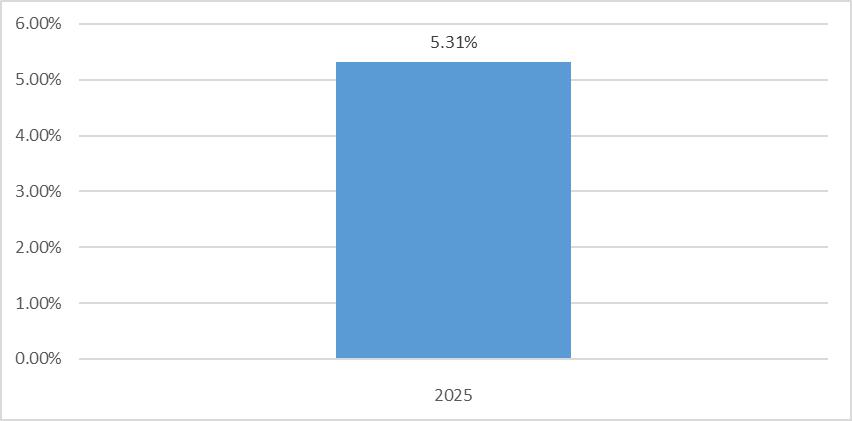
| Performance One Year or Less [Text] | The accompanying bar chart and table provide some indication of the risks of investing in the Fund. The bar chart shows changes in the Fund’s year-to-year performance and the table shows how the Fund’s average annual total returns for the one-year and since inception periods compared to that of a broad measure of market performance. | ||||||||||||||||||||||||||||||||||||||||||||||||||||||||||||||||||||||||||||||||||
| Bar Chart [Heading] | AVERAGE ANNUAL TOTAL RETURNS* (For the period ended December 31, 2025) | ||||||||||||||||||||||||||||||||||||||||||||||||||||||||||||||||||||||||||||||||||
| Bar Chart [Table] |
|
||||||||||||||||||||||||||||||||||||||||||||||||||||||||||||||||||||||||||||||||||
| Bar Chart Closing [Text Block] |
|
||||||||||||||||||||||||||||||||||||||||||||||||||||||||||||||||||||||||||||||||||
| Highest Quarterly Return, Label [Optional Text] | Best Quarter | ||||||||||||||||||||||||||||||||||||||||||||||||||||||||||||||||||||||||||||||||||
| Highest Quarterly Return | 11.94% | ||||||||||||||||||||||||||||||||||||||||||||||||||||||||||||||||||||||||||||||||||
| Highest Quarterly Return, Date | Dec. 31, 2023 | ||||||||||||||||||||||||||||||||||||||||||||||||||||||||||||||||||||||||||||||||||
| Lowest Quarterly Return, Label [Optional Text] | Worst Quarter | ||||||||||||||||||||||||||||||||||||||||||||||||||||||||||||||||||||||||||||||||||
| Lowest Quarterly Return | (16.90%) | ||||||||||||||||||||||||||||||||||||||||||||||||||||||||||||||||||||||||||||||||||
| Lowest Quarterly Return, Date | Jun. 30, 2022 | ||||||||||||||||||||||||||||||||||||||||||||||||||||||||||||||||||||||||||||||||||
| Performance Table Uses Highest Federal Rate | After-tax returns are calculated using the historical highest individual federal marginal income tax rates and do not reflect the impact of state and local taxes. | ||||||||||||||||||||||||||||||||||||||||||||||||||||||||||||||||||||||||||||||||||
| Performance Table Not Relevant to Tax Deferred | After-tax returns shown are not relevant to investors who hold shares through tax-advantaged arrangements, such as 401(k) plans or individual retirement accounts (“IRAs”). | ||||||||||||||||||||||||||||||||||||||||||||||||||||||||||||||||||||||||||||||||||
| Performance Table Explanation after Tax Higher | After-tax returns may exceed the return before taxes due to an assumed tax benefit from realizing a capital loss on a sale of shares. | ||||||||||||||||||||||||||||||||||||||||||||||||||||||||||||||||||||||||||||||||||
| Performance [Table] |
The Fund’s fiscal year end is October 31. The Fund’s most recent quarterly return (since the end of the last fiscal year) through January 31, 2026 was 1.31%.
|
||||||||||||||||||||||||||||||||||||||||||||||||||||||||||||||||||||||||||||||||||
| Performance Table One Class of after Tax Shown [Text] | Average annual total returns are shown on a before- and after-tax basis for the Fund. | ||||||||||||||||||||||||||||||||||||||||||||||||||||||||||||||||||||||||||||||||||
| Index No Deduction for Fees, Expenses, or Taxes [Text] | reflects no deduction for fees, expenses, or taxes | ||||||||||||||||||||||||||||||||||||||||||||||||||||||||||||||||||||||||||||||||||
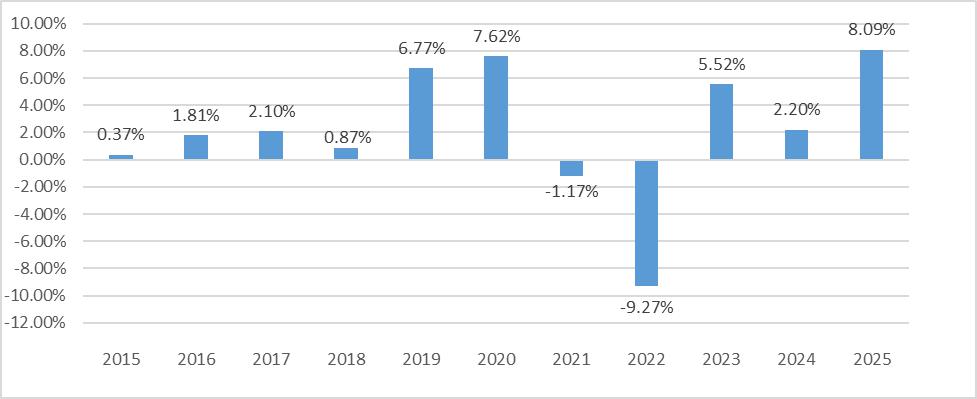
| Performance Table Closing [Text Block] | Average annual total returns are shown on a before- and after-tax basis for the Fund. After-tax returns are calculated using the historical highest individual federal marginal income tax rates and do not reflect the impact of state and local taxes. Actual after-tax returns depend on an investor’s tax situation and may differ from those shown. After-tax returns shown are not relevant to investors who hold shares through tax-advantaged arrangements, such as 401(k) plans or individual retirement accounts (“IRAs”). After-tax returns may exceed the return before taxes due to an assumed tax benefit from realizing a capital loss on a sale of shares.
Also, shareholder reports containing financial and performance information will be mailed to shareholders semi-annually. Updated performance information will be available at no cost by visiting https://tcw.com or by calling (866) 364-1383. |
||||||||||||||||||||||||||||||||||||||||||||||||||||||||||||||||||||||||||||||||||
| Performance Availability Website Address [Text] | https://tcw.com | ||||||||||||||||||||||||||||||||||||||||||||||||||||||||||||||||||||||||||||||||||
| Performance Availability Phone [Text] | (866) 364-1383 | ||||||||||||||||||||||||||||||||||||||||||||||||||||||||||||||||||||||||||||||||||
| TCW Transform Supply Chain ETF | |||||||||||||||||||||||||||||||||||||||||||||||||||||||||||||||||||||||||||||||||||
| Prospectus [Line Items] | |||||||||||||||||||||||||||||||||||||||||||||||||||||||||||||||||||||||||||||||||||
| Performance Narrative [Text Block] | Performance: The accompanying bar chart and table provide some indication of the risks of investing in the Fund. The bar chart shows changes in the Fund’s year-to-year performance and the table shows how the Fund’s average annual total returns for the one-year and since inception periods compared to that of a broad measure of market performance. The Fund’s past performance (before and after taxes) is not necessarily an indication of how the Fund will perform in the future. |
||||||||||||||||||||||||||||||||||||||||||||||||||||||||||||||||||||||||||||||||||
| Performance Past Does Not Indicate Future [Text] | The Fund’s past performance (before and after taxes) is not necessarily an indication of how the Fund will perform in the future. | ||||||||||||||||||||||||||||||||||||||||||||||||||||||||||||||||||||||||||||||||||
| Performance One Year or Less [Text] | The accompanying bar chart and table provide some indication of the risks of investing in the Fund. The bar chart shows changes in the Fund’s year-to-year performance and the table shows how the Fund’s average annual total returns for the one-year and since inception periods compared to that of a broad measure of market performance. | ||||||||||||||||||||||||||||||||||||||||||||||||||||||||||||||||||||||||||||||||||
| Bar Chart [Heading] | AVERAGE ANNUAL TOTAL RETURNS* (For the period ended December 31, 2025) | ||||||||||||||||||||||||||||||||||||||||||||||||||||||||||||||||||||||||||||||||||
| Bar Chart [Table] |
|
||||||||||||||||||||||||||||||||||||||||||||||||||||||||||||||||||||||||||||||||||
| Bar Chart Closing [Text Block] |
|
||||||||||||||||||||||||||||||||||||||||||||||||||||||||||||||||||||||||||||||||||
| Highest Quarterly Return, Label [Optional Text] | Best Quarter | ||||||||||||||||||||||||||||||||||||||||||||||||||||||||||||||||||||||||||||||||||
| Highest Quarterly Return | 16.68% | ||||||||||||||||||||||||||||||||||||||||||||||||||||||||||||||||||||||||||||||||||
| Highest Quarterly Return, Date | Jun. 30, 2025 | ||||||||||||||||||||||||||||||||||||||||||||||||||||||||||||||||||||||||||||||||||
| Lowest Quarterly Return, Label [Optional Text] | Worst Quarter | ||||||||||||||||||||||||||||||||||||||||||||||||||||||||||||||||||||||||||||||||||
| Lowest Quarterly Return | (7.99%) | ||||||||||||||||||||||||||||||||||||||||||||||||||||||||||||||||||||||||||||||||||
| Lowest Quarterly Return, Date | Mar. 31, 2025 | ||||||||||||||||||||||||||||||||||||||||||||||||||||||||||||||||||||||||||||||||||
| Performance Table Uses Highest Federal Rate | After-tax returns are calculated using the historical highest individual federal marginal income tax rates and do not reflect the impact of state and local taxes. | ||||||||||||||||||||||||||||||||||||||||||||||||||||||||||||||||||||||||||||||||||
| Performance Table Not Relevant to Tax Deferred | After-tax returns shown are not relevant to investors who hold shares through tax-advantaged arrangements, such as 401(k) plans or individual retirement accounts (“IRAs”). | ||||||||||||||||||||||||||||||||||||||||||||||||||||||||||||||||||||||||||||||||||
| Performance Table Explanation after Tax Higher | After-tax returns may exceed the return before taxes due to an assumed tax benefit from realizing a capital loss on a sale of shares. | ||||||||||||||||||||||||||||||||||||||||||||||||||||||||||||||||||||||||||||||||||
| Performance [Table] |
The Fund’s fiscal year end is October 31. The Fund’s most recent quarterly return (since the end of the last fiscal year) through January 31, 2026 was 0.33%.
|
||||||||||||||||||||||||||||||||||||||||||||||||||||||||||||||||||||||||||||||||||
| Performance Table One Class of after Tax Shown [Text] | Average annual total returns are shown on a before- and after-tax basis for the Fund. | ||||||||||||||||||||||||||||||||||||||||||||||||||||||||||||||||||||||||||||||||||
| Index No Deduction for Fees, Expenses, or Taxes [Text] | reflects no deduction for fees, expenses, or taxes | ||||||||||||||||||||||||||||||||||||||||||||||||||||||||||||||||||||||||||||||||||
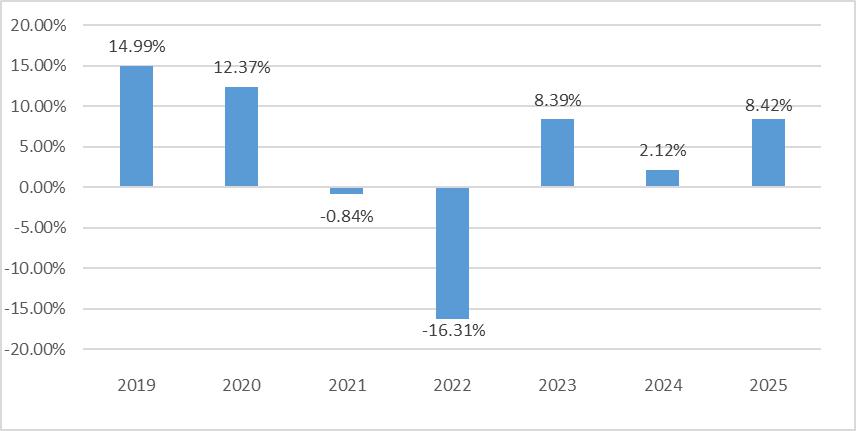
| Performance Table Closing [Text Block] | Average annual total returns are shown on a before- and after-tax basis for the Fund. After-tax returns are calculated using the historical highest individual federal marginal income tax rates and do not reflect the impact of state and local taxes. Actual after-tax returns depend on an investor’s tax situation and may differ from those shown. After-tax returns shown are not relevant to investors who hold shares through tax-advantaged arrangements, such as 401(k) plans or individual retirement accounts (“IRAs”). After-tax returns may exceed the return before taxes due to an assumed tax benefit from realizing a capital loss on a sale of shares.
Also, shareholder reports containing financial and performance information will be mailed to shareholders semi-annually. Updated performance information will be available at no cost by visiting https://tcw.com or by calling (866) 364-1383. |
||||||||||||||||||||||||||||||||||||||||||||||||||||||||||||||||||||||||||||||||||
| Performance Availability Website Address [Text] | https://tcw.com | ||||||||||||||||||||||||||||||||||||||||||||||||||||||||||||||||||||||||||||||||||
| Performance Availability Phone [Text] | (866) 364-1383 | ||||||||||||||||||||||||||||||||||||||||||||||||||||||||||||||||||||||||||||||||||
| TCW Transform Systems ETF | |||||||||||||||||||||||||||||||||||||||||||||||||||||||||||||||||||||||||||||||||||
| Prospectus [Line Items] | |||||||||||||||||||||||||||||||||||||||||||||||||||||||||||||||||||||||||||||||||||
| Performance Narrative [Text Block] | Performance: The accompanying bar chart and table provide some indication of the risks of investing in the Fund. The bar chart shows changes in the Fund’s year-to-year performance and the table shows how the Fund’s average annual total returns for the one-year and since inception periods compared to that of a broad measure of market performance. The Fund’s past performance (before and after taxes) is not necessarily an indication of how the Fund will perform in the future. |
||||||||||||||||||||||||||||||||||||||||||||||||||||||||||||||||||||||||||||||||||
| Performance Past Does Not Indicate Future [Text] | The Fund’s past performance (before and after taxes) is not necessarily an indication of how the Fund will perform in the future. | ||||||||||||||||||||||||||||||||||||||||||||||||||||||||||||||||||||||||||||||||||
| Performance One Year or Less [Text] | The accompanying bar chart and table provide some indication of the risks of investing in the Fund. The bar chart shows changes in the Fund’s year-to-year performance and the table shows how the Fund’s average annual total returns for the one-year and since inception periods compared to that of a broad measure of market performance. | ||||||||||||||||||||||||||||||||||||||||||||||||||||||||||||||||||||||||||||||||||
| Bar Chart [Heading] | AVERAGE ANNUAL TOTAL RETURNS* (For the period ended December 31, 2025) | ||||||||||||||||||||||||||||||||||||||||||||||||||||||||||||||||||||||||||||||||||
| Bar Chart [Table] |
|
||||||||||||||||||||||||||||||||||||||||||||||||||||||||||||||||||||||||||||||||||
| Bar Chart Closing [Text Block] |
|
||||||||||||||||||||||||||||||||||||||||||||||||||||||||||||||||||||||||||||||||||
| Highest Quarterly Return, Label [Optional Text] | Best Quarter | ||||||||||||||||||||||||||||||||||||||||||||||||||||||||||||||||||||||||||||||||||
| Highest Quarterly Return | 29.37% | ||||||||||||||||||||||||||||||||||||||||||||||||||||||||||||||||||||||||||||||||||
| Highest Quarterly Return, Date | Mar. 31, 2024 | ||||||||||||||||||||||||||||||||||||||||||||||||||||||||||||||||||||||||||||||||||
| Lowest Quarterly Return, Label [Optional Text] | Worst Quarter | ||||||||||||||||||||||||||||||||||||||||||||||||||||||||||||||||||||||||||||||||||
| Lowest Quarterly Return | (19.05%) | ||||||||||||||||||||||||||||||||||||||||||||||||||||||||||||||||||||||||||||||||||
| Lowest Quarterly Return, Date | Jun. 30, 2022 | ||||||||||||||||||||||||||||||||||||||||||||||||||||||||||||||||||||||||||||||||||
| Performance Table Uses Highest Federal Rate | After-tax returns are calculated using the historical highest individual federal marginal income tax rates and do not reflect the impact of state and local taxes. | ||||||||||||||||||||||||||||||||||||||||||||||||||||||||||||||||||||||||||||||||||
| Performance Table Not Relevant to Tax Deferred | After-tax returns shown are not relevant to investors who hold shares through tax-advantaged arrangements, such as 401(k) plans or individual retirement accounts (“IRAs”). | ||||||||||||||||||||||||||||||||||||||||||||||||||||||||||||||||||||||||||||||||||
| Performance Table Explanation after Tax Higher | After-tax returns may exceed the return before taxes due to an assumed tax benefit from realizing a capital loss on a sale of shares. | ||||||||||||||||||||||||||||||||||||||||||||||||||||||||||||||||||||||||||||||||||
| Performance [Table] |
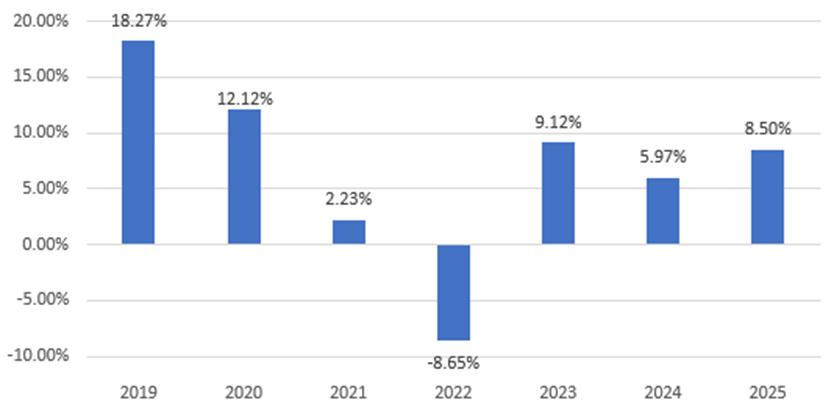
The Fund’s fiscal year end is October 31. The Fund’s most recent quarterly return (since the end of the last fiscal year) through January 31, 2026 was -2.41%.
|
||||||||||||||||||||||||||||||||||||||||||||||||||||||||||||||||||||||||||||||||||
| Performance Table One Class of after Tax Shown [Text] | Average annual total returns are shown on a before- and after-tax basis for the Fund. | ||||||||||||||||||||||||||||||||||||||||||||||||||||||||||||||||||||||||||||||||||
| Index No Deduction for Fees, Expenses, or Taxes [Text] | reflects no deduction for fees, expenses, or taxes | ||||||||||||||||||||||||||||||||||||||||||||||||||||||||||||||||||||||||||||||||||
| Performance Table Closing [Text Block] | Average annual total returns are shown on a before- and after-tax basis for the Fund. After-tax returns are calculated using the historical highest individual federal marginal income tax rates and do not reflect the impact of state and local taxes. Actual after-tax returns depend on an investor’s tax situation and may differ from those shown. After-tax returns shown are not relevant to investors who hold shares through tax-advantaged arrangements, such as 401(k) plans or individual retirement accounts (“IRAs”). After-tax returns may exceed the return before taxes due to an assumed tax benefit from realizing a capital loss on a sale of shares.
Also, shareholder reports containing financial and performance information will be mailed to shareholders semi-annually. Updated performance information will be available at no cost by visiting https://tcw.com or by calling (866) 364-1383. |
||||||||||||||||||||||||||||||||||||||||||||||||||||||||||||||||||||||||||||||||||
| Performance Availability Website Address [Text] | https://tcw.com | ||||||||||||||||||||||||||||||||||||||||||||||||||||||||||||||||||||||||||||||||||
| Performance Availability Phone [Text] | (866) 364-1383 | ||||||||||||||||||||||||||||||||||||||||||||||||||||||||||||||||||||||||||||||||||
| TCW AAA CLO ETF | |||||||||||||||||||||||||||||||||||||||||||||||||||||||||||||||||||||||||||||||||||
| Prospectus [Line Items] | |||||||||||||||||||||||||||||||||||||||||||||||||||||||||||||||||||||||||||||||||||
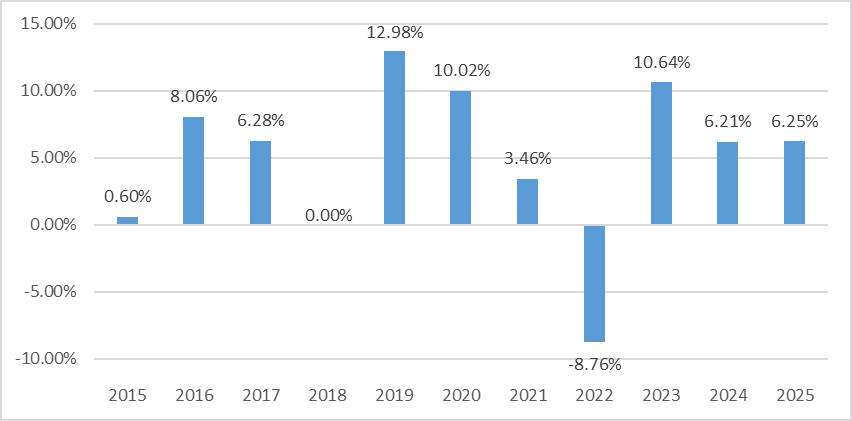
| Performance Narrative [Text Block] | Performance: The accompanying bar chart and table provide some indication of the risks of investing in the Fund. The bar chart shows changes in the Fund’s year-to-year performance and the table shows how the Fund’s average annual total returns for the one-year and since inception periods compared to that of a broad measure of market performance. The Fund’s past performance (before and after taxes) is not necessarily an indication of how the Fund will perform in the future. |
||||||||||||||||||||||||||||||||||||||||||||||||||||||||||||||||||||||||||||||||||
| Performance Past Does Not Indicate Future [Text] | The Fund’s past performance (before and after taxes) is not necessarily an indication of how the Fund will perform in the future. | ||||||||||||||||||||||||||||||||||||||||||||||||||||||||||||||||||||||||||||||||||
| Performance One Year or Less [Text] | The accompanying bar chart and table provide some indication of the risks of investing in the Fund. The bar chart shows changes in the Fund’s year-to-year performance and the table shows how the Fund’s average annual total returns for the one-year and since inception periods compared to that of a broad measure of market performance. | ||||||||||||||||||||||||||||||||||||||||||||||||||||||||||||||||||||||||||||||||||
| Bar Chart [Heading] | AVERAGE ANNUAL TOTAL RETURNS* (For the period ended December 31, 2025) | ||||||||||||||||||||||||||||||||||||||||||||||||||||||||||||||||||||||||||||||||||
| Bar Chart [Table] |
|
||||||||||||||||||||||||||||||||||||||||||||||||||||||||||||||||||||||||||||||||||
| Bar Chart Closing [Text Block] |
|
||||||||||||||||||||||||||||||||||||||||||||||||||||||||||||||||||||||||||||||||||
| Highest Quarterly Return, Label [Optional Text] | Best Quarter | ||||||||||||||||||||||||||||||||||||||||||||||||||||||||||||||||||||||||||||||||||
| Highest Quarterly Return | 1.55% | ||||||||||||||||||||||||||||||||||||||||||||||||||||||||||||||||||||||||||||||||||
| Highest Quarterly Return, Date | Jun. 30, 2025 | ||||||||||||||||||||||||||||||||||||||||||||||||||||||||||||||||||||||||||||||||||
| Lowest Quarterly Return, Label [Optional Text] | Worst Quarter | ||||||||||||||||||||||||||||||||||||||||||||||||||||||||||||||||||||||||||||||||||
| Lowest Quarterly Return | 1.15% | ||||||||||||||||||||||||||||||||||||||||||||||||||||||||||||||||||||||||||||||||||
| Lowest Quarterly Return, Date | Mar. 31, 2025 | ||||||||||||||||||||||||||||||||||||||||||||||||||||||||||||||||||||||||||||||||||
| Performance Table Uses Highest Federal Rate | After-tax returns are calculated using the historical highest individual federal marginal income tax rates and do not reflect the impact of state and local taxes. | ||||||||||||||||||||||||||||||||||||||||||||||||||||||||||||||||||||||||||||||||||
| Performance Table Not Relevant to Tax Deferred | After-tax returns shown are not relevant to investors who hold shares through tax-advantaged arrangements, such as 401(k) plans or individual retirement accounts (“IRAs”). | ||||||||||||||||||||||||||||||||||||||||||||||||||||||||||||||||||||||||||||||||||
| Performance Table Explanation after Tax Higher | After-tax returns may exceed the return before taxes due to an assumed tax benefit from realizing a capital loss on a sale of shares. | ||||||||||||||||||||||||||||||||||||||||||||||||||||||||||||||||||||||||||||||||||
| Performance [Table] |
|
||||||||||||||||||||||||||||||||||||||||||||||||||||||||||||||||||||||||||||||||||
| Performance Table One Class of after Tax Shown [Text] | Average annual total returns are shown on a before- and after-tax basis for the Fund. | ||||||||||||||||||||||||||||||||||||||||||||||||||||||||||||||||||||||||||||||||||
| Performance Table Closing [Text Block] | The Fund’s fiscal year end is October 31. The Fund’s most recent quarterly return (since the end of the last fiscal year) through January 31, 2026 was 1.37%.
Average annual total returns are shown on a before- and after-tax basis for the Fund. After-tax returns are calculated using the historical highest individual federal marginal income tax rates and do not reflect the impact of state and local taxes. Actual after-tax returns depend on an investor’s tax situation and may differ from those shown. After-tax returns shown are not relevant to investors who hold shares through tax-advantaged arrangements, such as 401(k) plans or individual retirement accounts (“IRAs”). After-tax returns may exceed the return before taxes due to an assumed tax benefit from realizing a capital loss on a sale of shares.
Also, shareholder reports containing financial and performance information will be mailed to shareholders semi-annually. Updated performance information will be available at no cost by visiting https://tcw.com or by calling (866) 364-1383. |
||||||||||||||||||||||||||||||||||||||||||||||||||||||||||||||||||||||||||||||||||
| Performance Availability Website Address [Text] | https://tcw.com | ||||||||||||||||||||||||||||||||||||||||||||||||||||||||||||||||||||||||||||||||||
| Performance Availability Phone [Text] | (866) 364-1383 | ||||||||||||||||||||||||||||||||||||||||||||||||||||||||||||||||||||||||||||||||||
| TCW Core Plus Bond ETF | |||||||||||||||||||||||||||||||||||||||||||||||||||||||||||||||||||||||||||||||||||
| Prospectus [Line Items] | |||||||||||||||||||||||||||||||||||||||||||||||||||||||||||||||||||||||||||||||||||
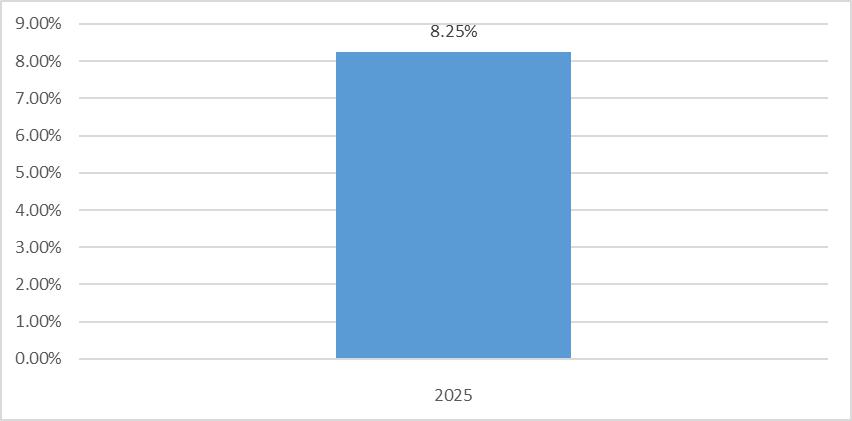
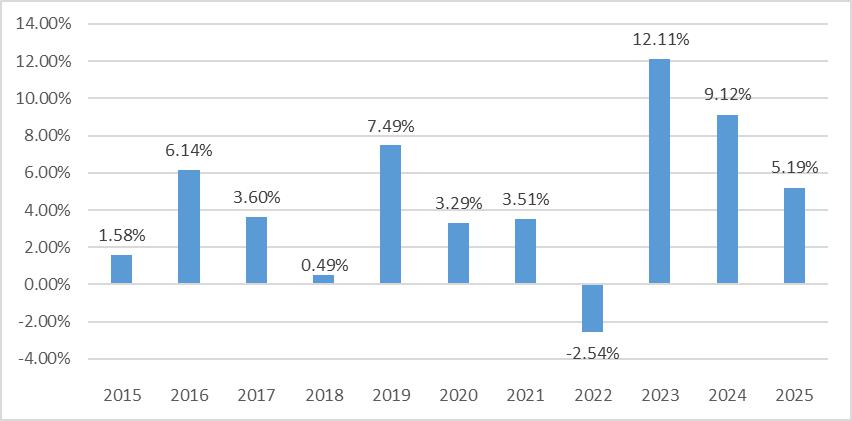
| Performance Narrative [Text Block] | Performance: The following bar chart and table provide some indication of the risks of investing in the Fund. The Fund is adopting the performance of the TCW MetWest Intermediate Bond Fund (the “Predecessor Intermediate Bond Mutual Fund”) as the result of the Reorganization. Prior to the Reorganization, the Fund had not yet commenced operations. The bar chart shows changes in the Predecessor Intermediate Bond Mutual Fund’s performance from year to year (represented by the performance of the Predecessor Intermediate Bond Mutual Fund’s Class I Shares). The table shows how the Predecessor Intermediate Bond Mutual Fund’s average annual returns (represented by the average annual returns of the Predecessor Intermediate Bond Mutual Fund’s Class I Shares) for 1 year, 5 years and 10 years compared with those of an appropriate broad-based securities market index and a secondary benchmark index. Had the Predecessor Intermediate Bond Mutual Fund been structured as an ETF, its performance may have differed. The Fund’s (and the Predecessor Intermediate Bond Mutual Fund’s) past performance (before and after taxes) is not necessarily an indication of how the Fund will perform in the future. Updated performance information will be available at no cost by visiting https://tcw.com or by calling (866) 364-1383. |
||||||||||||||||||||||||||||||||||||||||||||||||||||||||||||||||||||||||||||||||||
| Performance Past Does Not Indicate Future [Text] | The Fund’s (and the Predecessor Intermediate Bond Mutual Fund’s) past performance (before and after taxes) is not necessarily an indication of how the Fund will perform in the future. | ||||||||||||||||||||||||||||||||||||||||||||||||||||||||||||||||||||||||||||||||||
| Performance One Year or Less [Text] | The following bar chart and table provide some indication of the risks of investing in the Fund. The Fund is adopting the performance of the TCW MetWest Intermediate Bond Fund (the “Predecessor Intermediate Bond Mutual Fund”) as the result of the Reorganization. Prior to the Reorganization, the Fund had not yet commenced operations. The bar chart shows changes in the Predecessor Intermediate Bond Mutual Fund’s performance from year to year (represented by the performance of the Predecessor Intermediate Bond Mutual Fund’s Class I Shares). The table shows how the Predecessor Intermediate Bond Mutual Fund’s average annual returns (represented by the average annual returns of the Predecessor Intermediate Bond Mutual Fund’s Class I Shares) for 1 year, 5 years and 10 years compared with those of an appropriate broad-based securities market index and a secondary benchmark index. | ||||||||||||||||||||||||||||||||||||||||||||||||||||||||||||||||||||||||||||||||||
| Bar Chart [Heading] | AVERAGE ANNUAL TOTAL RETURNS* (For the period ended December 31, 2025) | ||||||||||||||||||||||||||||||||||||||||||||||||||||||||||||||||||||||||||||||||||
| Bar Chart [Table] |
|
||||||||||||||||||||||||||||||||||||||||||||||||||||||||||||||||||||||||||||||||||
| Bar Chart Closing [Text Block] |
|
||||||||||||||||||||||||||||||||||||||||||||||||||||||||||||||||||||||||||||||||||
| Highest Quarterly Return, Label [Optional Text] | Best Quarter | ||||||||||||||||||||||||||||||||||||||||||||||||||||||||||||||||||||||||||||||||||
| Highest Quarterly Return | 5.13% | ||||||||||||||||||||||||||||||||||||||||||||||||||||||||||||||||||||||||||||||||||
| Highest Quarterly Return, Date | Dec. 31, 2023 | ||||||||||||||||||||||||||||||||||||||||||||||||||||||||||||||||||||||||||||||||||
| Lowest Quarterly Return, Label [Optional Text] | Worst Quarter | ||||||||||||||||||||||||||||||||||||||||||||||||||||||||||||||||||||||||||||||||||
| Lowest Quarterly Return | (4.51%) | ||||||||||||||||||||||||||||||||||||||||||||||||||||||||||||||||||||||||||||||||||
| Lowest Quarterly Return, Date | Mar. 31, 2022 | ||||||||||||||||||||||||||||||||||||||||||||||||||||||||||||||||||||||||||||||||||
| Performance [Table] |
The Fund’s fiscal year end is October 31. The Fund’s most recent quarterly return (since the end of the last fiscal year) through January 31, 2026 was 0.68%. |
||||||||||||||||||||||||||||||||||||||||||||||||||||||||||||||||||||||||||||||||||
| Performance Availability Website Address [Text] | https://tcw.com | ||||||||||||||||||||||||||||||||||||||||||||||||||||||||||||||||||||||||||||||||||
| Performance Availability Phone [Text] | (866) 364-1383 | ||||||||||||||||||||||||||||||||||||||||||||||||||||||||||||||||||||||||||||||||||
| TCW Corporate Bond ETF | |||||||||||||||||||||||||||||||||||||||||||||||||||||||||||||||||||||||||||||||||||
| Prospectus [Line Items] | |||||||||||||||||||||||||||||||||||||||||||||||||||||||||||||||||||||||||||||||||||
| Performance Narrative [Text Block] | Performance: The TCW MetWest Corporate Bond Fund (the “Predecessor Corporate Bond Mutual Fund”) was reorganized into the Fund on November 18, 2024. As a result of the reorganization, the Fund assumed the financial and performance history of the Predecessor Corporate Bond Mutual Fund. The Fund commenced operations on November 18, 2024. The following bar chart and table provide some indication of the risks of investing in the Fund (and the Predecessor Corporate Bond Mutual Fund for periods prior to the reorganization) by showing how the Fund’s performance has varied from year to year. The table shows how the Fund’s average annual returns for 1 year, 5 years and since inception compared with those of an appropriate broad-based securities market index. Had the Predecessor Corporate Bond Mutual Fund been structured as an ETF, its performance may have differed. The Fund’s (and the Predecessor Corporate Bond Mutual Fund’s) past performance (before and after taxes) is not necessarily an indication of how the Fund will perform in the future. Updated performance information will be available at no cost by visiting https://tcw.com or by calling (866) 364-1383. |
||||||||||||||||||||||||||||||||||||||||||||||||||||||||||||||||||||||||||||||||||
| Performance Past Does Not Indicate Future [Text] | The Fund’s (and the Predecessor Corporate Bond Mutual Fund’s) past performance (before and after taxes) is not necessarily an indication of how the Fund will perform in the future. | ||||||||||||||||||||||||||||||||||||||||||||||||||||||||||||||||||||||||||||||||||
| Performance One Year or Less [Text] | The TCW MetWest Corporate Bond Fund (the “Predecessor Corporate Bond Mutual Fund”) was reorganized into the Fund on November 18, 2024. As a result of the reorganization, the Fund assumed the financial and performance history of the Predecessor Corporate Bond Mutual Fund. The Fund commenced operations on November 18, 2024. The following bar chart and table provide some indication of the risks of investing in the Fund (and the Predecessor Corporate Bond Mutual Fund for periods prior to the reorganization) by showing how the Fund’s performance has varied from year to year. The table shows how the Fund’s average annual returns for 1 year, 5 years and since inception compared with those of an appropriate broad-based securities market index. | ||||||||||||||||||||||||||||||||||||||||||||||||||||||||||||||||||||||||||||||||||
| Bar Chart [Heading] | AVERAGE ANNUAL TOTAL RETURNS* (For the period ended December 31, 2025) | ||||||||||||||||||||||||||||||||||||||||||||||||||||||||||||||||||||||||||||||||||
| Bar Chart [Table] |
|
||||||||||||||||||||||||||||||||||||||||||||||||||||||||||||||||||||||||||||||||||
| Bar Chart Closing [Text Block] |
|
||||||||||||||||||||||||||||||||||||||||||||||||||||||||||||||||||||||||||||||||||
| Highest Quarterly Return, Label [Optional Text] | Best Quarter | ||||||||||||||||||||||||||||||||||||||||||||||||||||||||||||||||||||||||||||||||||
| Highest Quarterly Return | 8.78% | ||||||||||||||||||||||||||||||||||||||||||||||||||||||||||||||||||||||||||||||||||
| Highest Quarterly Return, Date | Dec. 31, 2023 | ||||||||||||||||||||||||||||||||||||||||||||||||||||||||||||||||||||||||||||||||||
| Lowest Quarterly Return, Label [Optional Text] | Worst Quarter | ||||||||||||||||||||||||||||||||||||||||||||||||||||||||||||||||||||||||||||||||||
| Lowest Quarterly Return | (7.56%) | ||||||||||||||||||||||||||||||||||||||||||||||||||||||||||||||||||||||||||||||||||
| Lowest Quarterly Return, Date | Mar. 31, 2022 | ||||||||||||||||||||||||||||||||||||||||||||||||||||||||||||||||||||||||||||||||||
| Performance Table Uses Highest Federal Rate | After-tax returns are calculated using the historical highest individual federal marginal income tax rates and do not reflect the impact of state and local taxes. | ||||||||||||||||||||||||||||||||||||||||||||||||||||||||||||||||||||||||||||||||||
| Performance Table Not Relevant to Tax Deferred | After-tax returns shown are not relevant to investors who hold shares through tax-advantaged arrangements, such as 401(k) plans or individual retirement accounts (“IRAs”). | ||||||||||||||||||||||||||||||||||||||||||||||||||||||||||||||||||||||||||||||||||
| Performance Table Explanation after Tax Higher | After-tax returns may exceed the return before taxes due to an assumed tax benefit from realizing a capital loss on a sale of shares. | ||||||||||||||||||||||||||||||||||||||||||||||||||||||||||||||||||||||||||||||||||
| Performance [Table] |
The Fund’s fiscal year end is October 31. The Fund’s most recent quarterly return (since the end of the last fiscal year) through January 31, 2026 was 0.43%.
|
||||||||||||||||||||||||||||||||||||||||||||||||||||||||||||||||||||||||||||||||||
| Performance Table One Class of after Tax Shown [Text] | Average annual total returns are shown on a before- and after-tax basis for the Fund. | ||||||||||||||||||||||||||||||||||||||||||||||||||||||||||||||||||||||||||||||||||
| Performance Table Closing [Text Block] | Average annual total returns are shown on a before- and after-tax basis for the Fund. After-tax returns are calculated using the historical highest individual federal marginal income tax rates and do not reflect the impact of state and local taxes. Actual after-tax returns depend on an investor’s tax situation and may differ from those shown. After-tax returns shown are not relevant to investors who hold shares through tax-advantaged arrangements, such as 401(k) plans or individual retirement accounts (“IRAs”). After-tax returns may exceed the return before taxes due to an assumed tax benefit from realizing a capital loss on a sale of shares.
Also, shareholder reports containing financial and performance information will be mailed to shareholders semi-annually. Updated performance information will be available at no cost by visiting https://tcw.com or by calling (866) 364-1383. |
||||||||||||||||||||||||||||||||||||||||||||||||||||||||||||||||||||||||||||||||||
| Performance Availability Website Address [Text] | https://tcw.com | ||||||||||||||||||||||||||||||||||||||||||||||||||||||||||||||||||||||||||||||||||
| Performance Availability Phone [Text] | (866) 364-1383 | ||||||||||||||||||||||||||||||||||||||||||||||||||||||||||||||||||||||||||||||||||
| TCW Flexible Income ETF | |||||||||||||||||||||||||||||||||||||||||||||||||||||||||||||||||||||||||||||||||||
| Prospectus [Line Items] | |||||||||||||||||||||||||||||||||||||||||||||||||||||||||||||||||||||||||||||||||||
| Performance Narrative [Text Block] | Performance: The TCW MetWest Flexible Income Fund, a series of TCW Metropolitan West Funds (the “Predecessor Flexible Income Mutual Fund”) was reorganized into the Fund on June 24, 2024. As a result of the reorganization, the Fund assumed the financial and performance history of the Predecessor Flexible Income Mutual Fund. The Fund commenced operations June 24, 2024. The following bar chart and table provide some indication of the risks of investing in the Fund (and the Predecessor Flexible Income Mutual Fund for periods prior to the reorganization) by showing how the Fund’s performance has varied from year to year. The table shows how the Fund’s average annual returns for 1 year, 5 years and since inception compared with those of a broad-based securities market index. Had the Predecessor Flexible Income Mutual Fund been structured as an ETF, its performance may have differed. The Fund’s (and the Predecessor Flexible Income Mutual Fund’s) past performance (before and after taxes) is not necessarily an indication of how the Fund will perform in the future. Updated performance information will be available at no cost by visiting https://tcw.com or by calling (866) 364-1383. |
||||||||||||||||||||||||||||||||||||||||||||||||||||||||||||||||||||||||||||||||||
| Performance Past Does Not Indicate Future [Text] | The Fund’s (and the Predecessor Flexible Income Mutual Fund’s) past performance (before and after taxes) is not necessarily an indication of how the Fund will perform in the future | ||||||||||||||||||||||||||||||||||||||||||||||||||||||||||||||||||||||||||||||||||
| Performance One Year or Less [Text] | The TCW MetWest Flexible Income Fund, a series of TCW Metropolitan West Funds (the “Predecessor Flexible Income Mutual Fund”) was reorganized into the Fund on June 24, 2024. As a result of the reorganization, the Fund assumed the financial and performance history of the Predecessor Flexible Income Mutual Fund. The Fund commenced operations June 24, 2024. The following bar chart and table provide some indication of the risks of investing in the Fund (and the Predecessor Flexible Income Mutual Fund for periods prior to the reorganization) by showing how the Fund’s performance has varied from year to year. The table shows how the Fund’s average annual returns for 1 year, 5 years and since inception compared with those of a broad-based securities market index. | ||||||||||||||||||||||||||||||||||||||||||||||||||||||||||||||||||||||||||||||||||
| Bar Chart [Heading] | AVERAGE ANNUAL TOTAL RETURNS* (For the period ended December 31, 2025) | ||||||||||||||||||||||||||||||||||||||||||||||||||||||||||||||||||||||||||||||||||
| Bar Chart [Table] |
|
||||||||||||||||||||||||||||||||||||||||||||||||||||||||||||||||||||||||||||||||||
| Bar Chart Closing [Text Block] |
|
||||||||||||||||||||||||||||||||||||||||||||||||||||||||||||||||||||||||||||||||||
| Highest Quarterly Return, Label [Optional Text] | Best Quarter | ||||||||||||||||||||||||||||||||||||||||||||||||||||||||||||||||||||||||||||||||||
| Highest Quarterly Return | 8.75% | ||||||||||||||||||||||||||||||||||||||||||||||||||||||||||||||||||||||||||||||||||
| Highest Quarterly Return, Date | Mar. 31, 2019 | ||||||||||||||||||||||||||||||||||||||||||||||||||||||||||||||||||||||||||||||||||
| Lowest Quarterly Return, Label [Optional Text] | Worst Quarter | ||||||||||||||||||||||||||||||||||||||||||||||||||||||||||||||||||||||||||||||||||
| Lowest Quarterly Return | (4.80%) | ||||||||||||||||||||||||||||||||||||||||||||||||||||||||||||||||||||||||||||||||||
| Lowest Quarterly Return, Date | Jun. 30, 2022 | ||||||||||||||||||||||||||||||||||||||||||||||||||||||||||||||||||||||||||||||||||
| Performance Table Uses Highest Federal Rate | After-tax returns are calculated using the historical highest individual federal marginal income tax rates and do not reflect the impact of state and local taxes. | ||||||||||||||||||||||||||||||||||||||||||||||||||||||||||||||||||||||||||||||||||
| Performance Table Not Relevant to Tax Deferred | After-tax returns shown are not relevant to investors who hold shares through tax-advantaged arrangements, such as 401(k) plans or individual retirement accounts (“IRAs”). | ||||||||||||||||||||||||||||||||||||||||||||||||||||||||||||||||||||||||||||||||||
| Performance Table Explanation after Tax Higher | After-tax returns may exceed the return before taxes due to an assumed tax benefit from realizing a capital loss on a sale of shares. | ||||||||||||||||||||||||||||||||||||||||||||||||||||||||||||||||||||||||||||||||||
| Performance [Table] |
|
||||||||||||||||||||||||||||||||||||||||||||||||||||||||||||||||||||||||||||||||||
| Performance Table One Class of after Tax Shown [Text] | Average annual total returns are shown on a before- and after-tax basis for the Fund. | ||||||||||||||||||||||||||||||||||||||||||||||||||||||||||||||||||||||||||||||||||
| Index No Deduction for Fees, Expenses, or Taxes [Text] | reflects no deduction for fees, expenses, or taxes | ||||||||||||||||||||||||||||||||||||||||||||||||||||||||||||||||||||||||||||||||||
| Performance Table Closing [Text Block] | The Fund’s fiscal year end is October 31. The Fund’s most recent quarterly return (since the end of the last fiscal year) through January 31, 2026 was 1.40%.
Average annual total returns are shown on a before- and after-tax basis for the Fund. After-tax returns are calculated using the historical highest individual federal marginal income tax rates and do not reflect the impact of state and local taxes. Actual after-tax returns depend on an investor’s tax situation and may differ from those shown. After-tax returns shown are not relevant to investors who hold shares through tax-advantaged arrangements, such as 401(k) plans or individual retirement accounts (“IRAs”). After-tax returns may exceed the return before taxes due to an assumed tax benefit from realizing a capital loss on a sale of shares.
Also, shareholder reports containing financial and performance information will be mailed to shareholders semi-annually. Updated performance information will be available at no cost by visiting https://tcw.com or by calling (866) 364-1383. |
||||||||||||||||||||||||||||||||||||||||||||||||||||||||||||||||||||||||||||||||||
| Performance Availability Website Address [Text] | https://tcw.com | ||||||||||||||||||||||||||||||||||||||||||||||||||||||||||||||||||||||||||||||||||
| Performance Availability Phone [Text] | (866) 364-1383 | ||||||||||||||||||||||||||||||||||||||||||||||||||||||||||||||||||||||||||||||||||
| TCW High Yield Bond ETF | |||||||||||||||||||||||||||||||||||||||||||||||||||||||||||||||||||||||||||||||||||
| Prospectus [Line Items] | |||||||||||||||||||||||||||||||||||||||||||||||||||||||||||||||||||||||||||||||||||
| Performance Narrative [Text Block] | Performance: The Predecessor High Yield Mutual Fund was reorganized into the Fund on November 18, 2024. As a result of the reorganization, the Fund assumed the financial and performance history of the Predecessor High Yield Mutual Fund. The Fund commenced operations November 18, 2024. The following bar chart and table provide some indication of the risks of investing in the Fund (and the Predecessor High Yield Mutual Fund for the periods prior to the reorganization) by showing how the Fund’s performance has varied from year to year. The table shows how the Fund’s average annual returns for 1 year, 5 years and 10 years compared with the performance of a broad-based securities market index and additional indices. Effective November 18, 2024, the Bloomberg U.S. Universal Bond Index was included as the Fund’s broad-based securities market index in accordance with regulatory disclosure requirements. Had the Predecessor High Yield Mutual Fund been structured as an ETF, its performance may have differed. The Fund’s (and the Predecessor High Yield Mutual Fund’s) past performance (before and after taxes) is not necessarily an indication of how the Fund will perform in the future. Updated performance information will be available at no cost by visiting https://tcw.com or by calling (866) 364-1383. |
||||||||||||||||||||||||||||||||||||||||||||||||||||||||||||||||||||||||||||||||||
| Performance Past Does Not Indicate Future [Text] | The Fund’s (and the Predecessor High Yield Mutual Fund’s) past performance (before and after taxes) is not necessarily an indication of how the Fund will perform in the future. | ||||||||||||||||||||||||||||||||||||||||||||||||||||||||||||||||||||||||||||||||||
| Performance One Year or Less [Text] | The Predecessor High Yield Mutual Fund was reorganized into the Fund on November 18, 2024. As a result of the reorganization, the Fund assumed the financial and performance history of the Predecessor High Yield Mutual Fund. The Fund commenced operations November 18, 2024. The following bar chart and table provide some indication of the risks of investing in the Fund (and the Predecessor High Yield Mutual Fund for the periods prior to the reorganization) by showing how the Fund’s performance has varied from year to year. The table shows how the Fund’s average annual returns for 1 year, 5 years and 10 years compared with the performance of a broad-based securities market index and additional indices. | ||||||||||||||||||||||||||||||||||||||||||||||||||||||||||||||||||||||||||||||||||
| Bar Chart [Heading] | AVERAGE ANNUAL TOTAL RETURNS* (For the period ended December 31, 2025) | ||||||||||||||||||||||||||||||||||||||||||||||||||||||||||||||||||||||||||||||||||
| Bar Chart [Table] |
|
||||||||||||||||||||||||||||||||||||||||||||||||||||||||||||||||||||||||||||||||||
| Bar Chart Closing [Text Block] |
|
||||||||||||||||||||||||||||||||||||||||||||||||||||||||||||||||||||||||||||||||||
| Highest Quarterly Return, Label [Optional Text] | Best Quarter | ||||||||||||||||||||||||||||||||||||||||||||||||||||||||||||||||||||||||||||||||||
| Highest Quarterly Return | 8.85% | ||||||||||||||||||||||||||||||||||||||||||||||||||||||||||||||||||||||||||||||||||
| Highest Quarterly Return, Date | Jun. 30, 2020 | ||||||||||||||||||||||||||||||||||||||||||||||||||||||||||||||||||||||||||||||||||
| Lowest Quarterly Return, Label [Optional Text] | Worst Quarter | ||||||||||||||||||||||||||||||||||||||||||||||||||||||||||||||||||||||||||||||||||
| Lowest Quarterly Return | (8.15%) | ||||||||||||||||||||||||||||||||||||||||||||||||||||||||||||||||||||||||||||||||||
| Lowest Quarterly Return, Date | Jun. 30, 2022 | ||||||||||||||||||||||||||||||||||||||||||||||||||||||||||||||||||||||||||||||||||
| Performance Table Uses Highest Federal Rate | After-tax returns are calculated using the historical highest individual federal marginal income tax rates and do not reflect the impact of state and local taxes. | ||||||||||||||||||||||||||||||||||||||||||||||||||||||||||||||||||||||||||||||||||
| Performance Table Not Relevant to Tax Deferred | After-tax returns shown are not relevant to investors who hold shares through tax-advantaged arrangements, such as 401(k) plans or individual retirement accounts (“IRAs”). | ||||||||||||||||||||||||||||||||||||||||||||||||||||||||||||||||||||||||||||||||||
| Performance Table Explanation after Tax Higher | After-tax returns may exceed the return before taxes due to an assumed tax benefit from realizing a capital loss on a sale of shares. | ||||||||||||||||||||||||||||||||||||||||||||||||||||||||||||||||||||||||||||||||||
| Performance [Table] |
|
||||||||||||||||||||||||||||||||||||||||||||||||||||||||||||||||||||||||||||||||||
| Performance Table One Class of after Tax Shown [Text] | Average annual total returns are shown on a before- and after-tax basis for the Fund. | ||||||||||||||||||||||||||||||||||||||||||||||||||||||||||||||||||||||||||||||||||
| Index No Deduction for Fees, Expenses, or Taxes [Text] | reflects no deduction for fees, expenses, or taxes | ||||||||||||||||||||||||||||||||||||||||||||||||||||||||||||||||||||||||||||||||||
| Performance Table Closing [Text Block] | The Fund’s fiscal year end is October 31. The Fund’s most recent quarterly return (since the end of the last fiscal year) through January 31, 2026 was 1.31%.
Average annual total returns are shown on a before- and after-tax basis for the Fund. After-tax returns are calculated using the historical highest individual federal marginal income tax rates and do not reflect the impact of state and local taxes. Actual after-tax returns depend on an investor’s tax situation and may differ from those shown. After-tax returns shown are not relevant to investors who hold shares through tax-advantaged arrangements, such as 401(k) plans or individual retirement accounts (“IRAs”). After-tax returns may exceed the return before taxes due to an assumed tax benefit from realizing a capital loss on a sale of shares.
Also, shareholder reports containing financial and performance information will be mailed to shareholders semi-annually. Updated performance information will be available at no cost by visiting https://tcw.com or by calling (866) 364-1383. |
||||||||||||||||||||||||||||||||||||||||||||||||||||||||||||||||||||||||||||||||||
| Performance Availability Website Address [Text] | https://tcw.com | ||||||||||||||||||||||||||||||||||||||||||||||||||||||||||||||||||||||||||||||||||
| Performance Availability Phone [Text] | (866) 364-1383 | ||||||||||||||||||||||||||||||||||||||||||||||||||||||||||||||||||||||||||||||||||
| TCW Multisector Credit Income ETF | |||||||||||||||||||||||||||||||||||||||||||||||||||||||||||||||||||||||||||||||||||
| Prospectus [Line Items] | |||||||||||||||||||||||||||||||||||||||||||||||||||||||||||||||||||||||||||||||||||
| Performance Narrative [Text Block] | Performance: The accompanying bar chart and table provide some indication of the risks of investing in the Fund. The bar chart shows changes in the Fund’s year-to-year performance and the table shows how the Fund’s average annual total returns for the one-year and since inception periods compared to that of a broad measure of market performance. The Fund’s past performance (before and after taxes) is not necessarily an indication of how the Fund will perform in the future. |
||||||||||||||||||||||||||||||||||||||||||||||||||||||||||||||||||||||||||||||||||
| Performance Past Does Not Indicate Future [Text] | The Fund’s past performance (before and after taxes) is not necessarily an indication of how the Fund will perform in the future. | ||||||||||||||||||||||||||||||||||||||||||||||||||||||||||||||||||||||||||||||||||
| Performance One Year or Less [Text] | The accompanying bar chart and table provide some indication of the risks of investing in the Fund. The bar chart shows changes in the Fund’s year-to-year performance and the table shows how the Fund’s average annual total returns for the one-year and since inception periods compared to that of a broad measure of market performance. | ||||||||||||||||||||||||||||||||||||||||||||||||||||||||||||||||||||||||||||||||||
| Bar Chart [Heading] | AVERAGE ANNUAL TOTAL RETURNS* (For the period ended December 31, 2025) | ||||||||||||||||||||||||||||||||||||||||||||||||||||||||||||||||||||||||||||||||||
| Bar Chart [Table] |
|
||||||||||||||||||||||||||||||||||||||||||||||||||||||||||||||||||||||||||||||||||
| Bar Chart Closing [Text Block] |
|
||||||||||||||||||||||||||||||||||||||||||||||||||||||||||||||||||||||||||||||||||
| Highest Quarterly Return, Label [Optional Text] | Best Quarter | ||||||||||||||||||||||||||||||||||||||||||||||||||||||||||||||||||||||||||||||||||
| Highest Quarterly Return | 2.90% | ||||||||||||||||||||||||||||||||||||||||||||||||||||||||||||||||||||||||||||||||||
| Highest Quarterly Return, Date | Jun. 30, 2025 | ||||||||||||||||||||||||||||||||||||||||||||||||||||||||||||||||||||||||||||||||||
| Lowest Quarterly Return, Label [Optional Text] | Worst Quarter | ||||||||||||||||||||||||||||||||||||||||||||||||||||||||||||||||||||||||||||||||||
| Lowest Quarterly Return | 1.06% | ||||||||||||||||||||||||||||||||||||||||||||||||||||||||||||||||||||||||||||||||||
| Lowest Quarterly Return, Date | Mar. 31, 2025 | ||||||||||||||||||||||||||||||||||||||||||||||||||||||||||||||||||||||||||||||||||
| Performance Table Uses Highest Federal Rate | After-tax returns are calculated using the historical highest individual federal marginal income tax rates and do not reflect the impact of state and local taxes. | ||||||||||||||||||||||||||||||||||||||||||||||||||||||||||||||||||||||||||||||||||
| Performance Table Not Relevant to Tax Deferred | After-tax returns shown are not relevant to investors who hold shares through tax-advantaged arrangements, such as 401(k) plans or individual retirement accounts (“IRAs”). | ||||||||||||||||||||||||||||||||||||||||||||||||||||||||||||||||||||||||||||||||||
| Performance Table Explanation after Tax Higher | After-tax returns may exceed the return before taxes due to an assumed tax benefit from realizing a capital loss on a sale of shares. | ||||||||||||||||||||||||||||||||||||||||||||||||||||||||||||||||||||||||||||||||||
| Performance [Table] |
|
||||||||||||||||||||||||||||||||||||||||||||||||||||||||||||||||||||||||||||||||||
| Performance Table One Class of after Tax Shown [Text] | Average annual total returns are shown on a before- and after-tax basis for the Fund. | ||||||||||||||||||||||||||||||||||||||||||||||||||||||||||||||||||||||||||||||||||
| Performance Table Closing [Text Block] | The Fund’s fiscal year end is October 31. The Fund’s most recent quarterly return (since the end of the last fiscal year) through January 31, 2026 was 1.49%.
Average annual total returns are shown on a before- and after-tax basis for the Fund. After-tax returns are calculated using the historical highest individual federal marginal income tax rates and do not reflect the impact of state and local taxes. Actual after-tax returns depend on an investor’s tax situation and may differ from those shown. After-tax returns shown are not relevant to investors who hold shares through tax-advantaged arrangements, such as 401(k) plans or individual retirement accounts (“IRAs”). After-tax returns may exceed the return before taxes due to an assumed tax benefit from realizing a capital loss on a sale of shares.
Also, shareholder reports containing financial and performance information will be mailed to shareholders semi-annually. Updated performance information will be available at no cost by visiting https://tcw.com or by calling (866) 364-1383. |
||||||||||||||||||||||||||||||||||||||||||||||||||||||||||||||||||||||||||||||||||
| Performance Availability Website Address [Text] | https://tcw.com | ||||||||||||||||||||||||||||||||||||||||||||||||||||||||||||||||||||||||||||||||||
| Performance Availability Phone [Text] | (866) 364-1383 | ||||||||||||||||||||||||||||||||||||||||||||||||||||||||||||||||||||||||||||||||||
| TCW Senior Loan ETF | |||||||||||||||||||||||||||||||||||||||||||||||||||||||||||||||||||||||||||||||||||
| Prospectus [Line Items] | |||||||||||||||||||||||||||||||||||||||||||||||||||||||||||||||||||||||||||||||||||
| Performance Narrative [Text Block] | Performance: The TCW MetWest Floating Rate Income Fund (the “Predecessor Floating Rate Mutual Fund”) was reorganized into the Fund on November 18, 2024. As a result of the reorganization, the Fund assumed the financial and performance history of the Predecessor Floating Rate Mutual Fund. The Fund commenced operations November 18, 2024. The following bar chart and table provide some indication of the risks of investing in the Fund (and the Predecessor Floating Rate Mutual Fund for periods prior to the reorganization) by showing how the Fund’s performance has varied from year to year. The table shows how the Fund’s average annual returns for 1 year, 5 years and 10 years compared with the performance of a broad-based securities market index and an additional index. Had the Predecessor Floating Rate Mutual Fund been structured as an ETF, its performance may have differed. The Fund’s (and the Predecessor Floating Rate Mutual Fund’s) past performance (before and after taxes) is not necessarily an indication of how the Fund will perform in the future. Updated performance information will be available at no cost by visiting https://tcw.com or by calling (866) 364-1383. |
||||||||||||||||||||||||||||||||||||||||||||||||||||||||||||||||||||||||||||||||||
| Performance Past Does Not Indicate Future [Text] | The Fund’s (and the Predecessor Floating Rate Mutual Fund’s) past performance (before and after taxes) is not necessarily an indication of how the Fund will perform in the future. | ||||||||||||||||||||||||||||||||||||||||||||||||||||||||||||||||||||||||||||||||||
| Performance One Year or Less [Text] | The TCW MetWest Floating Rate Income Fund (the “Predecessor Floating Rate Mutual Fund”) was reorganized into the Fund on November 18, 2024. As a result of the reorganization, the Fund assumed the financial and performance history of the Predecessor Floating Rate Mutual Fund. The Fund commenced operations November 18, 2024. The following bar chart and table provide some indication of the risks of investing in the Fund (and the Predecessor Floating Rate Mutual Fund for periods prior to the reorganization) by showing how the Fund’s performance has varied from year to year. The table shows how the Fund’s average annual returns for 1 year, 5 years and 10 years compared with the performance of a broad-based securities market index and an additional index. | ||||||||||||||||||||||||||||||||||||||||||||||||||||||||||||||||||||||||||||||||||
| Bar Chart [Heading] | AVERAGE ANNUAL TOTAL RETURNS* (For the period ended December 31, 2025) | ||||||||||||||||||||||||||||||||||||||||||||||||||||||||||||||||||||||||||||||||||
| Bar Chart [Table] |
|
||||||||||||||||||||||||||||||||||||||||||||||||||||||||||||||||||||||||||||||||||
| Bar Chart Closing [Text Block] | *For the period shown in the bar chart above:
|
||||||||||||||||||||||||||||||||||||||||||||||||||||||||||||||||||||||||||||||||||
| Highest Quarterly Return, Label [Optional Text] | Best Quarter | ||||||||||||||||||||||||||||||||||||||||||||||||||||||||||||||||||||||||||||||||||
| Highest Quarterly Return | 7.04% | ||||||||||||||||||||||||||||||||||||||||||||||||||||||||||||||||||||||||||||||||||
| Highest Quarterly Return, Date | Jun. 30, 2020 | ||||||||||||||||||||||||||||||||||||||||||||||||||||||||||||||||||||||||||||||||||
| Lowest Quarterly Return, Label [Optional Text] | Worst Quarter | ||||||||||||||||||||||||||||||||||||||||||||||||||||||||||||||||||||||||||||||||||
| Lowest Quarterly Return | (8.76%) | ||||||||||||||||||||||||||||||||||||||||||||||||||||||||||||||||||||||||||||||||||
| Lowest Quarterly Return, Date | Mar. 31, 2020 | ||||||||||||||||||||||||||||||||||||||||||||||||||||||||||||||||||||||||||||||||||
| Performance Table Uses Highest Federal Rate | After-tax returns are calculated using the historical highest individual federal marginal income tax rates and do not reflect the impact of state and local taxes. | ||||||||||||||||||||||||||||||||||||||||||||||||||||||||||||||||||||||||||||||||||
| Performance Table Not Relevant to Tax Deferred | After-tax returns shown are not relevant to investors who hold shares through tax-advantaged arrangements, such as 401(k) plans or individual retirement accounts (“IRAs”). | ||||||||||||||||||||||||||||||||||||||||||||||||||||||||||||||||||||||||||||||||||
| Performance Table Explanation after Tax Higher | After-tax returns may exceed the return before taxes due to an assumed tax benefit from realizing a capital loss on a sale of shares. | ||||||||||||||||||||||||||||||||||||||||||||||||||||||||||||||||||||||||||||||||||
| Performance [Table] |
The Fund’s fiscal year end is October 31. The Fund’s most recent quarterly return (since the end of the last fiscal year) through January 31, 2026 was 0.67%.
|
||||||||||||||||||||||||||||||||||||||||||||||||||||||||||||||||||||||||||||||||||
| Performance Table One Class of after Tax Shown [Text] | Average annual total returns are shown on a before- and after-tax basis for the Fund. | ||||||||||||||||||||||||||||||||||||||||||||||||||||||||||||||||||||||||||||||||||
| Performance Table Closing [Text Block] | Average annual total returns are shown on a before- and after-tax basis for the Fund. After-tax returns are calculated using the historical highest individual federal marginal income tax rates and do not reflect the impact of state and local taxes. Actual after-tax returns depend on an investor’s tax situation and may differ from those shown. After-tax returns shown are not relevant to investors who hold shares through tax-advantaged arrangements, such as 401(k) plans or individual retirement accounts (“IRAs”). After-tax returns may exceed the return before taxes due to an assumed tax benefit from realizing a capital loss on a sale of shares.
Also, shareholder reports containing financial and performance information will be mailed to shareholders semi-annually. Updated performance information will be available at no cost by visiting https://tcw.com or by calling (866) 364-1383. |
||||||||||||||||||||||||||||||||||||||||||||||||||||||||||||||||||||||||||||||||||
| Performance Availability Website Address [Text] | https://tcw.com | ||||||||||||||||||||||||||||||||||||||||||||||||||||||||||||||||||||||||||||||||||
| Performance Availability Phone [Text] | (866) 364-1383 | ||||||||||||||||||||||||||||||||||||||||||||||||||||||||||||||||||||||||||||||||||