The bar chart and average annual total return table provide some indication of the risks of investing in the Series. The bar chart shows the variability in the performance of the Class S shares of the Series by showing changes in the performance of the Series for each of the last ten calendar years. The total return table shows how the average annual total returns for the Series for different periods compare to those of a broad-based securities index. The Series’ Class W Shares commenced operations on March 1, 2019 and all returns shown for Class W Shares include the returns of the Series’ Class S Shares for periods prior to its inception date. Past performance (both before and after taxes) does not necessarily indicate how the Series will perform in the future. Quarterly updated performance information of the Series is available at www.manning-napier.com.
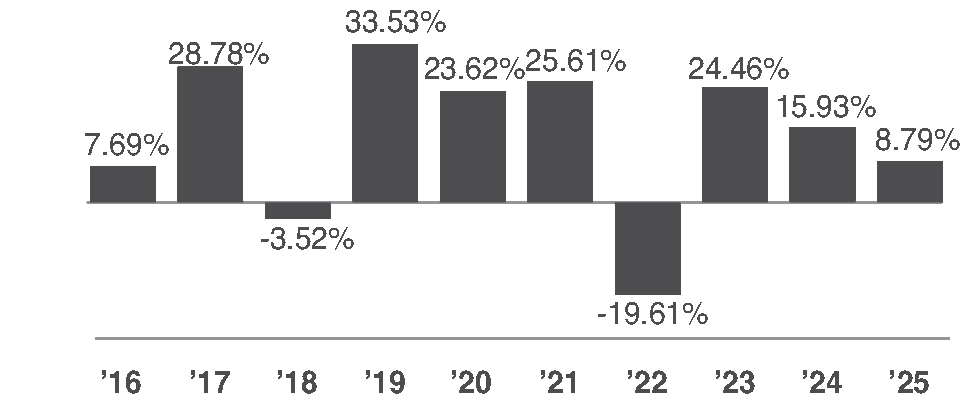
Quarterly Returns
Highest (quarter ended 06/30/2020): 22.84%
Lowest (quarter ended 03/31/2020): (16.89)%
|
AVERAGE ANNUAL TOTAL RETURNS |
|||
|
|
1 Year |
5 Years |
10 Years |
|
Class S Shares |
|
|
|
|
Return Before Taxes |
8.79% |
9.65% |
13.35% |
|
Return After Taxes |
6.13% |
6.93% |
10.56% |
|
Return After Taxes |
7.05% |
7.16% |
10.24% |
|
Class W Shares – |
9.94% |
10.76% |
14.13% |
|
Index: (reflect no deduction for fees, expenses, or taxes) |
|
|
|
|
MSCI USA IMI |
16.81% |
12.82% |
13.84% |
The after-tax returns are calculated using the historical highest individual federal marginal income tax rates and do not reflect the impact of state and local taxes. The after-tax figures are shown for one share class only, and would be different for the other share class. Actual after-tax returns depend on an investor’s tax situation and may differ from those shown. After-tax returns are not relevant to investors who hold their Series shares through tax-deferred arrangements, such as 401(k) plans or individual retirement accounts.
The bar chart and average annual total return table provide some indication of the risks of investing in the Series. The bar chart shows the variability in the performance of the Series by showing changes in the performance of the Class I shares of the Series for each of the last ten calendar years. The total return table shows how the average annual total returns for the Series for different periods compared to those of a broad-based securities index. The Series’ Class Z Shares, and Class S Shares commenced operations on May 1, 2018, and September 21, 2018, respectively, and all returns shown for each such class include the returns of the Series’ Class I Shares (adjusted to reflect the higher class-related expenses of the class, where applicable) for periods prior to its inception date. The Series’ performance in calendar year 2020 includes the impact of the Fund’s receipt of a one-time payment of litigation settlement proceeds relating to a prior portfolio investment. This one-time payment was received during the third quarter of 2020 and contributed approximately 3.6% to the Series’ performance in 2020. The impact of this contribution to the Series’ average annual total returns will vary by timeframe. Past performance (both before and after taxes) does not necessarily indicate how the Series will perform in the future. Quarterly performance information of the Series is available at www.manning-napier.com.
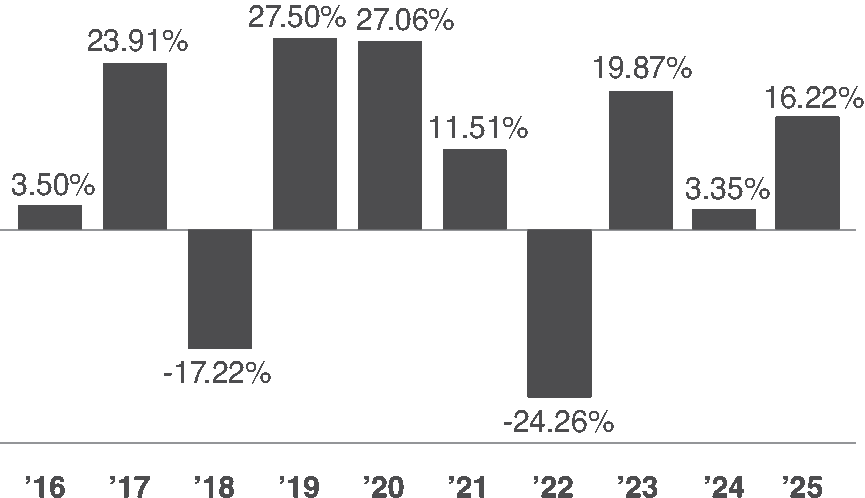
Quarterly Returns
Highest (quarter ended 06/30/2020): 22.64%
Lowest (quarter ended 03/31/2020): (20.81)%
|
AVERAGE ANNUAL TOTAL RETURNS |
|||
|
|
1 Year |
5 Years |
10 Years |
|
Class I Shares |
|
|
|
|
Return Before Taxes |
16.22% |
3.99% |
7.66% |
|
Return After Taxes on Distributions |
16.02% |
3.79% |
7.45% |
|
Return After Taxes on Distributions and Sale of Series Shares |
9.94% |
3.17% |
6.30% |
|
Class S Shares – |
15.88% |
3.68% |
7.34% |
|
Class Z Shares – |
16.35% |
4.09% |
7.74% |
|
Index: (reflects no deduction for fees, expenses, or taxes) |
|
|
|
|
MSCI ACWI ex USA |
32.39% |
7.91% |
8.41% |
The after-tax returns are calculated using the historical highest individual federal marginal income tax rates and do not reflect the impact of state and local taxes. The after-tax figures are shown for one share class only, and would be different for the other share classes. Actual after-tax returns depend on an investor’s tax situation and may differ from those shown. After-tax returns are not relevant to investors who hold their Series shares through tax-deferred arrangements, such as 401(k) plans or individual retirement accounts.
The bar chart and average annual total return table provide some indication of the risks of investing in the Series. The bar chart shows the variability in the performance of the Series by showing changes in the performance of the Class I shares of the Series for each of the last ten calendar years. The total return table shows how the average annual total returns for the Series for different periods compare to those of a broad-based securities index. The Series’ Class Z Shares and Class W Shares commenced operations on March 1, 2019, and all returns shown for each such class include the returns of the Series’ Class I Shares (adjusted to reflect the higher class-related expenses of the class, where applicable) for periods prior to its inception date. Past performance (both before and after taxes) does not necessarily indicate how the Series will perform in the future. Quarterly updated performance information of the Series is available at www.manning-napier.com.
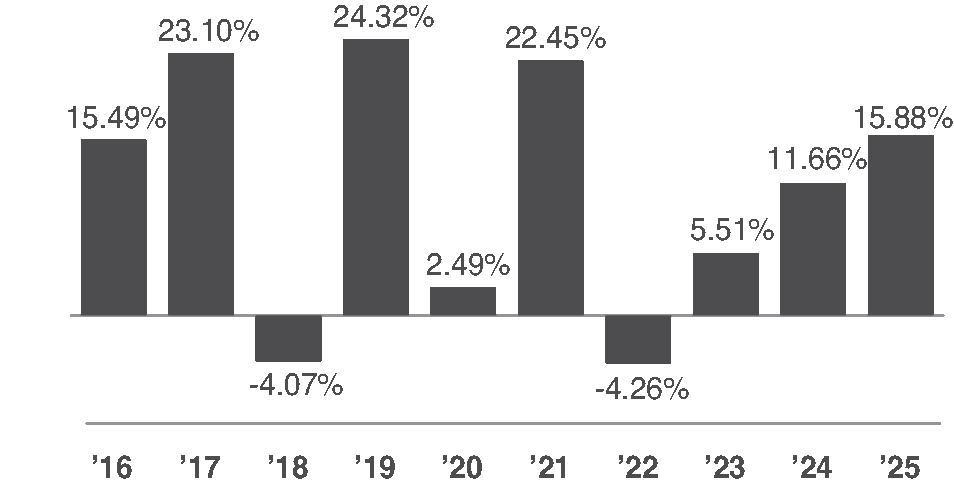
Quarterly Returns
Highest (quarter ended 12/31/2022): 15.22%
Lowest (quarter ended 03/31/2020): (25.06)%
|
AVERAGE ANNUAL TOTAL RETURNS |
|||
|
|
1 Year |
5 Years |
10 Years |
|
Class I Shares |
|
|
|
|
Return Before Taxes |
15.88% |
9.86% |
10.77% |
|
Return After Taxes on Distributions |
13.27% |
7.63% |
8.42% |
|
Return After Taxes on Distributions and Sale of Series Shares |
11.01% |
7.48% |
8.23% |
|
Class S Shares – Return Before Taxes |
15.71% |
9.66% |
10.54% |
|
Class W Shares – Return Before Taxes |
16.39% |
10.35% |
11.10% |
|
Class Z Shares – Return Before Taxes |
16.11% |
10.01% |
10.87% |
|
Indices: (reflect no deduction for fees, expenses, or taxes) |
|
|
|
|
MSCI USA Index |
17.31% |
13.38% |
14.22% |
|
MSCI USA Value Index |
12.97% |
10.31% |
9.53% |
The after-tax returns are calculated using the historical highest individual federal marginal income tax rates and do not reflect the impact of state and local taxes. The after-tax figures are shown for one share class only, and would be different for the other share classes. Actual after-tax returns depend on an investor’s tax situation and may differ from those shown. After-tax returns are not relevant to investors who hold their Series shares through tax-deferred arrangements, such as 401(k) plans or individual retirement accounts.
The bar chart and average annual total return table provide some indication of the risks of investing in the Series. The bar chart shows the variability in the performance of the Series by showing changes in the performance of the Class I Shares of the Series from year to year. The total return table shows how the average annual total returns for the Series for different periods compare to those of a broad-based securities index. The Series operated as the Rainier International Discovery Fund (the “Predecessor Fund”), a series of Rainier Investment Management Mutual Funds, prior to the Series’ acquisition of the assets and assumption of the liabilities of the Predecessor Fund on August 21, 2017 (the “Reorganization”). Performance figures for periods prior to the Reorganization reflect the performance of Institutional Shares and Class A Shares of the Predecessor Fund, which were reorganized into Class I Shares and Class S Shares, respectively. The performance figures do not reflect the sales charges that Predecessor Fund shareholders were charged on certain purchases of Class A Shares, and have not been adjusted to reflect the Series’ expenses. If the sales charges were reflected, Class S Shares returns would be lower than those shown. If the Predecessor Fund’s performance information had been adjusted to reflect the Series’ expenses, the performance may have been higher or lower for a given period depending on the expenses incurred by the Predecessor Fund for that period. The Series’ Class Z shares commenced operations on August 21, 2017, and all performance below for periods prior to that date reflects the performance of the Predecessor Fund’s Institutional Class Shares. The Series’ Class W Shares commenced
operations on March 1, 2019 and all returns shown for Class W Shares include the returns of the Series’ Class I Shares for periods prior to its inception date. Past performance (both before and after taxes) does not necessarily indicate how the Series will perform in the future. Quarterly updated performance information of the Series is available at www.manning-napier.com.
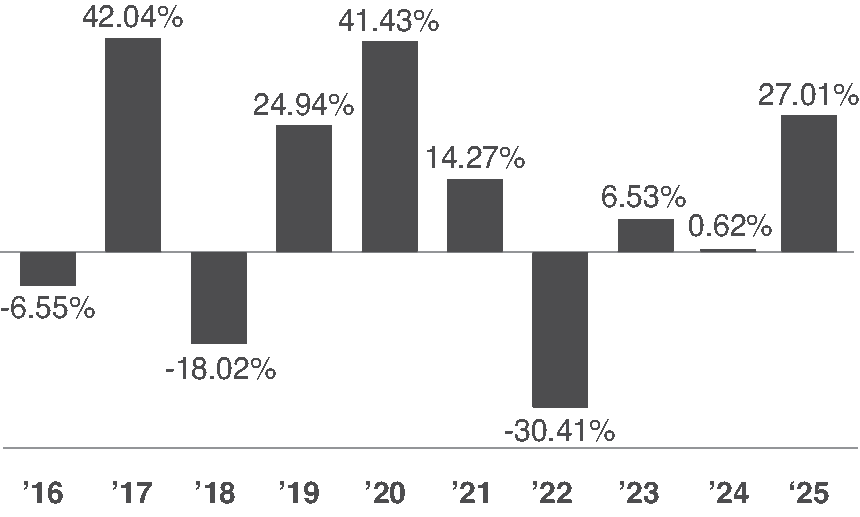
Quarterly Returns
Highest (quarter ended 06/30/2020): 28.98%
Lowest (quarter ended 03/31/2020): (19.83)%
|
AVERAGE ANNUAL TOTAL RETURNS |
|||
|
|
1 Year |
5 Years |
10 Years |
|
Class I Shares |
|
|
|
|
Return Before Taxes |
27.01% |
1.60% |
7.61% |
|
Return After Taxes on |
26.35% |
1.19% |
7.37% |
|
Return After Taxes on |
16.75% |
1.52% |
6.40% |
|
Class S Shares — |
26.73% |
1.34% |
7.33% |
|
Class W Shares — |
28.37% |
2.67% |
8.38% |
|
Class Z Shares — |
27.23% |
1.75% |
7.74% |
|
Indices: (reflect no deduction for fees, expenses or taxes) |
|
|
|
|
MSCI ACWI ex USA Index |
32.39% |
7.91% |
8.41% |
|
MSCI ACWI ex USA Small Cap Index |
29.26% |
6.91% |
8.13% |
The after-tax returns are calculated using the historical highest individual federal marginal income tax rates and do not reflect the impact of state and local taxes. The after-tax figures are shown for one share class only, and would be different for the other share classes. Actual after-tax returns depend on an investor’s tax situation and may differ from those shown. After-tax returns are not relevant to investors who hold their Series shares through tax-deferred arrangements, such as 401(k) plans or individual retirement accounts.
The bar chart and average annual total return table provide some indication of the risks of investing in the Series. The bar chart shows the variability in the performance of the Series by showing changes in the performance of the Class S shares of the Series for each of the last ten calendar years. The total return table shows how the average annual total returns for the Series for different periods compare to those of a broad-based securities index and a blended index. The Conservative Term Composite Benchmark 1 is a blend of 15% MSCI USA Investable Market Index, 5% MSCI ACWI ex USA Index, and 80% Bloomberg U.S. Intermediate Aggregate Bond Index. The Conservative Term Composite Benchmark 2 is a blend of 15% MSCI USA Investable Market Index, 5% MSCI ACWI ex USA Index, and 80% Bloomberg U.S. Aggregate Bond Index. The Conservative Term Composite Benchmarks are provided because they better reflect the asset allocation of the Series as compared with the broad-based index. Because the Series’ asset allocation will vary over time, the composition of the Series’ portfolio may not match the composition of the comparative indices’ portfolios. Past performance (both before and after taxes) does not necessarily indicate how the Series will perform in the future. Quarterly updated performance information of the Series is available at www.manning-napier.com.
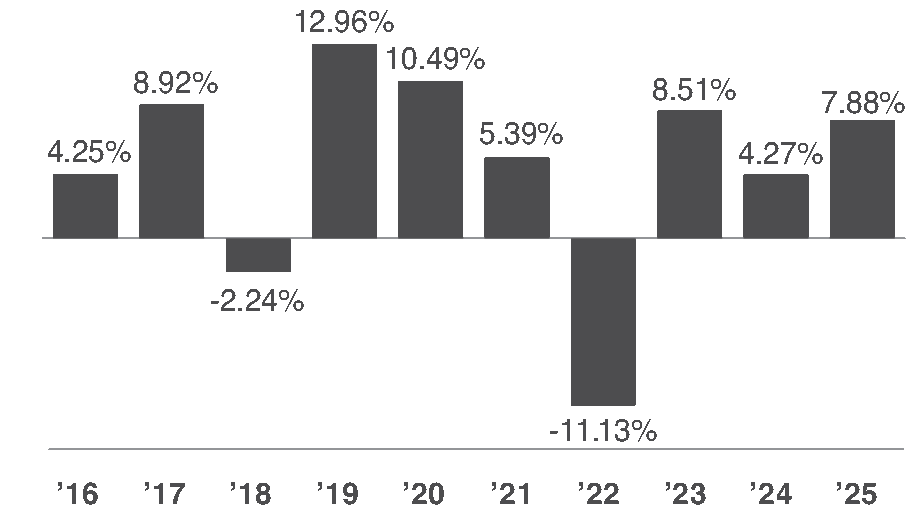
Quarterly Returns
Highest (quarter ended 06/30/2020): 8.35%
Lowest (quarter ended 03/31/2020): (5.23)%
|
AVERAGE ANNUAL TOTAL RETURNS |
|||
|
|
1 Year |
5 Years |
10 Years |
|
Class S Shares |
|
|
|
|
Return Before Taxes |
7.88% |
2.71% |
4.71% |
Return After Taxes on Distributions |
6.58% |
1.46% |
3.30% |
Return After Taxes on Distributions and Sale of Series Shares |
4.71% |
1.63% |
3.20% |
Class I Shares – Return Before Taxes |
8.16% |
2.94% |
4.95% |
Class R Shares – Return Before Taxes |
7.65% |
2.49% |
4.46% |
Class L Shares – Return Before Taxes |
7.07% |
1.96% |
3.93% |
Indices: (reflect no deduction for fees, expenses, or taxes) |
|||
Bloomberg U.S. Aggregate Bond Index |
7.30% |
(0.36)% |
2.01% |
Conservative
Term Composite |
10.06% |
3.32% |
4.95% |
Conservative
Term Composite |
9.93% |
2.45% |
4.85% |
| 1 | Returns provided are calculated monthly using a blended allocation, as noted above. |
No performance is shown for the Class Z Shares because they were not active prior to the date of this prospectus. Except for differences in returns resulting from differences in expenses, the classes would have substantially similar returns because each class invests in the same portfolio of securities.
The after-tax returns are calculated using the historical highest individual federal marginal income tax rates and do not reflect the impact of state and local taxes. The after-tax figures are shown for one share class only, and would be different for the other share classes. Actual after-tax returns depend on an investor’s tax situation and may differ from those shown. After-tax returns are not relevant to investors who hold their Series shares through tax-deferred arrangements, such as 401(k) plans or individual retirement accounts.
The bar chart and average annual total return table provide some indication of the risks of investing in the Series. The bar chart shows the variability in the performance of the Series by showing changes in the performance of the Class S shares of the Series for each of the last ten calendar years. The total return table shows how the average annual total returns for the Series for different periods compare to those of a broad-based securities index and a blended index. The 30/10/30/30 Blended Index is a blend of 30% MSCI USA Investable Market Index, 10% MSCI ACWI ex USA Index, 30% Bloomberg U.S. Aggregate Bond Index, and 30% Bloomberg U.S. Intermediate Aggregate Bond Index. The 30/10/60 Blended Index is a blend of 30% MSCI USA Investable Market Index, 10% MSCI ACWI ex USA Index, 60% Bloomberg U.S. Aggregate Bond Index. The Blended Indices are provided because they better reflect the asset allocation of the Series as compared with the broad-based index. Because the Series’ asset allocation will vary over time, the composition of the Series’ portfolio may not match the composition of the comparative indices’ portfolios. Past performance (both before and after taxes) does not necessarily indicate how the Series will perform in the future. Quarterly updated performance information of the Series is available at www.manning-napier.com.
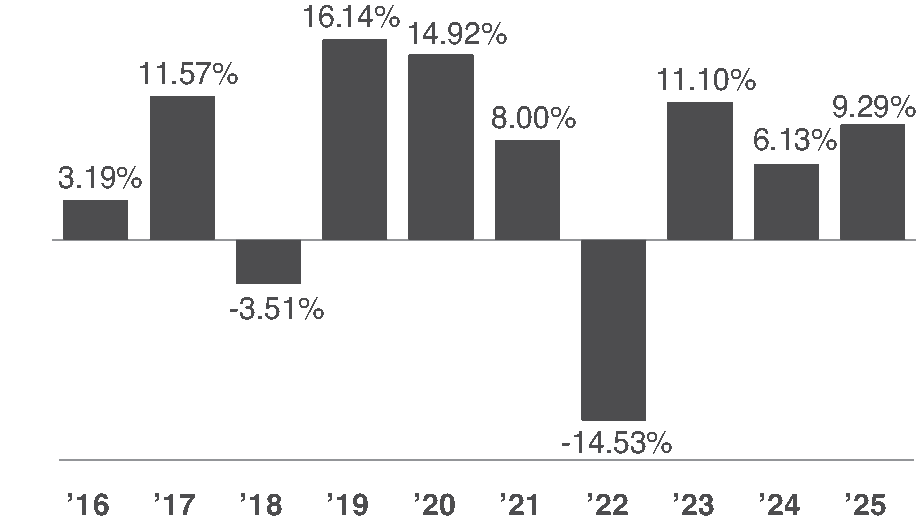
Quarterly Returns
Highest (quarter ended 06/30/2020): 10.81%
Lowest (quarter ended 06/30/2022): (7.69)%
|
AVERAGE ANNUAL TOTAL RETURNS |
|||
|
|
1 Year |
5 Years |
10 Years |
|
Class S Shares |
|
|
|
|
Return Before Taxes |
9.29% |
3.53% |
5.84% |
|
Return After Taxes on Distributions |
7.59% |
2.27% |
4.48% |
|
Return After Taxes on Distributions and Sale of Series Shares |
6.24% |
2.37% |
4.23% |
|
Class I Shares – |
9.55% |
3.76% |
6.08% |
|
Class R Shares – |
9.05% |
3.31% |
5.59% |
|
Class L Shares – |
8.48% |
2.79% |
5.07% |
|
Indices: (reflect no deduction for fees, expenses, or taxes) |
|||
|
Bloomberg U.S. |
7.30% |
(0.36)% |
2.01% |
|
30/10/30/30 Blended Index1 |
12.63% |
4.79% |
6.36% |
|
30/10/60 Blended Index1 |
12.58% |
4.45% |
6.34% |
| 1 | Returns provided are calculated monthly using a blended allocation, as noted above. |
No performance is shown for the Class Z Shares because they were not active prior to the date of this prospectus. Except for differences in returns resulting from differences in expenses, the classes would have substantially similar returns because each class invests in the same portfolio of securities.
The after-tax returns are calculated using the historical highest individual federal marginal income tax rates and do not reflect the impact of state and local taxes. The after-tax returns are shown for one share class only, and would be different for the other share classes. Actual after-tax returns depend on an investor’s tax situation and may differ from those shown. After-tax returns are not relevant to investors who hold their Series shares through tax-deferred arrangements, such as 401(k) plans or individual retirement accounts.
The bar chart and average annual total return table provide some indication of the risks of investing in the Series. The bar chart shows the variability in the performance of the Series by showing changes in the performance of the Class S shares of the Series for each of the last ten calendar years. The total return table shows how the average annual total returns for the Series for different periods compare to those of a broad-based securities index and a blended index. The 40/15/45 Blended Index is a blend of 40% MSCI USA Investable Market Index, 15% MSCI ACWI ex USA Index, and 45% Bloomberg U.S. Aggregate Bond Index. The 40/15/45 Blended Index is provided because it better reflects the asset allocation of the Series as compared with the broad-based index. Because the Series’ asset allocation will vary over time, the composition of the Series’ portfolio may not match the composition of the comparative indices’ portfolios. Past performance (both before and after taxes) does not necessarily indicate how the Series will perform in the future. Quarterly updated performance information of the Series is available at www.manning-napier.com.
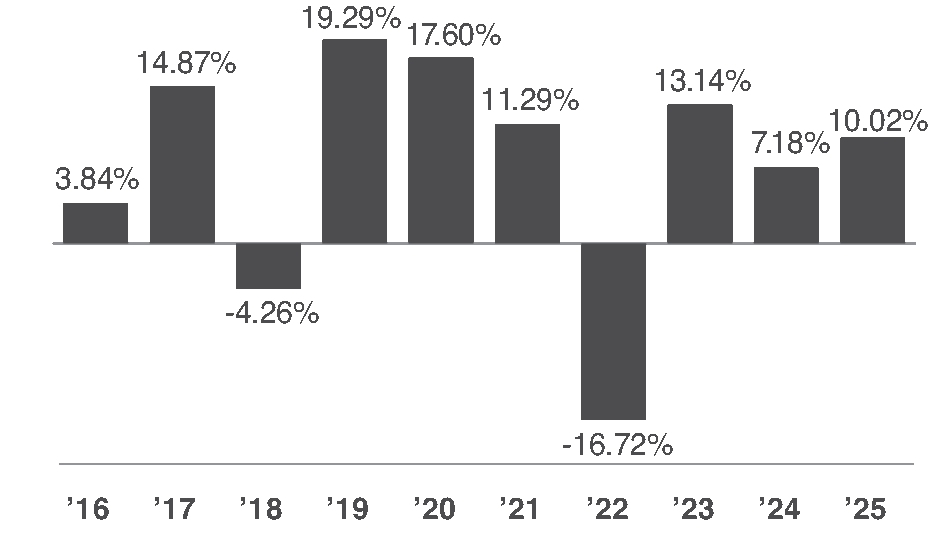
Quarterly Returns
Highest (quarter ended 06/30/2020): 12.83%
Lowest (quarter ended 06/30/2022): (9.46)%
|
AVERAGE ANNUAL TOTAL RETURNS |
|||
|
|
1 Year |
5 Years |
10 Years |
|
Class S Shares |
|
|
|
|
Return Before Taxes |
10.02% |
4.34% |
7.07% |
|
Return After Taxes on Distributions |
7.41% |
2.94% |
5.65% |
|
Return After Taxes on Distributions and Sale of Series Shares |
7.47% |
3.07% |
5.29% |
|
Class I Shares – |
10.31% |
4.58% |
7.32% |
|
Class R Shares – |
9.70% |
4.07% |
6.80% |
|
Class L Shares – |
9.15% |
3.54% |
6.26% |
|
Indices: (reflect no deduction for fees, expenses, or taxes) |
|||
|
MSCI USA IMI Index |
16.81% |
12.82% |
13.84% |
|
40/15/45 Blended Index1 |
14.76% |
6.20% |
7.86% |
| 1 | The returns of the indices do not reflect any fees or expenses. Returns provided are calculated monthly using a blended allocation, as noted above. |
No performance is shown for the Class Z Shares because they were not active prior to the date of this prospectus. Except for differences in returns resulting from differences in expenses, the classes would have substantially similar returns because each class invests in the same portfolio of securities.
The after-tax returns are calculated using the historical highest individual federal marginal income tax rates and do not reflect the impact of state and local taxes. The after-tax returns are shown for one share class only, and would be different for the other share classes. Actual after-tax returns depend on an investor’s tax situation and may differ from those shown. After-tax returns are not relevant to investors who hold their Series shares through tax-deferred arrangements, such as 401(k) plans or individual retirement accounts.
The bar chart and average annual total return table provide some indication of the risks of investing in the Series. The bar chart shows the variability in the performance of the Series by showing changes in the performance of the Class S shares of the Series for each of the last ten calendar years. The total return table shows how the average annual total returns for the Series for different periods compare to those of a broad-based securities index and a blended index. The 65/20/15 Blended Index is a blend of 65% MSCI USA Investable Market Index, 20% MSCI ACWI ex USA Index, and 15% Bloomberg U.S. Aggregate Bond Index. The 65/20/15 Blended Index is provided because it better reflects the asset allocation of the Series as compared with the broad-based index. Because the Series’ asset allocation will vary over time, the composition of the Series’ portfolio may not match the composition of the comparative indices’ portfolios. Past performance (both before and after taxes) does not necessarily indicate how the Series will perform in the future. Quarterly updated performance information of the Series is available at www.manning-napier.com.
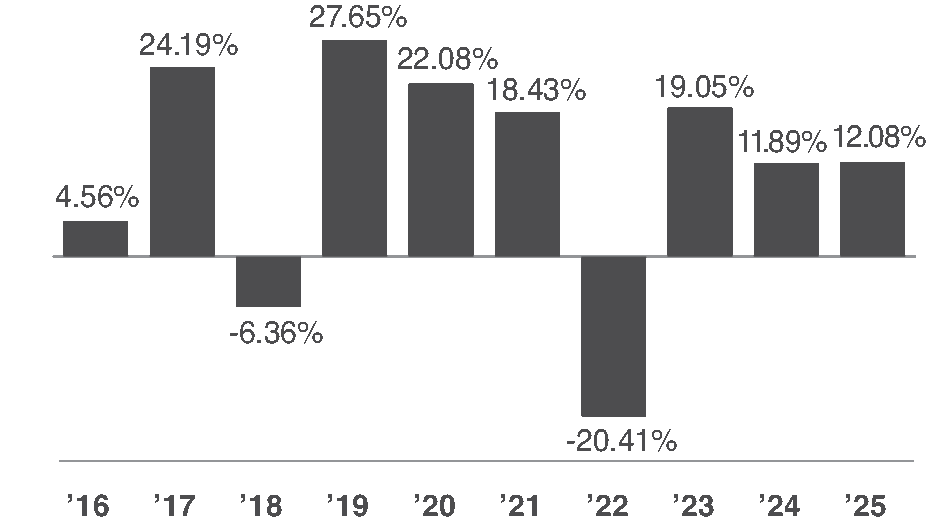
Quarterly Returns
Highest (quarter ended 06/30/2020): 20.63%
Lowest (quarter ended 03/31/2020): (15.86)%
|
AVERAGE ANNUAL TOTAL RETURNS |
|||
|
|
1 Year |
5 Years |
10 Years |
|
Class S Shares |
|
|
|
|
Return Before Taxes |
12.08% |
7.07% |
10.30% |
|
Return After Taxes on Distributions |
9.48% |
5.30% |
8.64% |
|
Return After Taxes on Distributions and Sale of Series Shares |
8.95% |
5.26% |
8.03% |
|
Class I Shares – |
12.36% |
7.35% |
10.58% |
|
Class R Shares – |
11.83% |
6.84% |
10.05% |
|
Class L Shares – |
11.26% |
6.28% |
9.49% |
|
Indices: (reflect no deduction for fees, expenses, or taxes) |
|||
|
MSCI USA IMI Index |
16.81% |
12.82% |
13.84% |
|
65/20/15 Blended Index1 |
18.41% |
9.92% |
11.09% |
| 1 | Returns provided are calculated monthly using a blended allocation, as noted above. |
No performance is shown for the Class Z Shares because they were not active prior to the date of this prospectus. Except for differences in returns resulting from differences in expenses, the classes would have substantially similar returns because each class invests in the same portfolio of securities.
The after-tax returns are calculated using the historical highest individual federal marginal income tax rates and do not reflect the impact of state and local taxes. The after-tax figures are shown for one share class only, and would be different for the other share classes. Actual after-tax returns depend on an investor’s tax situation and may differ from those shown. After- tax returns are not relevant to investors who hold their Series shares through tax-deferred arrangements, such as 401(k) plans or individual retirement accounts.
The bar chart and average annual total return table provide some indication of the risks of investing in the Series. The bar chart shows the variability in the performance of the Series by showing changes in the performance of the Class W shares of the Series from year to year. The total return table shows how the average annual total returns for the Series for different periods compare to those of a broad-based securities index and a blended index. The Series’ Class W Shares commenced operation on April 1, 2019, and all returns shown prior to that date include the returns of the Series’ Class S Shares (adjusted to reflect the higher class-related expenses of the class, where applicable). Except for differences in returns resulting from differences in expenses, the classes would have substantially similar returns because each class invests in the same portfolio of securities. The Conservative Term Composite Benchmark 1 is a blend of 15% MSCI USA Investable Market Index, 5% MSCI ACWI ex USA Index, and 80% Bloomberg U.S. Intermediate Aggregate Bond Index. The Conservative Term Composite Benchmark 2 is a blend of 15% MSCI USA Investable Market Index, 5% MSCI ACWI ex USA Index, and 80% Bloomberg U.S. Aggregate Bond Index. The Conservative Term Composite Benchmarks are provided because they better reflect the asset allocation of the Series as compared with the broad-based index. Because the Series’ asset allocation will vary over time, the composition of the Series’ portfolio may not match the composition of the comparative indices’ portfolios. Past performance (both before and after taxes) does not necessarily indicate how the Series will perform in the future. Quarterly updated performance information of the Series is available at www.manning-napier.com.
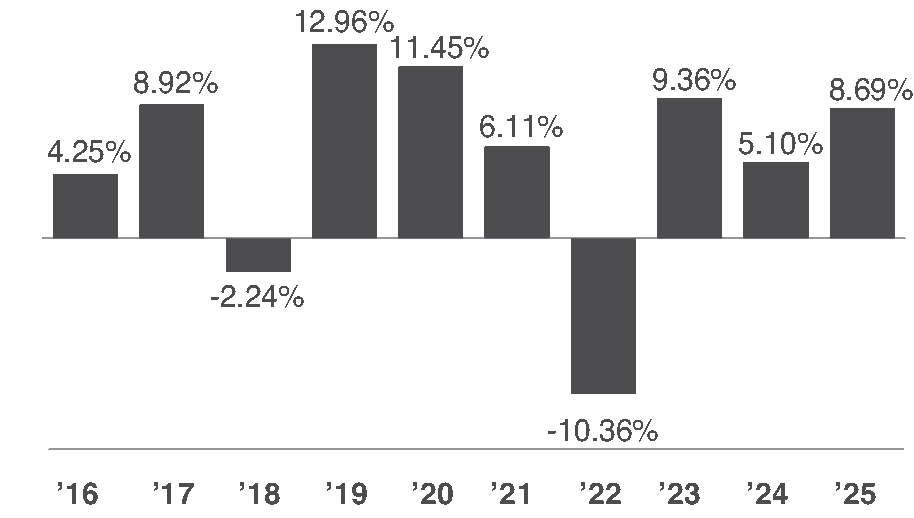
Quarterly Returns
Highest (quarter ended 06/30/2020): 8.55%
Lowest (quarter ended 03/31/2020): (5.02)%
|
AVERAGE ANNUAL TOTAL RETURNS |
|||
|
|
1 Year |
5 Years |
10 Years |
|
Class W Shares |
|
|
|
|
Return Before Taxes |
8.69% |
3.51% |
5.27% |
|
Return After Taxes on Distributions |
7.08% |
1.95% |
3.64% |
|
Return After Taxes on Distributions and Sale of Series Shares |
5.20% |
2.11% |
3.55% |
|
Indices: (reflect no deduction for fees, expenses, or taxes) |
|||
|
Bloomberg U.S. Aggregate |
7.30% |
(0.36)% |
2.01% |
|
Conservative Term |
10.06% |
3.32% |
4.95% |
|
Conservative
Term |
9.93% |
2.45% |
4.85% |
| 1 | Returns provided are calculated monthly using a blended allocation, as noted above. |
The after-tax returns are calculated using the historical highest individual federal marginal income tax rates and do not reflect the impact of state and local taxes. The after-tax figures are shown for one share class only, and would be different for the other share classes. Actual after-tax returns depend on an investor’s tax situation and may differ from those shown. After-tax returns are not relevant to investors who hold their Series shares through tax-deferred arrangements, such as 401(k) plans or individual retirement accounts.
The bar chart and average annual total return table provide some indication of the risks of investing in the Series. The bar chart shows the variability in the performance of the Series by showing changes in the performance of the Class W shares of the Series from year to year. The total return table shows how the average annual total returns for the Series for different periods compare to those of a broad-based securities index and a blended index. The Series’ Class W Shares commenced operation on April 1, 2019, and all returns shown prior to that date include the returns of the Series’ Class S Shares (adjusted to reflect the higher class-related expenses of the class, where applicable). Except for differences in returns resulting from differences in expenses, the classes would have substantially similar returns because each class invests in the same portfolio of securities. The 30/10/30/30 Blended Index is a blend of 30% MSCI USA Investable Market Index, 10% MSCI ACWI ex USA Index, 30% Bloomberg U.S. Aggregate Bond Index, and 30% Bloomberg U.S. Intermediate Aggregate Bond Index. The 30/10/60 Blended Index is a blend of 30% MSCI USA Investable Market Index, 10% MSCI ACWI ex USA Index, 60% Bloomberg U.S. Aggregate Bond Index. The Blended Indices are provided because they better reflect the asset allocation of the Series as compared with the broad-based index. Because the Series’ asset allocation will vary over time, the composition of the Series’ portfolio may not match the composition of the comparative indices’ portfolios. Past performance (both before and after taxes) does not necessarily indicate how the Series will perform in the future. Quarterly updated performance information of the Series is available at www.manning-napier.com.
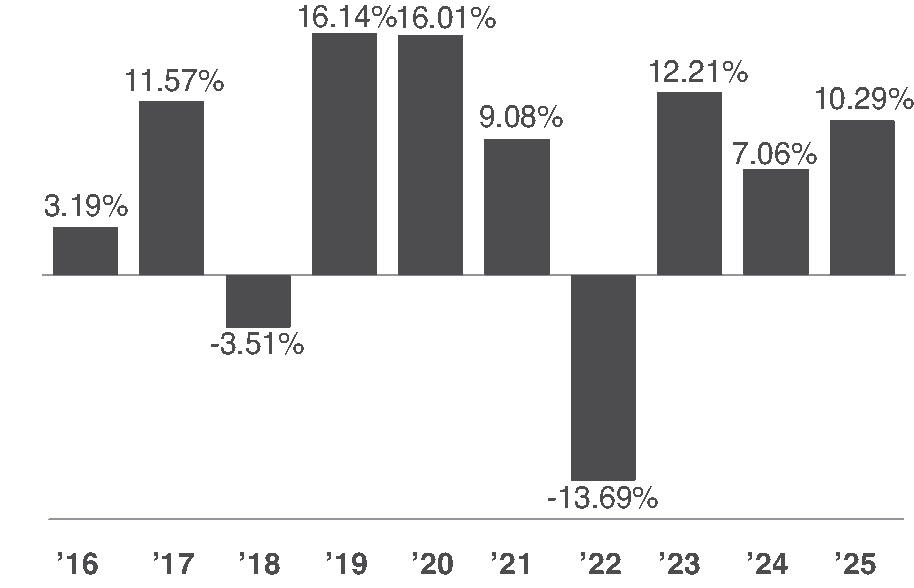
Quarterly Returns
Highest
(quarter ended 06/30/2020): 11.14%
Lowest (quarter ended 06/30/2022): (7.50)%
|
AVERAGE ANNUAL TOTAL RETURNS |
|||
|
|
1 Year |
5 Years |
10 Years |
|
Class W Shares |
|
|
|
|
Return Before Taxes |
10.29% |
4.52% |
6.51% |
|
Return After Taxes on Distributions |
8.48% |
2.97% |
4.95% |
|
Return After Taxes on Distributions and Sale of Series Shares |
6.84% |
3.02% |
4.68% |
|
Indices: (reflect no deduction for fees, expenses, or taxes) |
|||
|
Bloomberg U.S. Aggregate |
7.30% |
(0.36)% |
2.01% |
|
30/10/30/30 Blended Index1 |
12.63% |
4.79% |
6.36% |
|
30/10/60 Blended Index1 |
12.58% |
4.45% |
6.34% |
| 1 | Returns provided are calculated monthly using a blended allocation, as noted above. |
The after-tax returns are calculated using the historical highest individual federal marginal income tax rates and do not reflect the impact of state and local taxes. The after-tax returns are shown for one share class only, and would be different for the other share classes. Actual after-tax returns depend on an investor’s tax situation and may differ from those shown. After-tax returns are not relevant to investors who hold their Series shares through tax-deferred arrangements, such as 401(k) plans or individual retirement accounts.
The bar chart and average annual total return table provide some indication of the risks of investing in the Series. The bar chart shows the variability in the performance of the Series by showing changes in the performance of the Class W shares of the Series from year to year. The total return table shows how the average annual total returns for the Series for different periods compare to those of a broad-based securities index and a blended index. The Series’ Class W Shares commenced operation on April 1,
2019, and all returns shown prior to that date include the returns of the Series’ Class S Shares (adjusted to reflect the higher class-related expenses of the class, where applicable). Except for differences in returns resulting from differences in expenses, the classes would have substantially similar returns because each class invests in the same portfolio of securities. The 40/15/45 Blended Index is a blend of 40% MSCI USA Investable Market Index, 15% MSCI ACWI ex USA Index, and 45% Bloomberg U.S. Aggregate Bond Index. The 40/15/45 Blended Index is provided because it better reflects the asset allocation of the Series as compared with the broad-based index. Because the Series’ asset allocation will vary over time, the composition of the Series’ portfolio may not match the composition of the comparative indices’ portfolios. Past performance (both before and after taxes) does not necessarily indicate how the Series will perform in the future. Quarterly updated performance information of the Series is available at www.manning-napier.com.
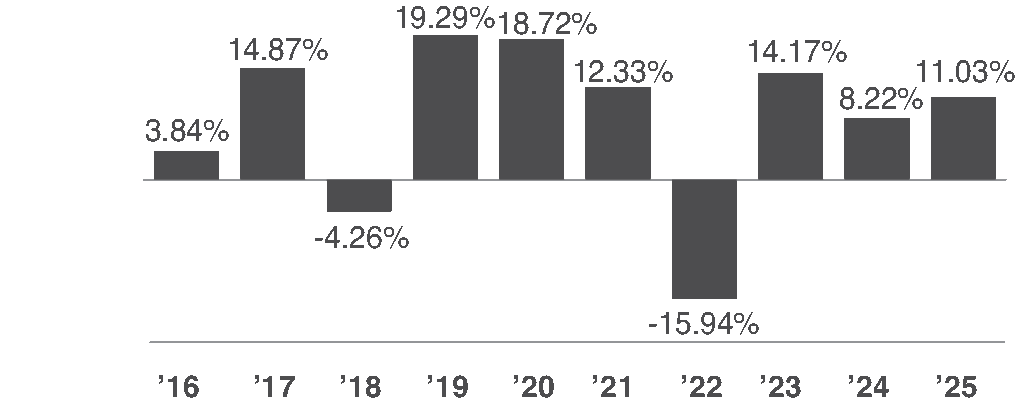
Quarterly Returns
Highest
(quarter ended 06/30/2020): 13.11%
Lowest (quarter ended 06/30/2022): (9.23)%
|
AVERAGE ANNUAL TOTAL RETURNS |
|||
|
|
1 Year |
5 Years |
10 Years |
|
Class W Shares |
|
|
|
|
Return Before Taxes |
11.03% |
5.31% |
7.75% |
|
Return After Taxes on Distributions |
8.11% |
3.63% |
6.12% |
|
Return After Taxes on Distributions and Sale of Series Shares |
8.12% |
3.72% |
5.75% |
|
Indices: (reflect no deduction for fees, expenses, or taxes) |
|||
|
MSCI USA IMI Index |
16.81% |
12.82% |
13.84% |
|
40/15/45 Blended Index1 |
14.76% |
6.20% |
7.86% |
| 1 | The returns of the indices do not reflect any fees or expenses. Returns provided are calculated monthly using a blended allocation, as noted above. |
The after-tax returns are calculated using the historical highest individual federal marginal income tax rates and do not reflect the impact of state and local taxes. The after-tax returns are shown for one share class only, and would be different for the other share classes. Actual after-tax returns depend on an investor’s tax situation and may differ from those shown. After-tax returns are not relevant to investors who hold their Series shares through tax-deferred arrangements, such as 401(k) plans or individual retirement accounts.
The bar chart and average annual total return table provide some indication of the risks of investing in the Series. The bar chart shows the variability in the performance of the Series by showing changes in the performance of the Class W shares of the Series from year to year. The total return table shows how the average annual total returns for the Series for different periods compare to those of a broad-based securities index and a blended index. The Series’ Class W Shares commenced operation on April 1, 2019, and all returns shown prior to that date include the returns of the Series’ Class S Shares (adjusted to reflect the higher
class-related expenses of the class, where applicable). Except for differences in returns resulting from differences in expenses, the classes would have substantially similar returns because each class invests in the same portfolio of securities. The 65/20/15 Blended Index is a blend of 65% MSCI USA Investable Market Index, 20% MSCI ACWI ex USA Index, and 15% Bloomberg U.S. Aggregate Bond Index. The 65/20/15 Blended Index is provided because it better reflects the asset allocation of the Series as compared with the broad-based index. Because the Series’ asset allocation will vary over time, the composition of the Series’ portfolio may not match the composition of the comparative indices’ portfolios. Past performance (both before and after taxes) does not necessarily indicate how the Series will perform in the future. Quarterly updated performance information of the Series is available at www.manning-napier.com.
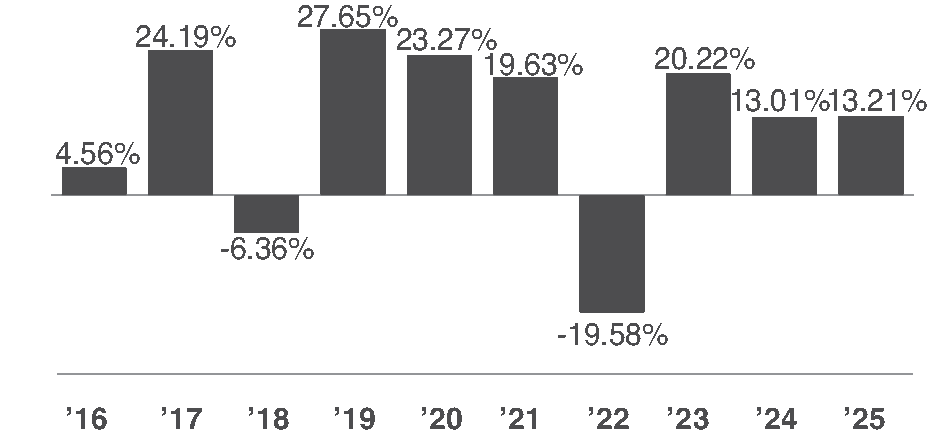
Quarterly Returns
Highest
(quarter ended 06/30/2020): 20.96%
Lowest (quarter ended 03/31/2020): (15.69)%
|
AVERAGE ANNUAL TOTAL RETURNS |
|||
|
|
1 Year |
5 Years |
10 Years |
|
Class W Shares |
|
|
|
|
Return Before Taxes |
13.21% |
8.15% |
11.05% |
|
Return After Taxes on Distributions |
10.39% |
6.15% |
9.22% |
|
Return After Taxes on Distributions and Sale of Series Shares |
9.77% |
6.06% |
8.61% |
|
Indices: (reflect no deduction for fees, expenses, or taxes) |
|||
|
MSCI USA IMI Index |
16.81% |
12.82% |
13.84% |
|
65/20/15 Blended Index1 |
18.41% |
9.92% |
11.09% |
| 1 | Returns provided are calculated monthly using a blended allocation, as noted above. |
The after-tax returns are calculated using the historical highest individual federal marginal income tax rates and do not reflect the impact of state and local taxes. The after-tax figures are shown for one share class only, and would be different for the other share classes. Actual after-tax returns depend on an investor’s tax situation and may differ from those shown. After- tax returns are not relevant to investors who hold their Series shares through tax-deferred arrangements, such as 401(k) plans or individual retirement accounts.