Performance Management
|
Mar. 02, 2026 |
| Hennessy Cornerstone Growth Fund |
|
| Prospectus [Line Items] |
|
| Bar Chart and Performance Table [Heading] |
Performance
Information
|
| Performance Narrative [Text Block] |
The
following performance information provides some indication of the risks of investing in the Fund by showing changes in its performance
from year to year and how the Fund’s average annual returns for one, five, and ten years compare with those of indices that
reflect broad measures of market performance, the Russell 2000® Index and the S&P 500® Index.
For additional information on these indices, please see “Descriptions of Indices” on page 68 of this Prospectus. The
Fund’s past performance (before and after taxes) is not necessarily an indication of future performance. Performance may
be higher or lower in the future. Updated performance information is available at www.hennessyfunds.com.
|
| Performance Past Does Not Indicate Future [Text] |
The
Fund’s past performance (before and after taxes) is not necessarily an indication of future performance.
|
| Performance Information Illustrates Variability of Returns [Text] |
The
following performance information provides some indication of the risks of investing in the Fund by showing changes in its performance
from year to year and how the Fund’s average annual returns for one, five, and ten years compare with those of indices that
reflect broad measures of market performance, the Russell 2000® Index and the S&P 500® Index.
|
| Bar Chart [Heading] |
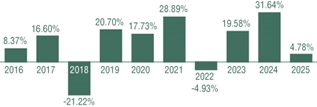
CALENDAR
YEAR TOTAL RETURNS OF INVESTOR SHARES
|
| Bar Chart [Table] |
| Years |
Returns |
| 2016 |
8.37 |
| 2017 |
16.60 |
| 2018 |
-21.22 |
| 2019 |
20.70 |
| 2020 |
17.73 |
| 2021 |
28.89 |
| 2022 |
-4.93 |
| 2023 |
19.58 |
| 2024 |
31.64 |
| 2025 |
4.78 |
|
| Bar Chart Closing [Text Block] |
For
the period shown in the bar chart, the Fund’s highest quarterly return was 36.11% for the quarter ended June 30, 2020, and
the lowest quarterly return was -39.27% for the quarter ended March 31, 2020.
Performance
of the Fund’s Institutional Class shares differs from that of the Fund’s Investor Class shares because the share classes
have different expenses.
|
| Highest Quarterly Return, Label [Optional Text] |
highest quarterly return
|
| Highest Quarterly Return |
36.11%
|
| Highest Quarterly Return, Date |
Jun. 30, 2020
|
| Lowest Quarterly Return, Label [Optional Text] |
lowest quarterly return
|
| Lowest Quarterly Return |
(39.27%)
|
| Lowest Quarterly Return, Date |
Mar. 31, 2020
|
| Performance Table Heading |
AVERAGE
ANNUAL TOTAL RETURNS
(for
the periods ended December 31, 2025)
|
| Performance Table Uses Highest Federal Rate |
The
after-tax returns are calculated using the highest historical individual stated federal marginal income tax rates and do not reflect
the impact of state and local taxes.
|
| Performance Table Not Relevant to Tax Deferred |
Actual after-tax returns depend on an individual investor’s tax situation and may differ
from those shown, and the after-tax returns shown are not relevant to investors who hold their Fund shares through tax-deferred
arrangements, such as 401(k) plans or individual retirement accounts.
|
| Performance [Table] |
| |
One |
Five |
Ten |
| |
Year |
Years |
Years |
| Hennessy
Cornerstone Growth |
|
|
|
| Fund
– Investor Shares |
|
|
|
| Return
before taxes |
4.78% |
15.11% |
11.08% |
| Return
after taxes |
|
|
|
| on
distributions |
4.78% |
13.08% |
9.86% |
| Return
after taxes |
|
|
|
| on
distributions and |
|
|
|
| sale
of Fund shares |
2.83% |
11.78% |
8.88% |
| Hennessy
Cornerstone Growth |
|
|
|
| Fund
– Institutional Shares |
|
|
|
| Return
before taxes |
5.09% |
15.49% |
11.44% |
| Russell
2000® Index |
|
|
|
| (reflects
no deduction for |
|
|
|
| fees,
expenses, or taxes) |
12.81% |
6.09% |
9.62% |
| S&P
500® Index |
|
|
|
| (reflects
no deduction for |
|
|
|
| fees,
expenses, or taxes) |
17.88% |
14.42% |
14.82% |
|
| Performance Table One Class of after Tax Shown [Text] |
After-tax returns are shown for Investor Class shares only,
and after-tax returns for Institutional Class shares will vary.
|
| Index No Deduction for Fees, Expenses, or Taxes [Text] |
(reflects
no deduction for fees,
expenses, or taxes)
|
| Performance Table Closing [Text Block] |
The
after-tax returns are calculated using the highest historical individual stated federal marginal income tax rates and do not reflect
the impact of state and local taxes. Actual after-tax returns depend on an individual investor’s tax situation and may differ
from those shown, and the after-tax returns shown are not relevant to investors who hold their Fund shares through tax-deferred
arrangements, such as 401(k) plans or individual retirement accounts. After-tax returns are shown for Investor Class shares only,
and after-tax returns for Institutional Class shares will vary.
|
| Performance Availability Website Address [Text] |
www.hennessyfunds.com
|
| Hennessy Focus Fund |
|
| Prospectus [Line Items] |
|
| Bar Chart and Performance Table [Heading] |
Performance
Information
|
| Performance Narrative [Text Block] |
The
following performance information provides some indication of the risks of investing in the Fund by showing changes in its performance
from year to year and how the Fund’s average annual returns for one, five, and ten years compare with those of an index
that reflects a broad measure of market performance, the Russell 3000® Index, as well as an additional index that
includes securities with market capitalizations and certain other attributes similar to the average market capitalization and
attributes of the securities in which the Fund invests, the Russell Midcap® Growth Index. For additional information
on these indices, please see “Descriptions of Indices” on page 68 of this Prospectus. The Fund’s past performance
(before and after taxes) is not necessarily an indication of future performance. Updated performance information is available
at www.hennessyfunds.com.
|
| Performance Past Does Not Indicate Future [Text] |
The Fund’s past performance
(before and after taxes) is not necessarily an indication of future performance.
|
| Performance Information Illustrates Variability of Returns [Text] |
The
following performance information provides some indication of the risks of investing in the Fund by showing changes in its performance
from year to year and how the Fund’s average annual returns for one, five, and ten years compare with those of an index
that reflects a broad measure of market performance, the Russell 3000® Index, as well as an additional index that
includes securities with market capitalizations and certain other attributes similar to the average market capitalization and
attributes of the securities in which the Fund invests, the Russell Midcap® Growth Index.
|
| Performance Additional Market Index [Text] |
We
use the Russell Midcap® Growth Index as an additional index because it reflects the performance of investments
with market capitalizations and certain other attributes similar to the average market capitalization and attributes of the securities
held by the Fund.
|
| Bar Chart [Heading] |
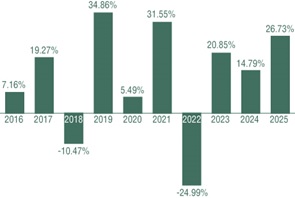
Calendar
Year TOTAL RETURNS OF INVESTOR SHARES
|
| Bar Chart [Table] |
| Years |
Returns |
| 2016 |
7.16 |
| 2017 |
19.27 |
| 2018 |
-10.47 |
| 2019 |
34.86 |
| 2020 |
5.49 |
| 2021 |
31.55 |
| 2022 |
-24.99 |
| 2023 |
20.85 |
| 2024 |
14.79 |
| 2025 |
26.73 |
|
| Bar Chart Closing [Text Block] |
For
the period shown in the bar chart, the Fund’s highest quarterly return was 29.66% for the quarter ended June 30, 2020, and
the lowest quarterly return was -30.24% for the quarter ended March 31, 2020.
Performance
of the Fund’s Institutional Class shares differs from that of the Fund’s Investor Class shares because the share classes
have different expenses and inception dates.
|
| Highest Quarterly Return, Label [Optional Text] |
highest quarterly return
|
| Highest Quarterly Return |
29.66%
|
| Highest Quarterly Return, Date |
Jun. 30, 2020
|
| Lowest Quarterly Return, Label [Optional Text] |
lowest quarterly return
|
| Lowest Quarterly Return |
(30.24%)
|
| Lowest Quarterly Return, Date |
Mar. 31, 2020
|
| Performance Table Heading |
Average
Annual Total Returns(for
the periods ended December 31, 2025)
|
| Performance Table Uses Highest Federal Rate |
The
after-tax returns are calculated using the highest historical individual stated federal marginal income tax rates and do not reflect
the impact of state and local taxes.
|
| Performance Table Not Relevant to Tax Deferred |
Actual after-tax returns depend on an individual investor’s tax situation and may differ
from those shown, and the after-tax returns shown are not relevant to investors who hold their Fund shares through tax-deferred
arrangements, such as 401(k) plans or individual retirement accounts.
|
| Performance Table Explanation after Tax Higher |
The Fund’s “return after taxes on distributions and
sale of Fund shares” may be higher than its “return after taxes on distributions” because it may include a tax
benefit due to the capital losses generated by the sale of Fund shares.
|
| Performance [Table] |
| Average
Annual Total Returns |
|
|
|
| (for
the periods ended December 31, 2025) |
|
|
|
| |
One |
Five |
Ten |
| |
Year |
Years |
Years |
| Hennessy
Focus Fund – |
|
|
|
| Investor
Shares |
|
|
|
| Return
before taxes |
26.73% |
11.65% |
10.94% |
| Return
after taxes |
|
|
|
| on
distributions |
16.87% |
6.63% |
7.01% |
| Return
after taxes |
|
|
|
| on
distributions and |
|
|
|
| sale
of Fund shares |
22.83% |
8.51% |
8.12% |
| Hennessy
Focus Fund – |
|
|
|
| Institutional
Shares |
|
|
|
| Return
before taxes |
27.22% |
12.07% |
11.35% |
| Russell
3000® Index |
|
|
|
| (reflects
no deduction for |
|
|
|
| fees,
expenses, or taxes) |
17.15% |
13.15% |
14.29% |
| Russell
Midcap® |
|
|
|
| Growth
Index |
|
|
|
| (reflects
no deduction for |
|
|
|
| fees,
expenses, or taxes) |
8.66% |
6.65% |
12.49% |
|
| Performance Table One Class of after Tax Shown [Text] |
After-tax returns are shown for Investor Class shares only,
and after-tax returns for Institutional Class shares will vary.
|
| Index No Deduction for Fees, Expenses, or Taxes [Text] |
(reflects
no deduction for fees,
expenses, or taxes)
|
| Performance Table Closing [Text Block] |
We
use the Russell Midcap® Growth Index as an additional index because it reflects the performance of investments
with market capitalizations and certain other attributes similar to the average market capitalization and attributes of the securities
held by the Fund.
The
after-tax returns are calculated using the highest historical individual stated federal marginal income tax rates and do not reflect
the impact of state and local taxes. Actual after-tax returns depend on an individual investor’s tax situation and may differ
from those shown, and the after-tax returns shown are not relevant to investors who hold their Fund shares through tax-deferred
arrangements, such as 401(k) plans or individual retirement accounts. After-tax returns are shown for Investor Class shares only,
and after-tax returns for Institutional Class shares will vary. The Fund’s “return after taxes on distributions and
sale of Fund shares” may be higher than its “return after taxes on distributions” because it may include a tax
benefit due to the capital losses generated by the sale of Fund shares.
|
| Performance Availability Website Address [Text] |
www.hennessyfunds.com
|
| Hennessy Cornerstone Mid Cap 30 Fund |
|
| Prospectus [Line Items] |
|
| Bar Chart and Performance Table [Heading] |
Performance
Information
|
| Performance Narrative [Text Block] |
The following performance information provides
some indication of the risks of investing in the Fund by showing its performance from year to year and how the Fund’s average
annual returns for one, five, and ten years compare with those of an index that reflects a broad measure of market performance,
the S&P 500® Index, as well as an additional index that reflects the types of securities in which the Fund invests,
the Russell Midcap® Index. For additional information on these indices, please see “Descriptions of Indices”
on page 68 of this Prospectus. The Fund’s past performance (before and after taxes) is not necessarily an indication of future
performance. Performance may be higher or lower in the future. Updated performance information is available at www.hennessyfunds.com.
|
| Performance Past Does Not Indicate Future [Text] |
The Fund’s past performance (before and after taxes) is not necessarily an indication of future
performance.
|
| Performance Information Illustrates Variability of Returns [Text] |
The following performance information provides
some indication of the risks of investing in the Fund by showing its performance from year to year and how the Fund’s average
annual returns for one, five, and ten years compare with those of an index that reflects a broad measure of market performance,
the S&P 500® Index, as well as an additional index that reflects the types of securities in which the Fund invests,
the Russell Midcap® Index.
|
| Performance Additional Market Index [Text] |
We
use the Russell Midcap® Index as an additional index because it reflects the performance of investments similar
to those of the Fund.
|
| Bar Chart [Heading] |
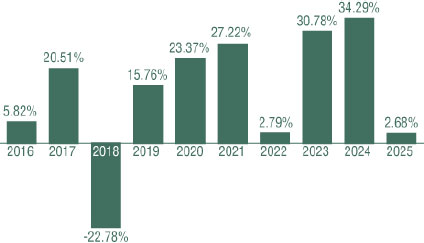
CALENDAR YEAR TOTAL RETURNS OF INVESTOR SHARES
|
| Bar Chart [Table] |
| Years |
Returns |
| 2016 |
5.82 |
| 2017 |
20.51 |
| 2018 |
-22.78 |
| 2019 |
15.76 |
| 2020 |
23.37 |
| 2021 |
27.22 |
| 2022 |
2.79 |
| 2023 |
30.78 |
| 2024 |
34.29 |
| 2025 |
2.68 |
|
| Bar Chart Closing [Text Block] |
For the period shown in
the bar chart, the Fund’s highest quarterly return was 37.39% for the quarter ended June 30, 2020, and the lowest quarterly
return was -37.29% for the quarter ended March 31, 2020.
Performance of the Fund’s
Institutional Class shares differs from that of the Fund’s Investor Class shares because the share classes have different
expenses and inception dates.
|
| Highest Quarterly Return, Label [Optional Text] |
highest quarterly return
|
| Highest Quarterly Return |
37.39%
|
| Highest Quarterly Return, Date |
Jun. 30, 2020
|
| Lowest Quarterly Return, Label [Optional Text] |
lowest quarterly
return
|
| Lowest Quarterly Return |
(37.29%)
|
| Lowest Quarterly Return, Date |
Mar. 31, 2020
|
| Performance Table Heading |
AVERAGE ANNUAL TOTAL RETURNS
(for the periods ended December 31, 2025)
|
| Performance Table Uses Highest Federal Rate |
The
after-tax returns are calculated using the highest historical individual stated federal marginal income tax rates and do not reflect
the impact of state and local taxes.
|
| Performance Table Not Relevant to Tax Deferred |
Actual after-tax returns depend on an individual investor’s tax situation and may differ
from those shown, and the after-tax returns shown are not relevant to investors who hold their Fund shares through tax-deferred
arrangements, such as 401(k) plans or individual retirement accounts.
|
| Performance [Table] |
| |
One |
Five |
Ten |
| |
Year |
Years |
Years |
| Hennessy
Cornerstone Mid Cap 30 |
|
|
|
| Fund
– Investor Shares |
|
|
|
| Return
before taxes |
2.68% |
18.72% |
12.74% |
| Return
after taxes |
|
|
|
| on
distributions |
2.51% |
16.16% |
10.31% |
| Return
after taxes |
|
|
|
| on
distributions and |
|
|
|
| sale
of Fund shares |
1.71% |
14.71% |
9.73% |
| Hennessy
Cornerstone Mid Cap 30 |
|
|
|
| Fund
– Institutional Shares |
|
|
|
| Return
before taxes |
3.04% |
19.16% |
13.15% |
| Russell
Midcap® Index |
|
|
|
| (reflects
no deduction for |
|
|
|
| fees,
expenses, or taxes) |
10.60% |
8.67% |
11.01% |
| S&P
500® Index |
|
|
|
| (reflects
no deduction for |
|
|
|
| fees,
expenses, or taxes) |
17.88% |
14.42% |
14.82% |
|
| Performance Table One Class of after Tax Shown [Text] |
After-tax returns are shown for Investor Class shares only,
and after-tax returns for Institutional Class shares will vary.
|
| Index No Deduction for Fees, Expenses, or Taxes [Text] |
(reflects
no deduction for fees,
expenses, or taxes)
|
| Performance Table Closing [Text Block] |
We
use the Russell Midcap® Index as an additional index because it reflects the performance of investments similar
to those of the Fund.
The
after-tax returns are calculated using the highest historical individual stated federal marginal income tax rates and do not reflect
the impact of state and local taxes. Actual after-tax returns depend on an individual investor’s tax situation and may differ
from those shown, and the after-tax returns shown are not relevant to investors who hold their Fund shares through tax-deferred
arrangements, such as 401(k) plans or individual retirement accounts. After-tax returns are shown for Investor Class shares only,
and after-tax returns for Institutional Class shares will vary.
|
| Performance Availability Website Address [Text] |
www.hennessyfunds.com
|
| Hennessy Cornerstone Large Growth Fund |
|
| Prospectus [Line Items] |
|
| Bar Chart and Performance Table [Heading] |
Performance
Information
|
| Performance Narrative [Text Block] |
The following performance information provides
some indication of the risks of investing in the Fund by showing changes in its performance from year to year and how the Fund’s
average annual returns for one, five, and ten years compare with those of indices that reflect broad measures of market performance,
the Russell 1000® Index and the S&P 500® Index. For additional information on these indices,
please see “Descriptions of Indices” on page 68 of this Prospectus. The Fund’s past performance (before and after
taxes) is not necessarily an indication of future performance. Performance may be higher or lower in the future. Updated performance
information is available at www.hennessyfunds.com.
|
| Performance Past Does Not Indicate Future [Text] |
The Fund’s past performance (before and after
taxes) is not necessarily an indication of future performance.
|
| Performance Information Illustrates Variability of Returns [Text] |
The following performance information provides
some indication of the risks of investing in the Fund by showing changes in its performance from year to year and how the Fund’s
average annual returns for one, five, and ten years compare with those of indices that reflect broad measures of market performance,
the Russell 1000® Index and the S&P 500® Index.
|
| Bar Chart [Heading] |
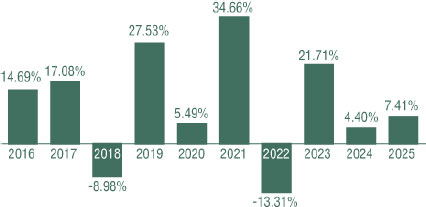
CALENDAR YEAR TOTAL RETURNS OF INVESTOR SHARES
|
| Bar Chart [Table] |
| Years |
Returns |
| 2016 |
14.69 |
| 2017 |
17.08 |
| 2018 |
-8.98 |
| 2019 |
27.53 |
| 2020 |
5.49 |
| 2021 |
34.66 |
| 2022 |
-13.31 |
| 2023 |
21.71 |
| 2024 |
4.40 |
| 2025 |
7.41 |
|
| Bar Chart Closing [Text Block] |
For
the period shown in the bar chart, the Fund’s highest quarterly return was 22.43% for the quarter ended June 30, 2020, and
the lowest quarterly return was -28.85% for the quarter ended March 31, 2020.
Performance of the Fund’s
Institutional Class shares differs from that of the Fund’s Investor Class shares because the share classes have different
expenses.
|
| Highest Quarterly Return, Label [Optional Text] |
highest quarterly return
|
| Highest Quarterly Return |
22.43%
|
| Highest Quarterly Return, Date |
Jun. 30, 2020
|
| Lowest Quarterly Return, Label [Optional Text] |
lowest quarterly return
|
| Lowest Quarterly Return |
(28.85%)
|
| Lowest Quarterly Return, Date |
Mar. 31, 2020
|
| Performance Table Heading |
AVERAGE ANNUAL TOTAL RETURNS
(for the periods ended December 31, 2025)
|
| Performance Table Uses Highest Federal Rate |
The
after-tax returns are calculated using the highest historical individual stated federal marginal income tax rates and do not reflect
the impact of state and local taxes.
|
| Performance Table Not Relevant to Tax Deferred |
Actual after-tax returns depend on an individual investor’s tax situation and may differ
from those shown, and the after-tax returns shown are not relevant to investors who hold their Fund shares through tax-deferred
arrangements, such as 401(k) plans or individual retirement accounts.
|
| Performance [Table] |
| |
One |
Five |
Ten |
| |
Year |
Years |
Years |
| Hennessy
Cornerstone Large |
|
|
|
| Growth
Fund – Investor Shares |
|
|
|
| Return
before taxes |
7.41% |
9.76% |
10.11% |
| Return
after taxes |
|
|
|
| on
distributions |
5.95% |
7.54% |
8.12% |
| Return
after taxes |
|
|
|
| on
distributions and |
|
|
|
| sale
of Fund shares |
5.45% |
7.46% |
7.86% |
| Hennessy
Cornerstone Large |
|
|
|
| Growth
Fund – Institutional Shares |
|
|
|
| Return
before taxes |
7.70% |
10.08% |
10.42% |
| Russell
1000® Index |
|
|
|
| (reflects
no deduction for |
|
|
|
| fees,
expenses, or taxes) |
17.37% |
13.59% |
14.59% |
| S&P
500® Index |
|
|
|
| (reflects
no deduction for |
|
|
|
| fees,
expenses, or taxes) |
17.88% |
14.42% |
14.82% |
|
| Performance Table One Class of after Tax Shown [Text] |
After-tax returns are shown for Investor Class shares only,
and after-tax returns for Institutional Class shares will vary.
|
| Index No Deduction for Fees, Expenses, or Taxes [Text] |
(reflects
no deduction for fees,
expenses, or taxes)
|
| Performance Table Closing [Text Block] |
The
after-tax returns are calculated using the highest historical individual stated federal marginal income tax rates and do not reflect
the impact of state and local taxes. Actual after-tax returns depend on an individual investor’s tax situation and may differ
from those shown, and the after-tax returns shown are not relevant to investors who hold their Fund shares through tax-deferred
arrangements, such as 401(k) plans or individual retirement accounts. After-tax returns are shown for Investor Class shares only,
and after-tax returns for Institutional Class shares will vary.
|
| Performance Availability Website Address [Text] |
www.hennessyfunds.com
|
| Hennessy Cornerstone Value Fund |
|
| Prospectus [Line Items] |
|
| Bar Chart and Performance Table [Heading] |
Performance
Information
|
| Performance Narrative [Text Block] |
The
following performance information provides some indication of the risks of investing in the Fund by showing changes in its performance
from year to year and how the Fund’s average annual returns for one, five, and ten years compare with those of an index that reflects
a broad measure of market performance, the S&P 500® Index, as well as an
additional index that reflects the types of securities in which the Fund invests, the Russell 1000® Value Index. For additional information on these indices, please see “Descriptions of Indices”
on page 68 of this Prospectus. The
Fund’s past performance (before and after taxes) is not necessarily an indication of future performance. Performance may
be higher or lower in the future. Updated performance information is available at www.hennessyfunds.com.
|
| Performance Past Does Not Indicate Future [Text] |
The
Fund’s past performance (before and after taxes) is not necessarily an indication of future performance.
|
| Performance Information Illustrates Variability of Returns [Text] |
The
following performance information provides some indication of the risks of investing in the Fund by showing changes in its performance
from year to year and how the Fund’s average annual returns for one, five, and ten years compare with those of an index that reflects
a broad measure of market performance, the S&P 500® Index, as well as an
additional index that reflects the types of securities in which the Fund invests, the Russell 1000® Value Index.
|
| Performance Additional Market Index [Text] |
We
use the Russell 1000® Value Index as an additional index because it reflects the performance of investments similar
to those of the Fund.
|
| Bar Chart [Heading] |
CALENDAR YEAR TOTAL RETURNS OF INVESTOR SHARES
|
| Bar Chart [Table] |
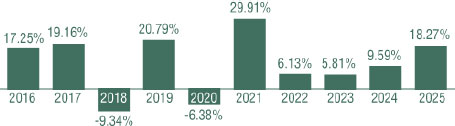
| Years |
Retuns |
| 2016 |
17.25 |
| 2017 |
19.16 |
| 2018 |
-9.34 |
| 2019 |
20.79 |
| 2020 |
-6.38 |
| 2021 |
29.91 |
| 2022 |
6.13 |
| 2023 |
5.81 |
| 2024 |
9.59 |
| 2025 |
18.27 |
|
| Bar Chart Closing [Text Block] |
For
the period shown in the bar chart, the Fund’s highest quarterly return was 16.26% for the quarter ended December 31, 2022,
and the lowest quarterly return was -28.40% for the quarter ended March 31, 2020.
Performance
of the Fund’s Institutional Class shares differs from that of the Fund’s Investor Class shares because the share classes
have different expenses and inception dates.
|
| Highest Quarterly Return, Label [Optional Text] |
highest quarterly return
|
| Highest Quarterly Return |
16.26%
|
| Highest Quarterly Return, Date |
Dec. 31, 2022
|
| Lowest Quarterly Return, Label [Optional Text] |
lowest quarterly return
|
| Lowest Quarterly Return |
(28.40%)
|
| Lowest Quarterly Return, Date |
Mar. 31, 2020
|
| Performance Table Heading |
AVERAGE ANNUAL TOTAL
RETURNS
(for the periods ended December 31, 2025)
|
| Performance Table Uses Highest Federal Rate |
The
after-tax returns are calculated using the highest historical individual stated federal marginal income tax rates and do not reflect
the impact of state and local taxes.
|
| Performance Table Not Relevant to Tax Deferred |
Actual after-tax returns depend on an individual investor’s tax situation and may differ
from those shown, and the after-tax returns shown are not relevant to investors who hold their Fund shares through tax-deferred
arrangements, such as 401(k) plans or individual retirement accounts.
|
| Performance [Table] |
| |
One |
Five |
Ten |
| |
Year |
Years |
Years |
| Hennessy
Cornerstone Value |
|
|
|
| Fund
– Investor Shares |
|
|
|
| Return
before taxes |
18.27% |
13.59% |
10.48% |
| Return
after taxes |
|
|
|
| on
distributions |
16.30% |
12.02% |
8.61% |
| Return
after taxes |
|
|
|
| on
distributions and |
|
|
|
| sale
of Fund shares |
12.21% |
10.67% |
8.05% |
| Hennessy
Cornerstone Value |
|
|
|
| Fund
– Institutional Shares |
|
|
|
| Return
before taxes |
18.60% |
13.85% |
10.73% |
| Russell
1000® Value Index |
|
|
|
| (reflects
no deduction for |
|
|
|
| fees,
expenses, or taxes) |
15.91% |
11.33% |
10.53% |
| S&P
500® Index |
|
|
|
| (reflects
no deduction for |
|
|
|
| fees,
expenses, or taxes) |
17.88% |
14.42% |
14.82% |
|
| Performance Table One Class of after Tax Shown [Text] |
After-tax returns are shown for Investor Class shares only,
and after-tax returns for Institutional Class shares will vary.
|
| Index No Deduction for Fees, Expenses, or Taxes [Text] |
(reflects
no deduction for fees,
expenses, or taxes)
|
| Performance Table Closing [Text Block] |
We
use the Russell 1000® Value Index as an additional index because it reflects the performance of investments similar
to those of the Fund.
The
after-tax returns are calculated using the highest historical individual stated federal marginal income tax rates and do not reflect
the impact of state and local taxes. Actual after-tax returns depend on an individual investor’s tax situation and may differ
from those shown, and the after-tax returns shown are not relevant to investors who hold their Fund shares through tax-deferred
arrangements, such as 401(k) plans or individual retirement accounts. After-tax returns are shown for Investor Class shares only,
and after-tax returns for Institutional Class shares will vary.
|
| Performance Availability Website Address [Text] |
www.hennessyfunds.com
|
| Hennessy Total Return Fund |
|
| Prospectus [Line Items] |
|
| Bar Chart and Performance Table [Heading] |
Performance
Information
|
| Performance Narrative [Text Block] |
The
following performance information provides some indication of the risks of investing in the Hennessy Total Return Fund by showing
changes in its performance from year to year and how the Fund’s average annual returns for one, five, and ten years compare
with those of an index that reflects a broad measure of market performance, the DJIA, as well as an additional index that reflects
the types of securities in which the Fund invests, the 75/25 Blended DJIA/Treasury Index (which consists of 75% common stocks
represented by the DJIA and 25% short-duration Treasury securities represented by the ICE BofAML U.S. 3-Month Treasury Bill Index).
For additional information on these indices, please see “Descriptions of Indices” on page 68 of this Prospectus. The
Fund’s past performance (before and after taxes) is not necessarily an indication of future performance. Performance may
be higher or lower in the future. Updated performance information is available at www.hennessyfunds.com.
|
| Performance Past Does Not Indicate Future [Text] |
The
Fund’s past performance (before and after taxes) is not necessarily an indication of future performance.
|
| Performance Information Illustrates Variability of Returns [Text] |
The
following performance information provides some indication of the risks of investing in the Hennessy Total Return Fund by showing
changes in its performance from year to year and how the Fund’s average annual returns for one, five, and ten years compare
with those of an index that reflects a broad measure of market performance, the DJIA, as well as an additional index that reflects
the types of securities in which the Fund invests, the 75/25 Blended DJIA/Treasury Index (which consists of 75% common stocks
represented by the DJIA and 25% short-duration Treasury securities represented by the ICE BofAML U.S. 3-Month Treasury Bill Index).
|
| Performance Additional Market Index [Text] |
We
use the 75/25 Blended DJIA/Treasury Index as an additional index because it reflects the performance of investments similar to
those of the Fund.
|
| Bar Chart [Heading] |
CALENDAR
YEAR TOTAL RETURNS
|
| Bar Chart [Table] |
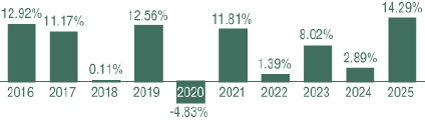
| Years |
Returns |
| 2016 |
12.92 |
| 2017 |
11.17 |
| 2018 |
0.11 |
| 2019 |
12.56 |
| 2020 |
-4.83 |
| 2021 |
11.81 |
| 2022 |
1.39 |
| 2023 |
8.02 |
| 2024 |
2.89 |
| 2025 |
14.29 |
|
| Bar Chart Closing [Text Block] |
For
the period shown on the bar chart, the Fund’s highest quarterly return was 12.66% for the quarter ended December 31, 2022,
and the lowest quarterly return was -17.87% for the quarter ended March 31, 2020.
|
| Highest Quarterly Return, Label [Optional Text] |
highest quarterly return
|
| Highest Quarterly Return |
12.66%
|
| Highest Quarterly Return, Date |
Dec. 31, 2022
|
| Lowest Quarterly Return, Label [Optional Text] |
lowest quarterly return
|
| Lowest Quarterly Return |
(17.87%)
|
| Lowest Quarterly Return, Date |
Mar. 31, 2020
|
| Performance Table Heading |
AVERAGE
ANNUAL TOTAL RETURNS
(for
the periods ended December 31, 2025)
|
| Performance Table Uses Highest Federal Rate |
The
after-tax returns are calculated using the highest historical individual stated federal marginal income tax rates and do not reflect
the impact of state and local taxes.
|
| Performance Table Not Relevant to Tax Deferred |
Actual after-tax returns depend on an individual investor’s tax situation and may differ
from those shown, and the after-tax returns shown are not relevant to investors who hold their Fund shares through tax-deferred
arrangements, such as 401(k) plans or individual retirement accounts.
|
| Performance [Table] |
| |
One |
Five |
Ten |
| |
Year |
Years |
Years |
| Hennessy
Total Return Fund |
|
|
|
| Return
before taxes |
14.29% |
7.57% |
6.84% |
| Return
after taxes |
|
|
|
| on
distributions |
13.68% |
6.47% |
5.49% |
| Return
after taxes |
|
|
|
| on
distributions and |
|
|
|
| sale
of Fund shares |
8.86% |
5.79% |
5.22% |
| 75/25
Blended |
|
|
|
| DJIA/Treasury
Index |
|
|
|
| (reflects
no deduction for |
|
|
|
| fees,
expenses, or taxes) |
12.25% |
9.64% |
10.52% |
| Dow
Jones |
|
|
|
| Industrial
Average |
|
|
|
| (reflects
no deduction for |
|
|
|
| fees,
expenses, or taxes) |
14.92% |
11.58% |
13.11% |
|
| Index No Deduction for Fees, Expenses, or Taxes [Text] |
(reflects
no deduction for fees,
expenses, or taxes)
|
| Performance Table Closing [Text Block] |
We
use the 75/25 Blended DJIA/Treasury Index as an additional index because it reflects the performance of investments similar to
those of the Fund.
The
after-tax returns are calculated using the highest historical individual stated federal marginal income tax rates and do not reflect
the impact of state and local taxes. Actual after-tax returns depend on an individual investor’s tax situation and may differ
from those shown, and the after-tax returns shown are not relevant to investors who hold their Fund shares through tax-deferred
arrangements, such as 401(k) plans or individual retirement accounts.
|
| Performance Availability Website Address [Text] |
www.hennessyfunds.com
|
| Hennessy Equity and Income Fund |
|
| Prospectus [Line Items] |
|
| Bar Chart and Performance Table [Heading] |
Performance
Information
|
| Performance Narrative [Text Block] |
The
following performance information provides some indication of the risks of investing in the Fund by showing changes in its performance
from year to year and how the Fund’s average annual returns for one, five, and ten years compare with an index that reflects
a broad measure of market performance, the S&P 500® Index. For additional information on this index, please
see “Descriptions of Indices” on page 68 of this Prospectus. The Fund’s past performance (before and after taxes)
is not necessarily an indication of future performance. Performance may be higher or lower in the future. Updated performance
information is available at www.hennessyfunds.com.
|
| Performance Past Does Not Indicate Future [Text] |
The Fund’s past performance (before and after taxes)
is not necessarily an indication of future performance.
|
| Performance Information Illustrates Variability of Returns [Text] |
The
following performance information provides some indication of the risks of investing in the Fund by showing changes in its performance
from year to year and how the Fund’s average annual returns for one, five, and ten years compare with an index that reflects
a broad measure of market performance, the S&P 500® Index.
|
| Bar Chart [Heading] |
CALENDAR
YEAR TOTAL RETURNS OF INVESTOR SHARES
|
| Bar Chart [Table] |
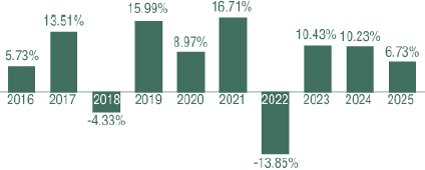
| Years |
Returns |
| 2016 |
5.73 |
| 2017 |
13.51 |
| 2018 |
-4.33 |
| 2019 |
15.99 |
| 2020 |
8.97 |
| 2021 |
16.71 |
| 2022 |
-13.85 |
| 2023 |
10.43 |
| 2024 |
10.23 |
| 2025 |
6.73 |
|
| Bar Chart Closing [Text Block] |
For
the period shown in the bar chart, the Fund’s highest quarterly return was 12.62% for the quarter ended June 30, 2020, and
the lowest quarterly return was -14.79% for the quarter ended March 31, 2020.
Performance
of the Fund’s Institutional Class shares differs from that of the Fund’s Investor Class shares because the share classes
have different expenses.
|
| Highest Quarterly Return, Label [Optional Text] |
highest quarterly return
|
| Highest Quarterly Return |
12.62%
|
| Highest Quarterly Return, Date |
Jun. 30, 2020
|
| Lowest Quarterly Return, Label [Optional Text] |
lowest quarterly return
|
| Lowest Quarterly Return |
(14.79%)
|
| Lowest Quarterly Return, Date |
Mar. 31, 2020
|
| Performance Table Heading |
Average
Annual Total Returns
(for
the periods ended December 31, 2025)
|
| Performance Table Uses Highest Federal Rate |
The
after-tax returns are calculated using the highest historical individual stated federal marginal income tax rates and do not reflect
the impact of state and local taxes.
|
| Performance Table Not Relevant to Tax Deferred |
Actual after-tax returns depend on an individual investor’s tax situation and may differ
from those shown, and the after-tax returns shown are not relevant to investors who hold their Fund shares through tax-deferred
arrangements, such as 401(k) plans or individual retirement accounts.
|
| Performance Table Explanation after Tax Higher |
The Fund’s “return after taxes on distributions and
sale of Fund shares” may be higher than its “return after taxes on distributions” because it may include a tax
benefit due to the capital losses generated by the sale of Fund shares.
|
| Performance [Table] |
| |
One |
Five |
Ten |
| |
Year |
Years |
Years |
| Hennessy
Equity and Income |
|
|
|
| Fund
– Investor Shares |
|
|
|
| Return
before taxes |
6.73% |
5.49% |
6.60% |
| Return
after taxes |
|
|
|
| on
distributions |
4.00% |
3.46% |
4.65% |
| Return
after taxes |
|
|
|
| on
distributions and |
|
|
|
| sale
of Fund shares |
5.94% |
4.15% |
4.99% |
| Hennessy
Equity and Income |
|
|
|
| Fund
– Institutional Shares |
|
|
|
| Return
before taxes |
7.24% |
5.88% |
7.01% |
| S&P
500® Index |
|
|
|
| (reflects
no deduction for |
|
|
|
| fees,
expenses, or taxes) |
17.88% |
14.42% |
14.82% |
|
| Performance Table One Class of after Tax Shown [Text] |
After-tax returns are shown for Investor Class shares only
and after-tax returns for Institutional Class shares will vary.
|
| Index No Deduction for Fees, Expenses, or Taxes [Text] |
(reflects
no deduction for fees,
expenses, or taxes)
|
| Performance Table Closing [Text Block] |
The
after-tax returns are calculated using the highest historical individual stated federal marginal income tax rates and do not reflect
the impact of state and local taxes. Actual after-tax returns depend on an individual investor’s tax situation and may differ
from those shown, and the after-tax returns shown are not relevant to investors who hold their Fund shares through tax-deferred
arrangements, such as 401(k) plans or individual retirement accounts. After-tax returns are shown for Investor Class shares only
and after-tax returns for Institutional Class shares will vary. The Fund’s “return after taxes on distributions and
sale of Fund shares” may be higher than its “return after taxes on distributions” because it may include a tax
benefit due to the capital losses generated by the sale of Fund shares.
|
| Performance Availability Website Address [Text] |
www.hennessyfunds.com
|
| Hennessy Balanced Fund |
|
| Prospectus [Line Items] |
|
| Bar Chart and Performance Table [Heading] |
Performance
Information
|
| Performance Narrative [Text Block] |
The
following performance information provides some indication of the risks of investing in the Hennessy Balanced Fund by showing
changes in its performance from year to year and how the Fund’s average annual returns for one, five, and ten years compare
with those of an index that reflects a broad measure of market performance, the DJIA, as well as an additional index that reflects
the types of securities in which the Fund invests, the 50/50 Blended DJIA/Treasury Index (which consists of 50% common stocks
represented by the DJIA and 50% short-duration Treasury securities represented by the ICE BofAML 1-Year Treasury Note Index).
For additional information on these indices, please see “Descriptions of Indices” on page 68 of this Prospectus. The
Fund’s past performance (before and after taxes) is not necessarily an indication of future performance. Performance may
be higher or lower in the future. Updated performance information is available at www.hennessyfunds.com.
|
| Performance Past Does Not Indicate Future [Text] |
The
Fund’s past performance (before and after taxes) is not necessarily an indication of future performance.
|
| Performance Information Illustrates Variability of Returns [Text] |
The
following performance information provides some indication of the risks of investing in the Hennessy Balanced Fund by showing
changes in its performance from year to year and how the Fund’s average annual returns for one, five, and ten years compare
with those of an index that reflects a broad measure of market performance, the DJIA, as well as an additional index that reflects
the types of securities in which the Fund invests, the 50/50 Blended DJIA/Treasury Index (which consists of 50% common stocks
represented by the DJIA and 50% short-duration Treasury securities represented by the ICE BofAML 1-Year Treasury Note Index).
|
| Performance Additional Market Index [Text] |
We
use the 50/50 Blended DJIA/Treasury Index as an additional index because it reflects the performance of investments similar to
those of the Fund.
|
| Bar Chart [Heading] |
CALENDAR
YEAR TOTAL RETURNS
|
| Bar Chart [Table] |
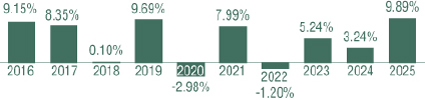
| Years |
Returns |
| 2016 |
9.15 |
| 2017 |
8.35 |
| 2018 |
0.10 |
| 2019 |
9.69 |
| 2020 |
-2.98 |
| 2021 |
7.99 |
| 2022 |
-1.20 |
| 2023 |
5.24 |
| 2024 |
3.24 |
| 2025 |
9.89 |
|
| Bar Chart Closing [Text Block] |
For
the period shown on the bar chart, the Fund’s highest quarterly return was 7.31% for the quarter ended December 31, 2022,
and the lowest quarterly return was -12.19% for the quarter ended March 31, 2020.
|
| Highest Quarterly Return, Label [Optional Text] |
highest quarterly return
|
| Highest Quarterly Return |
7.31%
|
| Highest Quarterly Return, Date |
Dec. 31, 2022
|
| Lowest Quarterly Return, Label [Optional Text] |
lowest quarterly return
|
| Lowest Quarterly Return |
(12.19%)
|
| Lowest Quarterly Return, Date |
Mar. 31, 2020
|
| Performance Table Heading |
AVERAGE
ANNUAL TOTAL RETURNS
(for
the periods ended December 31, 2025)
|
| Performance Table Uses Highest Federal Rate |
The
after-tax returns are calculated using the highest historical individual stated federal marginal income tax rates and do not reflect
the impact of state and local taxes.
|
| Performance Table Not Relevant to Tax Deferred |
Actual after-tax returns depend on an individual investor’s tax situation and may differ
from those shown, and the after-tax returns shown are not relevant to investors who hold their Fund shares through tax-deferred
arrangements, such as 401(k) plans or individual retirement accounts.
|
| Performance [Table] |
| |
One |
Five |
Ten |
| |
Year |
Years |
Years |
| Hennessy
Balanced Fund |
|
|
|
| Return
before taxes |
9.89% |
4.96% |
4.84% |
| Return
after taxes |
|
|
|
| on
distributions |
9.34% |
4.11% |
3.78% |
| Return
after taxes |
|
|
|
| on
distributions and |
|
|
|
| sale
of Fund shares |
6.15% |
3.74% |
3.66% |
| 50/50
Blended |
|
|
|
| DJIA/Treasury
Index |
|
|
|
| (reflects
no deduction for |
|
|
|
| fees,
expenses, or taxes) |
9.67% |
7.27% |
7.77% |
| Dow
Jones |
|
|
|
| Industrial
Average |
|
|
|
| (reflects
no deduction for |
|
|
|
| fees,
expenses, or taxes) |
14.92% |
11.58% |
13.11% |
|
| Index No Deduction for Fees, Expenses, or Taxes [Text] |
(reflects
no deduction for fees,
expenses, or taxes)
|
| Performance Table Closing [Text Block] |
We
use the 50/50 Blended DJIA/Treasury Index as an additional index because it reflects the performance of investments similar to
those of the Fund.
The
after-tax returns are calculated using the highest historical individual stated federal marginal income tax rates and do not reflect
the impact of state and local taxes. Actual after-tax returns depend on an individual investor’s tax situation and may differ
from those shown, and the after-tax returns shown are not relevant to investors who hold their Fund shares through tax-deferred
arrangements, such as 401(k) plans or individual retirement accounts.
|
| Performance Availability Website Address [Text] |
www.hennessyfunds.com
|
| Hennessy Energy Transition Fund |
|
| Prospectus [Line Items] |
|
| Bar Chart and Performance Table [Heading] |
Performance
Information
|
| Performance Narrative [Text Block] |
The
following performance information provides some indication of the risks of investing in the Fund by showing changes in its performance
from year to year and how the Fund’s average annual returns for one, five, and ten years compare with those of an index
that reflects a broad measure of market performance, the S&P 500® Index, as well as an additional index
that reflects the market sector in which the Fund invests, the S&P 500® Energy Index. For additional information
on these indices, please see “Descriptions of Indices” on page 68 of this Prospectus. The Fund is the successor to
the BP Capital TwinLine Energy Fund, a series of Professionally Managed Portfolios (the “Predecessor BP TwinLine Energy
Fund”), pursuant to a reorganization that took place on October 26, 2018. The performance information provided for
the periods on or prior to October 26, 2018, is historical information for the Predecessor BP TwinLine Energy Fund. The Predecessor
BP TwinLine Energy Fund had a substantially similar investment objective and investment strategy as the Fund. The Fund’s
past performance (before and after taxes) is not necessarily an indication of future performance. Performance may be higher or
lower in the future. Updated performance information is available at www.hennessyfunds.com.
|
| Performance Past Does Not Indicate Future [Text] |
The Fund’s
past performance (before and after taxes) is not necessarily an indication of future performance.
|
| Performance Information Illustrates Variability of Returns [Text] |
The
following performance information provides some indication of the risks of investing in the Fund by showing changes in its performance
from year to year and how the Fund’s average annual returns for one, five, and ten years compare with those of an index
that reflects a broad measure of market performance, the S&P 500® Index, as well as an additional index
that reflects the market sector in which the Fund invests, the S&P 500® Energy Index.
|
| Performance Additional Market Index [Text] |
We
use the S&P 500® Energy Index as an additional index because it reflects the performance of investments similar
to those of the Fund.
|
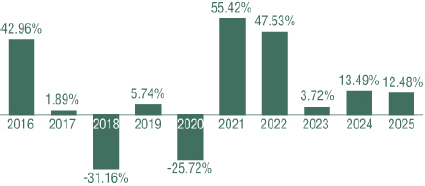
| Bar Chart [Heading] |
CALENDAR
YEAR TOTAL RETURNS OF INVESTOR SHARES
|
| Bar Chart [Table] |
| Years |
Returns |
| 2016 |
42.96 |
| 2017 |
1.89 |
| 2018 |
-31.16 |
| 2019 |
5.74 |
| 2020 |
-25.72 |
| 2021 |
55.42 |
| 2022 |
47.53 |
| 2023 |
3.72 |
| 2024 |
13.49 |
| 2025 |
12.48 |
|
| Bar Chart Closing [Text Block] |
For
the period shown in the bar chart, the Fund’s highest quarterly return was 49.76% for the quarter ended June 30, 2020, and
the lowest quarterly return was -59.88% for the quarter ended March 31, 2020.
Performance
of the Fund’s Institutional Class shares differs from that of the Fund’s Investor Class shares because the share classes
have different expenses.
|
| Highest Quarterly Return, Label [Optional Text] |
highest quarterly return
|
| Highest Quarterly Return |
49.76%
|
| Highest Quarterly Return, Date |
Jun. 30, 2020
|
| Lowest Quarterly Return, Label [Optional Text] |
lowest quarterly return
|
| Lowest Quarterly Return |
(59.88%)
|
| Lowest Quarterly Return, Date |
Mar. 31, 2020
|
| Performance Table Heading |
AVERAGE
ANNUAL TOTAL RETURNS
(for
the periods ended December 31, 2025)
|
| Performance Table Uses Highest Federal Rate |
The
after-tax returns are calculated using the highest historical individual stated federal income tax rates and do not reflect the
impact of state and local taxes.
|
| Performance Table Not Relevant to Tax Deferred |
Actual after-tax returns depend on an individual investor’s tax situation and may differ
from those shown, and the after-tax returns shown are not relevant to investors who hold their Fund shares through tax-deferred
arrangements, such as 401(k) plans or individual retirement accounts.
|
| Performance [Table] |
| |
One |
Five |
Ten |
| |
Year |
Years |
Years |
| Hennessy
Energy |
|
|
|
| Transition
Fund – |
|
|
|
| Investor
Shares1 |
|
|
|
| Return
before taxes 1 |
12.48% |
24.87% |
9.11% |
| Return
after taxes |
|
|
|
| on
distributions 1 |
12.34% |
23.68% |
8.59% |
| Return
after taxes |
|
|
|
| on
distributions and |
|
|
|
| sale
of Fund shares 1 |
7.49% |
19.87% |
7.18% |
| Hennessy
Energy |
|
|
|
| Transition
Fund – |
|
|
|
| Institutional
Shares |
|
|
|
| Return
before taxes |
12.86% |
25.30% |
9.43% |
| S&P
500® Energy Index |
|
|
|
| (reflects
no deduction for |
|
|
|
| fees,
expenses, or taxes) |
8.67% |
23.78% |
8.32% |
| S&P
500® Index |
|
|
|
| (reflects
no deduction for |
|
|
|
| fees,
expenses, or taxes) |
17.88% |
14.42% |
14.82% |
| 1 | Prior
to the reorganization that took place on October 26, 2018, Investor Class shares of the
Fund were subject to a sales charge (load) on purchases. In connection with the reorganization,
performance information has been restated to reflect the removal of the sales load. |
|
| Performance Table One Class of after Tax Shown [Text] |
After-tax returns are shown for Investor Class shares only,
and after-tax returns for Institutional Class shares will vary.
|
| Index No Deduction for Fees, Expenses, or Taxes [Text] |
(reflects
no deduction for fees,
expenses, or taxes)
|
| Performance Table Closing [Text Block] |
We
use the S&P 500® Energy Index as an additional index because it reflects the performance of investments similar
to those of the Fund.
The
after-tax returns are calculated using the highest historical individual stated federal income tax rates and do not reflect the
impact of state and local taxes. Actual after-tax returns depend on an individual investor’s tax situation and may differ
from those shown, and the after-tax returns shown are not relevant to investors who hold their Fund shares through tax-deferred
arrangements, such as 401(k) plans or individual retirement accounts. After-tax returns are shown for Investor Class shares only,
and after-tax returns for Institutional Class shares will vary.
|
| Performance Availability Website Address [Text] |
www.hennessyfunds.com
|
| Hennessy Midstream Fund |
|
| Prospectus [Line Items] |
|
| Bar Chart and Performance Table [Heading] |
Performance
Information
|
| Performance Narrative [Text Block] |
The
following performance information provides some indication of the risks of investing in the Fund by showing changes in its performance
from year to year and how the Fund’s average annual returns for one, five, and ten years compare with those of an index
that reflects a broad measure of market performance, the S&P 500® Index, as well as an additional index
that reflects the market sector in which the Fund invests, the Alerian US Midstream Energy Index. For additional information on
these indices, please see “Descriptions of Indices” on page 68 of this Prospectus. The Fund is the successor to the
BP Capital TwinLine MLP Fund, a series of Professionally Managed Portfolios (the “Predecessor BP TwinLine MLP Fund”),
pursuant to a reorganization that took place on October 26, 2018. The performance information provided for the periods on or prior
to October 26, 2018, is historical information for the Predecessor BP TwinLine MLP Fund. The Predecessor BP TwinLine
MLP Fund had a substantially similar investment objective and investment strategy as the Fund. The Fund’s past performance
(before and after taxes) is not necessarily an indication of future performance. Performance may be higher or lower in the future.
Updated performance information is available at www.hennessyfunds.com.
|
| Performance Past Does Not Indicate Future [Text] |
The Fund’s past performance
(before and after taxes) is not necessarily an indication of future performance.
|
| Performance Information Illustrates Variability of Returns [Text] |
The
following performance information provides some indication of the risks of investing in the Fund by showing changes in its performance
from year to year and how the Fund’s average annual returns for one, five, and ten years compare with those of an index
that reflects a broad measure of market performance, the S&P 500® Index, as well as an additional index
that reflects the market sector in which the Fund invests, the Alerian US Midstream Energy Index.
|
| Performance Additional Market Index [Text] |
We
use the Alerian US Midstream Energy Index as an additional index because it reflects the performance of investments similar to
those of the Fund.
|
| Bar Chart [Heading] |
CALENDAR
YEAR TOTAL RETURNS OF INVESTOR SHARES
|
| Bar Chart [Table] |
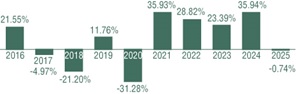
| Years |
Returns |
| 2016 |
21.55 |
| 2017 |
-4.97 |
| 2018 |
-21.20 |
| 2019 |
11.76 |
| 2020 |
-31.28 |
| 2021 |
35.93 |
| 2022 |
28.82 |
| 2023 |
23.39 |
| 2024 |
35.94 |
| 2025 |
-0.74 |
|
| Bar Chart Closing [Text Block] |
For
the period shown in the bar chart, the Fund’s highest quarterly return was 37.93% for the quarter ended June 30, 2020, and
the lowest quarterly return was -53.24% for the quarter ended March 31, 2020.
Performance
of the Fund’s Institutional Class shares differs from that of the Fund’s Investor Class shares because the share classes
have different expenses.
|
| Highest Quarterly Return, Label [Optional Text] |
highest quarterly return
|
| Highest Quarterly Return |
37.93%
|
| Highest Quarterly Return, Date |
Jun. 30, 2020
|
| Lowest Quarterly Return, Label [Optional Text] |
lowest quarterly return
|
| Lowest Quarterly Return |
(53.24%)
|
| Lowest Quarterly Return, Date |
Mar. 31, 2020
|
| Performance Table Heading |
AVERAGE
ANNUAL TOTAL RETURNS
(for
the periods ended December 31, 2025)
|
| Performance Table Uses Highest Federal Rate |
The
after-tax returns are calculated using the highest historical individual stated federal income tax rates and do not reflect the
impact of state and local taxes.
|
| Performance Table Not Relevant to Tax Deferred |
Actual after-tax returns depend on an individual investor’s tax situation and may differ
from those shown, and the after-tax returns shown are not relevant to investors who hold their Fund shares through tax-deferred
arrangements, such as 401(k) plans or individual retirement accounts.
|
| Performance Table Explanation after Tax Higher |
The Fund’s “return after taxes on distributions and
sale of Fund shares” may be higher than its “return after taxes on distributions” because it may include a tax
benefit due to the capital losses generated by the sale of Fund shares.
|
| Performance [Table] |
| |
One |
Five |
Ten |
| |
Year |
Years |
Years |
| Hennessy
Midstream Fund – |
|
|
|
| Investor
Shares1 |
|
|
|
| Return
before taxes 1 |
-0.74% |
23.86% |
7.38% |
| Return
after taxes |
|
|
|
| on
distributions 1 |
-1.76% |
22.99% |
6.96% |
| Return
after taxes |
|
|
|
| on
distributions and |
|
|
|
| sale
of Fund shares 1 |
0.32% |
19.57% |
5.91% |
| Hennessy
Midstream Fund – |
|
|
|
| Institutional
Shares |
|
|
|
| Return
before taxes |
-0.47% |
24.17% |
7.65% |
| Alerian
US Midstream |
|
|
|
| Energy
Index |
|
|
|
| (reflects
no deduction for |
|
|
|
| fees,
expenses, or taxes) |
2.73% |
28.23% |
12.92% |
| S&P
500® Index |
|
|
|
| (reflects
no deduction for |
|
|
|
| fees,
expenses, or taxes) |
17.88% |
14.42% |
14.82% |
| 1 | Prior
to the reorganization that took place on October 26, 2018, Investor Class shares of the
Fund were subject to a sales charge (load) on purchases. In connection with the reorganization,
performance information has been restated to reflect the removal of the sales load. |
|
| Performance Table One Class of after Tax Shown [Text] |
After-tax returns are shown for Investor Class shares only,
and after-tax returns for Institutional Class shares will vary.
|
| Index No Deduction for Fees, Expenses, or Taxes [Text] |
(reflects
no deduction for fees,
expenses, or taxes)
|
| Performance Table Closing [Text Block] |
We
use the Alerian US Midstream Energy Index as an additional index because it reflects the performance of investments similar to
those of the Fund.
The
after-tax returns are calculated using the highest historical individual stated federal income tax rates and do not reflect the
impact of state and local taxes. Actual after-tax returns depend on an individual investor’s tax situation and may differ
from those shown, and the after-tax returns shown are not relevant to investors who hold their Fund shares through tax-deferred
arrangements, such as 401(k) plans or individual retirement accounts. After-tax returns are shown for Investor Class shares only,
and after-tax returns for Institutional Class shares will vary. The Fund’s “return after taxes on distributions and
sale of Fund shares” may be higher than its “return after taxes on distributions” because it may include a tax
benefit due to the capital losses generated by the sale of Fund shares.
|
| Performance Availability Website Address [Text] |
www.hennessyfunds.com
|
| Hennessy Gas Utility Fund |
|
| Prospectus [Line Items] |
|
| Bar Chart and Performance Table [Heading] |
Performance
Information
|
| Performance Narrative [Text Block] |
The
following performance information provides some indication of the risks of investing in the Fund by showing changes in its performance
from year to year and how the Fund’s average annual returns for one, five, and ten years compare with those of an index
reflecting a broad measure of market performance, the S&P 500® Index, as well as an additional index that reflects
the market sector in which the Fund invests, the AGA Stock Index. For additional information on these indices, please see “Descriptions
of Indices” on page 68 of this Prospectus. The Fund’s past performance (before and after taxes) is not necessarily
an indication of future performance. Performance may be higher or lower in the future. Updated performance information is available
at www.hennessyfunds.com.
|
| Performance Past Does Not Indicate Future [Text] |
The Fund’s past performance (before and after taxes) is not necessarily
an indication of future performance.
|
| Performance Information Illustrates Variability of Returns [Text] |
The
following performance information provides some indication of the risks of investing in the Fund by showing changes in its performance
from year to year and how the Fund’s average annual returns for one, five, and ten years compare with those of an index
reflecting a broad measure of market performance, the S&P 500® Index, as well as an additional index that reflects
the market sector in which the Fund invests, the AGA Stock Index.
|
| Performance Additional Market Index [Text] |
We
use the AGA Stock Index as an additional index because it reflects the performance of investments similar to those of the Fund.
|
| Bar Chart [Heading] |
CALENDAR
YEAR TOTAL RETURNS OF INVESTOR SHARES
|
| Bar Chart [Table] |
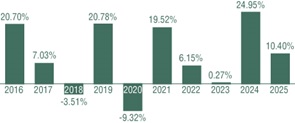
| Years |
Returns |
| 2016 |
20.70 |
| 2017 |
7.03 |
| 2018 |
-3.51 |
| 2019 |
20.78 |
| 2020 |
-9.32 |
| 2021 |
19.52 |
| 2022 |
6.15 |
| 2023 |
0.27 |
| 2024 |
24.95 |
| 2025 |
10.40 |
|
| Bar Chart Closing [Text Block] |
For
the period shown in the bar chart, the Fund’s highest quarterly return was 14.07% for the quarter ended March 31, 2019,
and the lowest quarterly return was -19.09% for the quarter ended March 31, 2020.
Performance
of the Fund’s Institutional Class differs from that of the Fund’s Investor Class shares because the share classes
have different expenses.
|
| Highest Quarterly Return, Label [Optional Text] |
highest quarterly return
|
| Highest Quarterly Return |
14.07%
|
| Highest Quarterly Return, Date |
Mar. 31, 2019
|
| Lowest Quarterly Return, Label [Optional Text] |
lowest quarterly return
|
| Lowest Quarterly Return |
(19.09%)
|
| Lowest Quarterly Return, Date |
Mar. 31, 2020
|
| Performance Table Heading |
Average
Annual Total Returns
(for
the periods ended December 31, 2025)
|
| Performance Table Uses Highest Federal Rate |
The
after-tax returns are calculated using the highest historical individual stated federal marginal income tax rates and do not reflect
the impact of state and local taxes.
|
| Performance Table Not Relevant to Tax Deferred |
Actual after-tax returns depend on an individual investor’s tax situation and may differ
from those shown, and the after-tax returns shown are not relevant to investors who hold their Fund shares through tax-deferred
arrangements, such as 401(k) plans or individual retirement accounts.
|
| Performance Table Explanation after Tax Higher |
The Fund’s “return after taxes on distributions and
sale of Fund shares” may be higher than its “return after taxes on distributions” because it may include a tax
benefit due to the capital losses generated by the sale of Fund shares.
|
| Performance [Table] |
| |
One |
Five |
Ten |
| |
Year |
Years |
Years |
| Hennessy
Gas Utility |
|
|
|
| Fund
– Investor Shares |
|
|
|
| Return
before taxes |
10.40% |
11.90% |
9.13% |
| Return
after taxes |
|
|
|
| on
distributions |
7.55% |
9.62% |
7.13% |
| Return
after taxes |
|
|
|
| on
distributions and |
|
|
|
| sale
of Fund shares |
8.22% |
9.14% |
7.00% |
| Hennessy
Gas Utility |
|
|
|
| Fund
– Institutional Shares |
|
|
|
| Return
before taxes |
10.70% |
12.24% |
9.43% |
| AGA
Stock Index |
|
|
|
| (reflects
no deduction for |
|
|
|
| fees,
expenses, or taxes) |
11.24% |
12.65% |
10.18% |
| S&P
500® Index |
|
|
|
| (reflects
no deduction for |
|
|
|
| fees,
expenses, or taxes) |
17.88% |
14.42% |
14.82% |
|
| Performance Table One Class of after Tax Shown [Text] |
After-tax returns are shown for Investor Class shares only,
and after-tax returns for Institutional Class shares will vary.
|
| Index No Deduction for Fees, Expenses, or Taxes [Text] |
(reflects
no deduction for fees,
expenses, or taxes)
|
| Performance Table Closing [Text Block] |
We
use the AGA Stock Index as an additional index because it reflects the performance of investments similar to those of the Fund.
The
after-tax returns are calculated using the highest historical individual stated federal marginal income tax rates and do not reflect
the impact of state and local taxes. Actual after-tax returns depend on an individual investor’s tax situation and may differ
from those shown, and the after-tax returns shown are not relevant to investors who hold their Fund shares through tax-deferred
arrangements, such as 401(k) plans or individual retirement accounts. After-tax returns are shown for Investor Class shares only,
and after-tax returns for Institutional Class shares will vary. The Fund’s “return after taxes on distributions and
sale of Fund shares” may be higher than its “return after taxes on distributions” because it may include a tax
benefit due to the capital losses generated by the sale of Fund shares.
The
inception date of the Fund’s Institutional Class shares is March 1, 2017. Performance shown prior to the inception of Institutional
Class shares reflects the performance of the Fund’s Investor Class shares and includes expenses that are not applicable
to, and are higher than, the Fund’s Institutional Class shares.
|
| Performance Availability Website Address [Text] |
www.hennessyfunds.com
|
| Hennessy Japan Fund |
|
| Prospectus [Line Items] |
|
| Bar Chart and Performance Table [Heading] |
Performance
Information
|
| Performance Narrative [Text Block] |
The
following performance information provides some indication of the risks of investing in the Fund by showing changes in its performance
from year to year and how the Fund’s average annual returns for one, five, and ten years compare with those of indices that
reflect broad measures of market performance, the Russell/Nomura Total Market™ Index and the Tokyo Stock Price Index (TOPIX).
For additional information on these indices, please see “Descriptions of Indices” on page 68 of this Prospectus. The
Fund’s past performance (before and after taxes) is not necessarily an indication of future performance. Performance may
be higher or lower in the future. Updated performance information is available at www.hennessyfunds.com.
|
| Performance Past Does Not Indicate Future [Text] |
The
Fund’s past performance (before and after taxes) is not necessarily an indication of future performance.
|
| Performance Information Illustrates Variability of Returns [Text] |
The
following performance information provides some indication of the risks of investing in the Fund by showing changes in its performance
from year to year and how the Fund’s average annual returns for one, five, and ten years compare with those of indices that
reflect broad measures of market performance, the Russell/Nomura Total Market™ Index and the Tokyo Stock Price Index (TOPIX).
|
| Bar Chart [Heading] |
CALENDAR
YEAR TOTAL RETURNS OF INVESTOR SHARES
|
| Bar Chart [Table] |
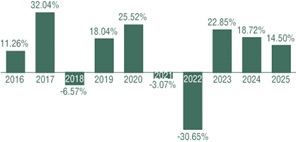
| Years |
Returns |
| 2016 |
11.26 |
| 2017 |
32.04 |
| 2018 |
-6.57 |
| 2019 |
18.04 |
| 2020 |
25.52 |
| 2021 |
-3.07 |
| 2022 |
-30.65 |
| 2023 |
22.85 |
| 2024 |
18.72 |
| 2025 |
14.50 |
|
| Bar Chart Closing [Text Block] |
For
the period shown in the bar chart, the Fund’s highest quarterly return was 20.72% for the quarter ended June 30, 2020, and
the lowest quarterly return was -18.44% for the quarter ended March 31, 2022.
Performance
of the Fund’s Institutional Class shares differs from that of the Fund’s Investor Class shares because the share classes
have different expenses.
|
| Highest Quarterly Return, Label [Optional Text] |
highest quarterly return
|
| Highest Quarterly Return |
20.72%
|
| Highest Quarterly Return, Date |
Jun. 30, 2020
|
| Lowest Quarterly Return, Label [Optional Text] |
lowest quarterly return
|
| Lowest Quarterly Return |
(18.44%)
|
| Lowest Quarterly Return, Date |
Mar. 31, 2022
|
| Performance Table Heading |
Average
Annual Total Returns
(for
the periods ended December 31, 2025)
|
| Performance Table Uses Highest Federal Rate |
The
after-tax returns are calculated using the highest historical individual stated federal marginal income tax rates and do not reflect
the impact of state and local taxes.
|
| Performance Table Not Relevant to Tax Deferred |
Actual after-tax returns depend on an individual investor’s tax situation and may differ
from those shown, and the after-tax returns shown are not relevant to investors who hold their Fund shares through tax-deferred
arrangements, such as 401(k) plans or individual retirement accounts.
|
| Performance Table Explanation after Tax Higher |
The Fund’s “return after taxes on distributions and
sale of Fund shares” may be higher than its “return after taxes on distributions” because it may include a tax
benefit due to the capital losses generated by the sale of Fund shares.
|
| Performance [Table] |
| |
One |
Five |
Ten |
| |
Year |
Years |
Years |
| Hennessy
Japan Fund – |
|
|
|
| Investor
Shares |
|
|
|
| Return
before taxes |
14.50% |
2.34% |
8.60% |
| Return
after taxes |
|
|
|
| on
distributions |
10.12% |
1.00% |
7.91% |
| Return
after taxes |
|
|
|
| on
distributions and |
|
|
|
| sale
of Fund shares |
9.57% |
1.53% |
6.92% |
| Hennessy
Japan Fund – |
|
|
|
| Institutional
Shares |
|
|
|
| Return
before taxes |
14.88% |
2.72% |
9.03% |
| Russell/Nomura
|
|
|
|
| Total
Market Index |
|
|
|
| (reflects
no deduction for |
|
|
|
| fees,
expenses, or taxes) |
27.51% |
7.23% |
8.12% |
| TOPIX |
|
|
|
| (reflects
no deduction for |
|
|
|
| fees,
expenses, or taxes) |
25.79% |
7.02% |
7.92% |
|
| Performance Table One Class of after Tax Shown [Text] |
After-tax returns are shown for Investor Class shares only,
and after-tax returns for Institutional Class shares will vary.
|
| Index No Deduction for Fees, Expenses, or Taxes [Text] |
(reflects
no deduction for fees,
expenses, or taxes)
|
| Performance Table Closing [Text Block] |
The
after-tax returns are calculated using the highest historical individual stated federal marginal income tax rates and do not reflect
the impact of state and local taxes. Actual after-tax returns depend on an individual investor’s tax situation and may differ
from those shown, and the after-tax returns shown are not relevant to investors who hold their Fund shares through tax-deferred
arrangements, such as 401(k) plans or individual retirement accounts. After-tax returns are shown for Investor Class shares only,
and after-tax returns for Institutional Class shares will vary. The Fund’s “return after taxes on distributions and
sale of Fund shares” may be higher than its “return after taxes on distributions” because it may include a tax
benefit due to the capital losses generated by the sale of Fund shares.
Returns
are presented in U.S. dollar terms.
|
| Performance Availability Website Address [Text] |
www.hennessyfunds.com
|
| Hennessy Japan Small Cap Fund |
|
| Prospectus [Line Items] |
|
| Bar Chart and Performance Table [Heading] |
Performance
Information
|
| Performance Narrative [Text Block] |
The
following performance information provides some indication of the risks of investing in the Fund by showing changes in its performance
from year to year and how the Fund’s average annual returns for one, five, and ten years compare with those of an index
that reflects a broad measure of market performance, the Tokyo Stock Price Index (TOPIX), as well as an additional index
that
reflects the types of securities in which the Fund invests, the Russell/Nomura Small Cap™ Index. For additional information
on these indices, please see “Descriptions of Indices” on page 68 of this Prospectus. The Fund’s past performance
(before and after taxes) is not necessarily an indication of future performance. Performance may be higher or lower in the future.
Updated performance information is available at www.hennessyfunds.com.
|
| Performance Past Does Not Indicate Future [Text] |
The Fund’s past performance
(before and after taxes) is not necessarily an indication of future performance.
|
| Performance Information Illustrates Variability of Returns [Text] |
The
following performance information provides some indication of the risks of investing in the Fund by showing changes in its performance
from year to year and how the Fund’s average annual returns for one, five, and ten years compare with those of an index
that reflects a broad measure of market performance, the Tokyo Stock Price Index (TOPIX), as well as an additional index that
reflects the types of securities in which the Fund invests, the Russell/Nomura Small Cap™ Index.
|
| Performance Additional Market Index [Text] |
We
use the Russell/Nomura Small Cap™ Index as an additional index because it reflects the performance of investments similar
to those of the Fund.
|
| Bar Chart [Heading] |
CALENDAR
YEAR TOTAL RETURNS OF INVESTOR SHARES
|
| Bar Chart [Table] |
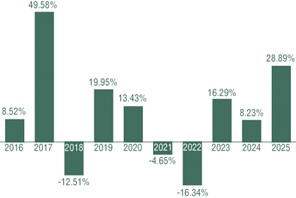
| Yeras |
Returns |
| 2016 |
8.52 |
| 2017 |
49.58 |
| 2018 |
-12.51 |
| 2019 |
19.95 |
| 2020 |
13.43 |
| 2021 |
-4.65 |
| 2022 |
-16.34 |
| 2023 |
16.29 |
| 2024 |
8.23 |
| 2025 |
28.89 |
|
| Bar Chart Closing [Text Block] |
For
the period shown in the bar chart, the Fund’s highest quarterly return was 19.35% for the quarter ended June 30, 2020, and
the lowest quarterly return was -23.20% for the quarter ended March 31, 2020.
Performance
of the Fund’s Institutional Class shares differs from that of the Fund’s Investor Class shares because the share classes
have different expenses and inception dates.
|
| Highest Quarterly Return, Label [Optional Text] |
highest quarterly return
|
| Highest Quarterly Return |
19.35%
|
| Highest Quarterly Return, Date |
Jun. 30, 2020
|
| Lowest Quarterly Return, Label [Optional Text] |
lowest quarterly return
|
| Lowest Quarterly Return |
(23.20%)
|
| Lowest Quarterly Return, Date |
Mar. 31, 2020
|
| Performance Table Heading |
Average
Annual Total Returns
(for
the periods ended December 31, 2025)
|
| Performance Table Uses Highest Federal Rate |
The
after-tax returns are calculated using the highest historical individual stated federal marginal income tax rates and do not reflect
the impact of state and local taxes.
|
| Performance Table Not Relevant to Tax Deferred |
Actual after-tax returns depend on an individual investor’s tax situation and may differ
from those shown, and the after-tax returns shown are not relevant to investors who hold their Fund shares through tax-deferred
arrangements, such as 401(k) plans or individual retirement accounts.
|
| Performance [Table] |
| |
One |
Five |
Ten |
| |
Year |
Years |
Years |
| Hennessy
Japan Small Cap |
|
|
|
| Fund
– Investor Shares |
|
|
|
| Return
before taxes |
28.89% |
5.29% |
9.60% |
| Return
after taxes |
|
|
|
| on
distributions |
25.33% |
4.58% |
9.06% |
| Return
after taxes |
|
|
|
| on
distributions and |
|
|
|
| sale
of Fund shares |
19.78% |
4.23% |
7.95% |
| Hennessy
Japan Small Cap |
|
|
|
| Fund
– Institutional Shares |
|
|
|
| Return
before taxes |
29.42% |
5.71% |
10.01% |
| Russell/Nomura
|
|
|
|
| Small
Cap™ Index |
|
|
|
| (reflects
no deduction for |
|
|
|
| fees,
expenses, or taxes) |
29.53% |
5.96% |
7.07% |
| TOPIX |
|
|
|
| (reflects
no deduction for |
|
|
|
| fees,
expenses, or taxes) |
25.79% |
7.02% |
7.92% |
|
| Performance Table One Class of after Tax Shown [Text] |
After-tax returns are shown for Investor Class shares only,
and after-tax returns for Institutional Class shares will vary.
|
| Index No Deduction for Fees, Expenses, or Taxes [Text] |
(reflects
no deduction for fees,
expenses, or taxes)
|
| Performance Table Closing [Text Block] |
We
use the Russell/Nomura Small Cap™ Index as an additional index because it reflects the performance of investments similar
to those of the Fund.
The
after-tax returns are calculated using the highest historical individual stated federal marginal income tax rates and do not reflect
the impact of state and local taxes. Actual after-tax returns depend on an individual investor’s tax situation and may differ
from those shown, and the after-tax returns shown are not relevant to investors who hold their Fund shares through tax-deferred
arrangements, such as 401(k) plans or individual retirement accounts. After-tax returns are shown for Investor Class shares only,
and after-tax returns for Institutional Class shares will vary.
Returns
are presented in U.S. dollar terms.
|
| Performance Availability Website Address [Text] |
www.hennessyfunds.com
|
| Hennessy Large Cap Financial Fund |
|
| Prospectus [Line Items] |
|
| Bar Chart and Performance Table [Heading] |
Performance
Information
|
| Performance Narrative [Text Block] |
The
following performance information provides some indication of the risks of investing in the Fund by showing changes in its performance
from year to year and how the Fund’s average annual returns for one, five, and ten years compare with those of an index
that reflects a broad measure of market performance, the Russell 1000® Index, as well as an additional index that
reflects the market sector in which the Fund invests, the Russell 1000® Index Financials. For additional information
on these indices, please see “Descriptions of Indices” on page 68 of this Prospectus. The Fund’s past performance
(before and after taxes) is not necessarily an indication of future performance. Performance may be higher or lower in the future.
Updated performance information is available at www.hennessyfunds.com.
|
| Performance Past Does Not Indicate Future [Text] |
The Fund’s past performance
(before and after taxes) is not necessarily an indication of future performance.
|
| Performance Information Illustrates Variability of Returns [Text] |
The
following performance information provides some indication of the risks of investing in the Fund by showing changes in its performance
from year to year and how the Fund’s average annual returns for one, five, and ten years compare with those of an index
that reflects a broad measure of market performance, the Russell 1000® Index, as well as an additional index that
reflects the market sector in which the Fund invests, the Russell 1000® Index Financials.
|
| Performance Additional Market Index [Text] |
We
use the Russell 1000® Index Financials as an additional index because it reflects the performance of investments
similar to those of the Fund.
|
| Bar Chart [Heading] |
CALENDAR
YEAR TOTAL RETURNS OF INVESTOR SHARES
|
| Bar Chart [Table] |
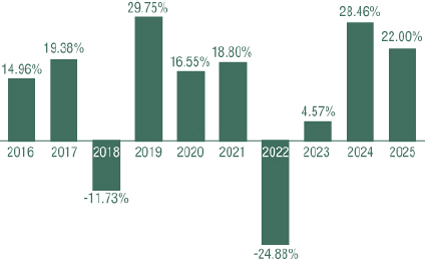
| Years |
Returns |
| 2016 |
14.96 |
| 2017 |
19.38 |
| 2018 |
-11.73 |
| 2019 |
29.75 |
| 2020 |
16.55 |
| 2021 |
18.80 |
| 2022 |
-24.88 |
| 2023 |
4.57 |
| 2024 |
28.46 |
| 2025 |
22.00 |
|
| Bar Chart Closing [Text Block] |
For
the period shown in the bar chart, the Fund’s highest quarterly return was 22.26% for the quarter ended December 31, 2016,
and the lowest quarterly return was -25.61% for the quarter ended March 31, 2020.
Performance
of the Fund’s Institutional Class shares differs from that of the Fund’s Investor Class shares because the share classes
have different expenses and inception dates.
|
| Highest Quarterly Return, Label [Optional Text] |
highest quarterly return
|
| Highest Quarterly Return |
22.26%
|
| Highest Quarterly Return, Date |
Dec. 31, 2016
|
| Lowest Quarterly Return, Label [Optional Text] |
lowest quarterly return
|
| Lowest Quarterly Return |
(25.61%)
|
| Lowest Quarterly Return, Date |
Mar. 31, 2020
|
| Performance Table Heading |
Average
Annual Total Returns
(for
the periods ended December 31, 2025)
|
| Performance Table Uses Highest Federal Rate |
The
after-tax returns are calculated using the highest historical individual stated federal marginal income tax rates and do not reflect
the impact of state and local taxes.
|
| Performance Table Not Relevant to Tax Deferred |
Actual after-tax returns depend on an individual investor’s tax situation and may differ
from those shown, and the after-tax returns shown are not relevant to investors who hold their Fund shares through tax-deferred
arrangements, such as 401(k) plans or individual retirement accounts.
|
| Performance [Table] |
| |
One |
Five |
Ten |
| |
Year |
Years |
Years |
| Hennessy
Large Cap Financial |
|
|
|
| Fund
– Investor Shares |
|
|
|
| Return
before taxes |
22.00% |
7.90% |
10.36% |
| Return
after taxes |
|
|
|
| on
distributions |
19.85% |
6.80% |
9.59% |
| Return
after taxes |
|
|
|
| on
distributions and |
|
|
|
| sale
of Fund shares |
14.53% |
6.05% |
8.40% |
| Hennessy
Large Cap Financial |
|
|
|
| Fund
– Institutional Shares |
|
|
|
| Return
before taxes |
22.41% |
8.26% |
10.75% |
| Russell
1000® Index Financials |
|
|
|
| (reflects
no deduction for |
|
|
|
| fees,
expenses, or taxes) |
18.65% |
16.79% |
15.03% |
| Russell
1000® Index |
|
|
|
| (reflects
no deduction for |
|
|
|
| fees,
expenses, or taxes) |
17.37% |
13.59% |
14.59% |
|
| Performance Table One Class of after Tax Shown [Text] |
After-tax returns are shown for Investor Class shares only,
and after-tax returns for Institutional Class shares will vary.
|
| Index No Deduction for Fees, Expenses, or Taxes [Text] |
(reflects
no deduction for fees,
expenses, or taxes)
|
| Performance Table Closing [Text Block] |
We
use the Russell 1000® Index Financials as an additional index because it reflects the performance of investments
similar to those of the Fund.
The
after-tax returns are calculated using the highest historical individual stated federal marginal income tax rates and do not reflect
the impact of state and local taxes. Actual after-tax returns depend on an individual investor’s tax situation and may differ
from those shown, and the after-tax returns shown are not relevant to investors who hold their Fund shares through tax-deferred
arrangements, such as 401(k) plans or individual retirement accounts. After-tax returns are shown for Investor Class shares only,
and after-tax returns for Institutional Class shares will vary.
|
| Performance Availability Website Address [Text] |
www.hennessyfunds.com
|
| Hennessy Small Cap Financial Fund |
|
| Prospectus [Line Items] |
|
| Bar Chart and Performance Table [Heading] |
Performance
Information
|
| Performance Narrative [Text Block] |
The
following performance information provides some indication of the risks of investing in the Fund by showing changes in its performance
from year to year and how the Fund’s average annual returns for one, five, and ten years compare with those of an index
that reflects a broad measure of market performance, the Russell 2000® Index, as well as an additional index that
reflects the market sector in which the Fund invests, the Russell 2000® Index Financials. For additional information
on these indices, please see “Descriptions of Indices” on page 68 of this Prospectus. The Fund’s past performance
(before and after taxes) is not necessarily an indication of future performance. Performance may be higher or lower in the future.
Updated performance information is available at www.hennessyfunds.com.
|
| Performance Past Does Not Indicate Future [Text] |
The Fund’s past performance
(before and after taxes) is not necessarily an indication of future performance.
|
| Performance Information Illustrates Variability of Returns [Text] |
The
following performance information provides some indication of the risks of investing in the Fund by showing changes in its performance
from year to year and how the Fund’s average annual returns for one, five, and ten years compare with those of an index
that reflects a broad measure of market performance, the Russell 2000® Index, as well as an additional index that
reflects the market sector in which the Fund invests, the Russell 2000® Index Financials.
|
| Performance Additional Market Index [Text] |
We
use the Russell 2000® Index Financials as an additional index because it reflects the performance of investments similar to those of the
Fund.
|
| Bar Chart [Heading] |
CALENDAR
YEAR TOTAL RETURNS OF INVESTOR SHARES
|
| Bar Chart [Table] |
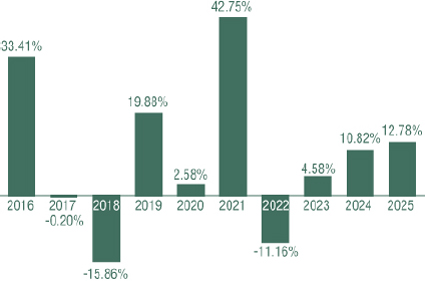
| Years |
Returns |
| 2016 |
33.41 |
| 2017 |
-0.20 |
| 2018 |
-15.86 |
| 2019 |
19.88 |
| 2020 |
2.58 |
| 2021 |
42.75 |
| 2022 |
-11.16 |
| 2023 |
4.58 |
| 2024 |
10.82 |
| 2025 |
12.78 |
|
| Bar Chart Closing [Text Block] |
For
the period shown in the bar chart, the Fund’s highest quarterly return was 57.27% for the quarter ended December 31, 2020,
and the lowest quarterly return was -38.05% for the quarter ended March 31, 2020.
Performance
of the Fund’s Institutional Class shares differs from that of the Fund’s Investor Class shares because the share classes
have different expenses and inception dates.
|
| Highest Quarterly Return, Label [Optional Text] |
highest quarterly return
|
| Highest Quarterly Return |
57.27%
|
| Highest Quarterly Return, Date |
Dec. 31, 2020
|
| Lowest Quarterly Return, Label [Optional Text] |
lowest quarterly return
|
| Lowest Quarterly Return |
(38.05%)
|
| Lowest Quarterly Return, Date |
Mar. 31, 2020
|
| Performance Table Heading |
Average
Annual Total Returns
(for
the periods ended December 31, 2025)
|
| Performance Table Uses Highest Federal Rate |
The
after-tax returns are calculated using the highest historical individual stated federal marginal income tax rates and do not reflect
the impact of state and local taxes.
|
| Performance Table Not Relevant to Tax Deferred |
Actual after-tax returns depend on an individual investor’s tax situation and may differ
from those shown, and the after-tax returns shown are not relevant to investors who hold their Fund shares through tax-deferred
arrangements, such as 401(k) plans or individual retirement accounts.
|
| Performance [Table] |
| |
One |
Five |
Ten |
| |
Year |
Years |
Years |
| Hennessy
Small Cap Financial |
|
|
|
| Fund
– Investor Shares |
|
|
|
| Return
before taxes |
12.78% |
10.64% |
8.61% |
| Return
after taxes |
|
|
|
| on
distributions |
10.13% |
9.10% |
7.08% |
| Return
after taxes |
|
|
|
| on
distributions and |
|
|
|
| sale
of Fund shares |
9.49% |
8.32% |
6.70% |
| Hennessy
Small Cap Financial |
|
|
|
| Fund
– Institutional Shares |
|
|
|
| Return
before taxes |
13.17% |
11.03% |
8.99% |
| Russell
2000® Index Financials |
|
|
|
| (reflects
no deduction for |
|
|
|
| fees,
expenses, or taxes) |
7.85% |
9.16% |
8.85% |
| Russell
2000® Index |
|
|
|
| (reflects
no deduction for |
|
|
|
| fees,
expenses, or taxes) |
12.81% |
6.09% |
9.62% |
|
| Performance Table One Class of after Tax Shown [Text] |
After-tax returns are shown for Investor Class shares only,
and after-tax returns for Institutional Class shares will vary.
|
| Index No Deduction for Fees, Expenses, or Taxes [Text] |
(reflects
no deduction for fees,
expenses, or taxes)
|
| Performance Table Closing [Text Block] |
We
use the Russell 2000® Index Financials as an additional index because it reflects the performance of investments similar to those of the
Fund.
The
after-tax returns are calculated using the highest historical individual stated federal marginal income tax rates and do not reflect
the impact of state and local taxes. Actual after-tax returns depend on an individual investor’s tax situation and may differ
from those shown, and the after-tax returns shown are not relevant to investors who hold their Fund shares through tax-deferred
arrangements, such as 401(k) plans or individual retirement accounts. After-tax returns are shown for Investor Class shares only,
and after-tax returns for Institutional Class shares will vary.
|
| Performance Availability Website Address [Text] |
www.hennessyfunds.com
|
| Hennessy Technology Fund |
|
| Prospectus [Line Items] |
|
| Bar Chart and Performance Table [Heading] |
Performance
Information
|
| Performance Narrative [Text Block] |
The
following performance information provides some indication of the risks of investing in the Fund by showing changes in its performance
from year to year and how the Fund’s average annual returns for one, five, and ten years compare with those of indices that
reflect broad measures of market performance, the Nasdaq Composite Index and the S&P 500® Index. For additional
information on these indices, please see “Descriptions of Indices” on page 68 of this Prospectus. The Fund’s
past performance (before and after taxes) is not necessarily an indication of future performance. Performance may be higher or
lower in the future. Updated performance information is available at www.hennessyfunds.com.
|
| Performance Past Does Not Indicate Future [Text] |
The Fund’s
past performance (before and after taxes) is not necessarily an indication of future performance.
|
| Performance Information Illustrates Variability of Returns [Text] |
The
following performance information provides some indication of the risks of investing in the Fund by showing changes in its performance
from year to year and how the Fund’s average annual returns for one, five, and ten years compare with those of indices that
reflect broad measures of market performance, the Nasdaq Composite Index and the S&P 500® Index.
|
| Bar Chart [Heading] |
CALENDAR
YEAR TOTAL RETURNS OF INVESTOR SHARES
|
| Bar Chart [Table] |
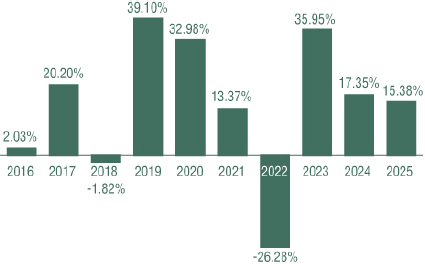
| Years |
Returns |
| 2016 |
2.03 |
| 2017 |
20.20 |
| 2018 |
-1.82 |
| 2019 |
39.10 |
| 2020 |
32.98 |
| 2021 |
13.37 |
| 2022 |
-26.28 |
| 2023 |
35.95 |
| 2024 |
17.35 |
| 2025 |
15.38 |
|
| Bar Chart Closing [Text Block] |
For
the period shown in the bar chart, the Fund’s highest quarterly return was 26.01% for the quarter ended June 30, 2020, and
the lowest quarterly return was -22.30% for the quarter ended March 31, 2020.
Performance
of the Fund’s Institutional Class shares differs from that of the Fund’s Investor Class shares because the share classes
have different expenses and inception dates.
|
| Highest Quarterly Return, Label [Optional Text] |
highest quarterly return
|
| Highest Quarterly Return |
26.01%
|
| Highest Quarterly Return, Date |
Jun. 30, 2020
|
| Lowest Quarterly Return, Label [Optional Text] |
lowest quarterly return
|
| Lowest Quarterly Return |
(22.30%)
|
| Lowest Quarterly Return, Date |
Mar. 31, 2020
|
| Performance Table Heading |
Average
Annual Total Returns
(for
the periods ended December 31, 2025)
|
| Performance Table Uses Highest Federal Rate |
The
after-tax returns are calculated using the highest historical individual stated federal marginal income tax rates and do not reflect
the impact of state and local taxes.
|
| Performance Table Not Relevant to Tax Deferred |
Actual after-tax returns depend on an individual investor’s tax situation and may differ
from those shown, and the after-tax returns shown are not relevant to investors who hold their Fund shares through tax-deferred
arrangements, such as 401(k) plans or individual retirement accounts.
|
| Performance Table Explanation after Tax Higher |
The Fund’s “return after taxes on distributions and
sale of Fund shares” may be higher than its “return after taxes on distributions” because it may include a tax
benefit due to the capital losses generated by the sale of Fund shares.
|
| Performance [Table] |
| |
One |
Five |
Ten |
| |
Year |
Years |
Years |
| Hennessy
Technology Fund – |
|
|
|
| Investor
Shares |
|
|
|
| Return
before taxes |
15.38% |
9.00% |
13.11% |
| Return
after taxes |
|
|
|
| on
distributions |
9.45% |
5.79% |
10.30% |
| Return
after taxes |
|
|
|
| on
distributions and |
|
|
|
| sale
of Fund shares |
11.39% |
6.08% |
9.79% |
| Hennessy
Technology Fund – |
|
|
|
| Institutional
Shares |
|
|
|
| Return
before taxes |
15.61% |
9.27% |
13.40% |
| Nasdaq
Composite Index |
|
|
|
| (reflects
no deduction for |
|
|
|
| fees,
expenses, or taxes) |
21.14% |
13.35% |
17.66% |
| S&P
500® Index |
|
|
|
| (reflects
no deduction for |
|
|
|
| fees,
expenses, or taxes) |
17.88% |
14.42% |
14.82% |
|
| Performance Table One Class of after Tax Shown [Text] |
After-tax returns are shown for Investor Class shares only,
and after-tax returns for Institutional Class shares will vary.
|
| Index No Deduction for Fees, Expenses, or Taxes [Text] |
(reflects
no deduction for fees,
expenses, or taxes)
|
| Performance Table Closing [Text Block] |
The
after-tax returns are calculated using the highest historical individual stated federal marginal income tax rates and do not reflect
the impact of state and local taxes. Actual after-tax returns depend on an individual investor’s tax situation and may differ
from those shown, and the after-tax returns shown are not relevant to investors who hold their Fund shares through tax-deferred
arrangements, such as 401(k) plans or individual retirement accounts. After-tax returns are shown for Investor Class shares only,
and after-tax returns for Institutional Class shares will vary. The Fund’s “return after taxes on distributions and
sale of Fund shares” may be higher than its “return after taxes on distributions” because it may include a tax
benefit due to the capital losses generated by the sale of Fund shares.
|
| Performance Availability Website Address [Text] |
www.hennessyfunds.com
|
| Hennessy Sustainable ETF |
|
| Prospectus [Line Items] |
|
| Bar Chart and Performance Table [Heading] |
Performance
Information
|
| Performance Narrative [Text Block] |
The following performance information provides
some indication of the risks of investing in the Fund by showing changes in its performance from year to year and how the Fund’s
average annual returns for one year and since inception compare with those of indices that reflect broad measures of market performance,
the S&P 500® Equal Weight Index and the S&P 500®
Index. The Fund is the successor to the Stance Equity ESG Large Cap Core ETF, a series of The RBB Fund, Inc. (the
“Predecessor Fund”), pursuant to a reorganization that took place after the close of business on December 22, 2022.
The performance information provided for the periods on or prior to December 22, 2022, is historical information for the Predecessor
Fund. The Predecessor Fund had a substantially similar investment objective and investment strategy as the Fund. The Fund’s
past performance (before and after taxes) is not necessarily an indication of future performance. Performance may be higher or
lower in the future. Updated performance information is available at www.hennessyetfs.com.
|
| Performance Past Does Not Indicate Future [Text] |
The Fund’s
past performance (before and after taxes) is not necessarily an indication of future performance.
|
| Performance Information Illustrates Variability of Returns [Text] |
The following performance information provides
some indication of the risks of investing in the Fund by showing changes in its performance from year to year and how the Fund’s
average annual returns for one year and since inception compare with those of indices that reflect broad measures of market performance,
the S&P 500® Equal Weight Index and the S&P 500®
Index.
|
| Bar Chart [Heading] |
CALENDAR YEAR TOTAL RETURNS
|
| Bar Chart [Table] |
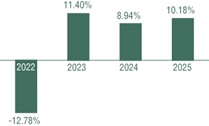
| Years |
Returns |
| 2022 |
-12.78 |
| 2023 |
11.40 |
| 2024 |
8.94 |
| 2025 |
10.18 |
|
| Bar Chart Closing [Text Block] |
For
the period shown in the bar chart, the Fund’s highest quarterly return was 11.65% for the quarter ended December 31, 2023,
and the lowest quarterly return was -10.81% for the quarter ended June 30, 2022.
|
| Highest Quarterly Return, Label [Optional Text] |
highest quarterly return
|
| Highest Quarterly Return |
11.65%
|
| Highest Quarterly Return, Date |
Dec. 31, 2023
|
| Lowest Quarterly Return, Label [Optional Text] |
lowest quarterly return
|
| Lowest Quarterly Return |
(10.81%)
|
| Lowest Quarterly Return, Date |
Jun. 30, 2022
|
| Performance Table Heading |
AVERAGE ANNUAL TOTAL RETURNS
(for the periods ended December 31, 2025)
|
| Performance Table Uses Highest Federal Rate |
The after-tax returns
are calculated using the highest historical individual stated federal income tax rates and do not reflect the impact of state
and local taxes.
|
| Performance Table Not Relevant to Tax Deferred |
Actual after-tax returns depend on an individual investor’s tax situation and may differ from those shown,
and the after-tax returns shown are not relevant to investors who hold their Fund shares through tax-deferred arrangements, such
as 401(k) plans or individual retirement accounts.
|
| Performance [Table] |
| |
One |
Since
Inception |
| |
Year |
(March
15, 2021) |
| Hennessy
Sustainable ETF |
|
|
| Return
before taxes |
10.18% |
6.69% |
| Return
after taxes |
|
|
| on
distributions |
9.91% |
6.53% |
| Return
after taxes on distributions |
|
|
| and
sale of Fund shares |
6.21% |
5.23% |
| S&P
500® Equal Weight Index |
|
|
| (reflects
no deduction for |
|
|
| fees,
expenses, or taxes) |
11.43% |
8.34% |
| S&P
500® Index |
|
|
| (reflects
no deduction for |
|
|
| fees,
expenses, or taxes) |
17.88% |
13.68% |
|
| Index No Deduction for Fees, Expenses, or Taxes [Text] |
(reflects
no deduction for fees,
expenses, or taxes)
|
| Performance Table Closing [Text Block] |
The after-tax returns
are calculated using the highest historical individual stated federal income tax rates and do not reflect the impact of state
and local taxes. Actual after-tax returns depend on an individual investor’s tax situation and may differ from those shown,
and the after-tax returns shown are not relevant to investors who hold their Fund shares through tax-deferred arrangements, such
as 401(k) plans or individual retirement accounts.
|
| Performance Availability Website Address [Text] |
www.hennessyetfs.com
|