Pay vs Performance Disclosure
Dec. 31, 2025
USD ($)
Dec. 31, 2024
USD ($)
Dec. 31, 2023
USD ($)
Dec. 31, 2022
USD ($)
Dec. 31, 2021
USD ($)
Pay versus performance
As required by Section 953(a) of the Dodd-Frank Wall Street Reform and Consumer Protection Act and Item 402(v) of Regulation
S-K,
we are providing the following information regarding certain executive pay and performance. The table below shows, for each applicable fiscal year, total compensation (“Summary Compensation Total” or “SCT Total”) as reported in the summary compensation table and “compensation actually paid” (or “CAP”) for our principal executive officer (“PEO”) and as an average of all of our other named executive officers for that year (“Non-PEO
NEOs”). Both SCT Total pay and CAP are calculated in accordance with the requirements of Regulation S-K
and may differ substantially from the manner in which the Compensation Committee makes decisions regarding executive pay. See “Compensation Discussion and Analysis” for a discussion of the Compensation Committee’s decisions regarding the compensation of our named executive officers. The table below also shows (i) the company’s cumulative total shareholder return (or “TSR”), (ii) the TSR of the S&P 1500 Steel
Sub-Industry
Index, which we have used as our peer group for purposes of disclosure in the table below, (iii) the company’s net income for the applicable fiscal year, and (iv) the company’s performance with respect to a “company-selected measure” (or “CSM”) which in our assessment represents the single most important financial performance metric used to link compensation actually paid to our named executive officers for the most recently completed fiscal year to the company’s performance. We selected Adjusted EBITDA as the CSM required for disclosure in the table below. Pay versus Performance |
||||||||||||||||||||||||||||||||
Year |
Summary Compensation Table Total for PEO |
Compensation Actually Paid to PEO (1) |
Average Summary Compensation Table Total for Non-PEO NEOs |
Average Compensation Actually Paid to non-PEO NEOs (2) |
Value of Initial Fixed $100 Investment Based On: |
Net Income (4) |
Company Selected Measure Adjusted EBITDA (5) |
|||||||||||||||||||||||||
TSR (3) |
1500 sub-steel index TSR (3) |
|||||||||||||||||||||||||||||||
2025 |
$ | 5,863,348 | $ | 5,584,295 | $ | 1,739,141 | $ | 1,764,830 | $ | 367.45 | $ | 320.74 | $ | (1,200,000 | ) | $ | 75,600,000 | |||||||||||||||
2024 |
$ | 4,260,359 | $ | (3,575,855 | ) | $ | 1,137,930 | $ | (945,923 | ) | $ | 179.77 | $ | 233.85 | $ | 1,300,000 | $ | 77,700,000 | ||||||||||||||
2023 |
$ | 6,973,856 | $ | 13,906,875 | $ | 2,311,872 | $ | 3,017,016 | $ | 298.35 | $ | 279.40 | $ | 69,400,000 | $ | 200,300,000 | ||||||||||||||||
2022 |
$ | 4,604,190 | $ | 6,379,938 | $ | 1,283,726 | $ | 1,528,508 | $ | 231.17 | $ | 204.07 | $ | 65,100,000 | $ | 172,200,000 | ||||||||||||||||
2021 |
$ | 7,161,838 | $ | 19,694,478 | $ | 1,306,702 | $ | 2,557,052 | $ | 209.92 | $ | 171.34 | $ | 171,000,000 | $ | 245,900,000 | ||||||||||||||||
(1) |
In accordance with the requirements of Item 402(v) of Regulation S-K, CAP is calculated by beginning with the SCT Total as reported in the Summary Compensation Table (the “SCT”) for the applicable fiscal year, then (a) subtracting the grant date fair value of awards reported in the Stock Awards column of the SCT for such year, (b) subtracting the grant date fair value of awards reported in the Option Awards column of the SCT for such year, (c) subtracting the aggregate change in the actuarial present value of the accumulated benefit under defined benefit plans reported in the Change in Pension Value and Nonqualified Deferred Compensation Earnings column of the SCT for such year, (d) adding the change in fair value of stock and option awards for the applicable fiscal year (as such changes are described below for 2025) and (e) adding the service cost and prior service cost for all defined benefit plans for the applicable fiscal year (as such costs are described below for 2025). |
For purposes of determining CAP, fair value amounts for Stock Awards and Option Awards were calculated in a manner consistent with the fair value methodology used to account for share-based payments in our financial statements under GAAP, including the use of a lattice valuation model, the Monte Carlo simulation, to value performance shares. The service cost and prior service cost for defined benefit plans were calculated using the same methodology as used for our financial statements under GAAP. The individual serving as PEO during the years covered by the table did not participate in any defined benefit pension plan sponsored by the company. |
For 2025, 2024, 2023, 2022 and 2021, Michael S. Williams is included in the table as PEO. |
The following is a reconciliation of SCT Total and CAP for the PEO for 2025. Please note that, while similar adjustment information was provided in our 2025 proxy statement for 2024, in our 2024 proxy statement for 2023 and in our 2023 proxy statement for years 2021 and 2022, under applicable SEC guidance repeating such adjustment information is not required in this proxy statement because it is not material to our shareholders’ understanding of the information reported in the table above for 2025 or the relationships disclosures provided below. |
PEO Summary: Reconciliation of SCT Total and CAP |
||||||||||||||||
Year |
SCT Total |
Subtract Grant Date Fair Value of Stock Awards and Option Awards as Disclosed in the SCT |
Add Change in Fair Value of Stock Awards and Option Awards(i) |
CAP |
||||||||||||
2025 |
$ | 5,863,348 | $ | (3,865,156 | ) | $ | 3,586,103 | $ | 5,584,295 | |||||||
The total amount included in the table above as the grant date fair value of stock awards and option awards as disclosed in the SCT reflects the grant date fair value of stock awards as the company did not issue option awards in 2025. |
(i) PEO Detail: Change in Fair Value of Stock and Option Awards |
||||||||||||||||||||||||||||
Year |
Year-End FairValue of Stock Awards and Option Awards Granted in Covered Fiscal Year that Remained Unvested at the End of that Fiscal Year |
Vesting Date Fair Value of Stock Awards and Option Awards Granted in Covered Fiscal Year that Vested During that Fiscal Year |
Increase or Decrease in Fair Value (from Prior Year End to Covered Year End) for Stock Awards and Option Awards Granted in Prior Years that Remained Unvested at the End of the Covered Fiscal Year |
Increase or Decrease in Fair Value (from Prior Year End to Vesting Date) of Stock Awards and Option Awards Granted in Prior Years that Vested During the Covered Fiscal Year |
Adjustments for Stock Awards and Option Awards Granted in Prior Years that Failed to Meet Vesting Conditions During the Covered Fiscal Year |
Value of Dividends or other Earnings Paid or Accrued on Stock Awards During the Covered Fiscal Year and not Otherwise Reflected in CAP |
Total Change in Fair Value of Stock Awards and Option Awards Included in CAP |
|||||||||||||||||||||
2025 |
$ | 3,804,144 | $ | 0 | $ | (59,920 | ) | $ | (158,121 | ) | $ | 0 | $ | 0 | $ | 3,586,103 | ||||||||||||
(2) |
CAP for the Non-PEO NEOs was calculated in the same manner as described in footnote 1 above for the PEO, except the amounts were averaged for each fiscal year. The Non-PEO NEOs whose average SCT Total and average CAP amounts are included in the table are: |
2025: Kristopher R. Westbrooks, John M. Zaranec III, Kristine C. Syrvalin and Kevin A. Raketich
2022, 2023 and 2024: Kristopher R. Westbrooks, Kristine C. Syrvalin and Kevin A. Raketich
2021: Kristopher R. Westbrooks, Kristine C. Syrvalin, Kevin A. Raketich, William P. Bryan and Thomas D. Moline
The following is a reconciliation of average SCT Total and average CAP for the Non-PEO NEOs for 2025. Please note that, while similar adjustment information was provided in our 2025 proxy statement for 2024, in our 2024 proxy statement for 2023 and in our 2023 proxy statement for years 2021 and 2022, under applicable SEC guidance repeating such adjustment information is not required in this proxy statement because it is not material to our shareholders’ understanding of the information reported in the table above for 2025 or the relationships disclosures provided below. |
Non-PEO NEOs Summary: Reconciliation of SCT Total and CAP |
||||||||||||||||||||||||
Year |
Average SCT Total |
Subtract Average Grant Date Fair Value of Stock Awards and Option Awards as Disclosed in the SCT |
Subtract Average Change in Pension Value as Disclosed in the SCT |
Add Average Change in Fair Value of Stock Awards and Option Awards(i) |
Add Average Service Cost and Prior Service Cost for Pension Plans |
Average CAP |
||||||||||||||||||
2025 |
$ | 1,739,141 | $ | (879,202 | ) | $ | (4,187 | ) | $ | 909,078 | $ | 0 | $ | 1,764,830 | ||||||||||
The total amount included in the table above as the grant date fair value of stock awards and option awards as disclosed in the SCT reflects the grant date fair value of stock awards as the company did not issue option awards in 2025. |
(i) Non-PEO NEOs Detail: Average Change in Fair Value of Stock and Option Awards |
||||||||||||||||||||||||||||
Year |
Year-End FairValue of Stock Awards and Option Awards Granted in Covered Fiscal Year that Remained Unvested at the End of that Fiscal Year |
Vesting Date Fair Value of Stock Awards and Option Awards Granted in Covered Fiscal Year that Vested During that Fiscal Year |
Increase or Decrease in Fair Value (from Prior Year End to Covered Year End) for Stock Awards and Option Awards Granted in Prior Years that Remained Unvested at the End of the Covered Fiscal Year |
Increase or Decrease in Fair Value (from Prior Year End to Vesting Date) of Stock Awards and Option Awards Granted in Prior Years that Vested During the Covered Fiscal Year |
Adjustments for Stock Awards and Option Awards Granted in Prior Years that Failed to Meet Vesting Conditions During the Covered Fiscal Year |
Value of Dividends or other Earnings Paid or Accrued on Stock Awards During the Covered Fiscal Year and not Otherwise Reflected in CAP |
Total Change in Fair Value of Stock Awards and Option Awards Included in CAP |
|||||||||||||||||||||
2025 |
$ | 921,191 | $ | 0 | $ | 10,832 | $ | (22,945 | ) | $ | 0 | $ | 0 | $ | 909,078 | |||||||||||||
(3) |
Our TSR represents the cumulative investment return of an initial fixed $100 investment in the company’s common stock on December 31, 2020, assuming reinvestment of all dividends. The company’s TSR as reflected in the table above may not be indicative of future performance. Peer group TSR represents the cumulative investment return of an initial fixed $100 investment in the S&P 1500 Steel Sub-Industry Index on December 31, 2020, assuming reinvestment of all dividends. |
(4) |
Represents net income determined in accordance with GAAP and as reported in our Form 10-K for the applicable fiscal year. |
(5) |
Represents our Adjusted EBITDA for the applicable fiscal year. We chose this measure of Adjusted EBITDA as the CSM for purposes of the table above because we determined that it was the most important financial performance measure (that is not otherwise required to be disclosed in the table) used to link compensation actually paid to our named executive officers for the most recently completed fiscal year to the company’s performance. Adjusted EBITDA is a non-GAAP measure. For more information about how we calculate Adjusted EBITDA, please see “Analysis of 2025 compensation — Annual incentive — 2025 APA decisions” in the Compensation discussion and analysis section of this proxy statement, as well as Appendix A to this proxy statement. |
(2) |
CAP for the Non-PEO NEOs was calculated in the same manner as described in footnote 1 above for the PEO, except the amounts were averaged for each fiscal year. The Non-PEO NEOs whose average SCT Total and average CAP amounts are included in the table are: |
2025: Kristopher R. Westbrooks, John M. Zaranec III, Kristine C. Syrvalin and Kevin A. Raketich
2022, 2023 and 2024: Kristopher R. Westbrooks, Kristine C. Syrvalin and Kevin A. Raketich
2021: Kristopher R. Westbrooks, Kristine C. Syrvalin, Kevin A. Raketich, William P. Bryan and Thomas D. Moline
Sub-Industry
Index on December 31, 2020, assuming reinvestment of all dividends.
The following is a reconciliation of SCT Total and CAP for the PEO for 2025. Please note that, while similar adjustment information was provided in our 2025 proxy statement for 2024, in our 2024 proxy statement for 2023 and in our 2023 proxy statement for years 2021 and 2022, under applicable SEC guidance repeating such adjustment information is not required in this proxy statement because it is not material to our shareholders’ understanding of the information reported in the table above for 2025 or the relationships disclosures provided below. |
PEO Summary: Reconciliation of SCT Total and CAP |
||||||||||||||||
Year |
SCT Total |
Subtract Grant Date Fair Value of Stock Awards and Option Awards as Disclosed in the SCT |
Add Change in Fair Value of Stock Awards and Option Awards(i) |
CAP |
||||||||||||
2025 |
$ | 5,863,348 | $ | (3,865,156 | ) | $ | 3,586,103 | $ | 5,584,295 | |||||||
The total amount included in the table above as the grant date fair value of stock awards and option awards as disclosed in the SCT reflects the grant date fair value of stock awards as the company did not issue option awards in 2025. |
(i) PEO Detail: Change in Fair Value of Stock and Option Awards |
||||||||||||||||||||||||||||
Year |
Year-End FairValue of Stock Awards and Option Awards Granted in Covered Fiscal Year that Remained Unvested at the End of that Fiscal Year |
Vesting Date Fair Value of Stock Awards and Option Awards Granted in Covered Fiscal Year that Vested During that Fiscal Year |
Increase or Decrease in Fair Value (from Prior Year End to Covered Year End) for Stock Awards and Option Awards Granted in Prior Years that Remained Unvested at the End of the Covered Fiscal Year |
Increase or Decrease in Fair Value (from Prior Year End to Vesting Date) of Stock Awards and Option Awards Granted in Prior Years that Vested During the Covered Fiscal Year |
Adjustments for Stock Awards and Option Awards Granted in Prior Years that Failed to Meet Vesting Conditions During the Covered Fiscal Year |
Value of Dividends or other Earnings Paid or Accrued on Stock Awards During the Covered Fiscal Year and not Otherwise Reflected in CAP |
Total Change in Fair Value of Stock Awards and Option Awards Included in CAP |
|||||||||||||||||||||
2025 |
$ | 3,804,144 | $ | 0 | $ | (59,920 | ) | $ | (158,121 | ) | $ | 0 | $ | 0 | $ | 3,586,103 | ||||||||||||
The following is a reconciliation of average SCT Total and average CAP for the Non-PEO NEOs for 2025. Please note that, while similar adjustment information was provided in our 2025 proxy statement for 2024, in our 2024 proxy statement for 2023 and in our 2023 proxy statement for years 2021 and 2022, under applicable SEC guidance repeating such adjustment information is not required in this proxy statement because it is not material to our shareholders’ understanding of the information reported in the table above for 2025 or the relationships disclosures provided below. |
Non-PEO NEOs Summary: Reconciliation of SCT Total and CAP |
||||||||||||||||||||||||
Year |
Average SCT Total |
Subtract Average Grant Date Fair Value of Stock Awards and Option Awards as Disclosed in the SCT |
Subtract Average Change in Pension Value as Disclosed in the SCT |
Add Average Change in Fair Value of Stock Awards and Option Awards(i) |
Add Average Service Cost and Prior Service Cost for Pension Plans |
Average CAP |
||||||||||||||||||
2025 |
$ | 1,739,141 | $ | (879,202 | ) | $ | (4,187 | ) | $ | 909,078 | $ | 0 | $ | 1,764,830 | ||||||||||
The total amount included in the table above as the grant date fair value of stock awards and option awards as disclosed in the SCT reflects the grant date fair value of stock awards as the company did not issue option awards in 2025. |
(i) Non-PEO NEOs Detail: Average Change in Fair Value of Stock and Option Awards |
||||||||||||||||||||||||||||
Year |
Year-End FairValue of Stock Awards and Option Awards Granted in Covered Fiscal Year that Remained Unvested at the End of that Fiscal Year |
Vesting Date Fair Value of Stock Awards and Option Awards Granted in Covered Fiscal Year that Vested During that Fiscal Year |
Increase or Decrease in Fair Value (from Prior Year End to Covered Year End) for Stock Awards and Option Awards Granted in Prior Years that Remained Unvested at the End of the Covered Fiscal Year |
Increase or Decrease in Fair Value (from Prior Year End to Vesting Date) of Stock Awards and Option Awards Granted in Prior Years that Vested During the Covered Fiscal Year |
Adjustments for Stock Awards and Option Awards Granted in Prior Years that Failed to Meet Vesting Conditions During the Covered Fiscal Year |
Value of Dividends or other Earnings Paid or Accrued on Stock Awards During the Covered Fiscal Year and not Otherwise Reflected in CAP |
Total Change in Fair Value of Stock Awards and Option Awards Included in CAP |
|||||||||||||||||||||
2025 |
$ | 921,191 | $ | 0 | $ | 10,832 | $ | (22,945 | ) | $ | 0 | $ | 0 | $ | 909,078 | |||||||||||||
(a) the relationship between (i) both CAP of the PEO and average CAP of the
Non-PEO
NEOs and (ii) the company’s TSR; and (b) the relationship between (i) the company’s TSR and (ii) the TSR of the peer group. 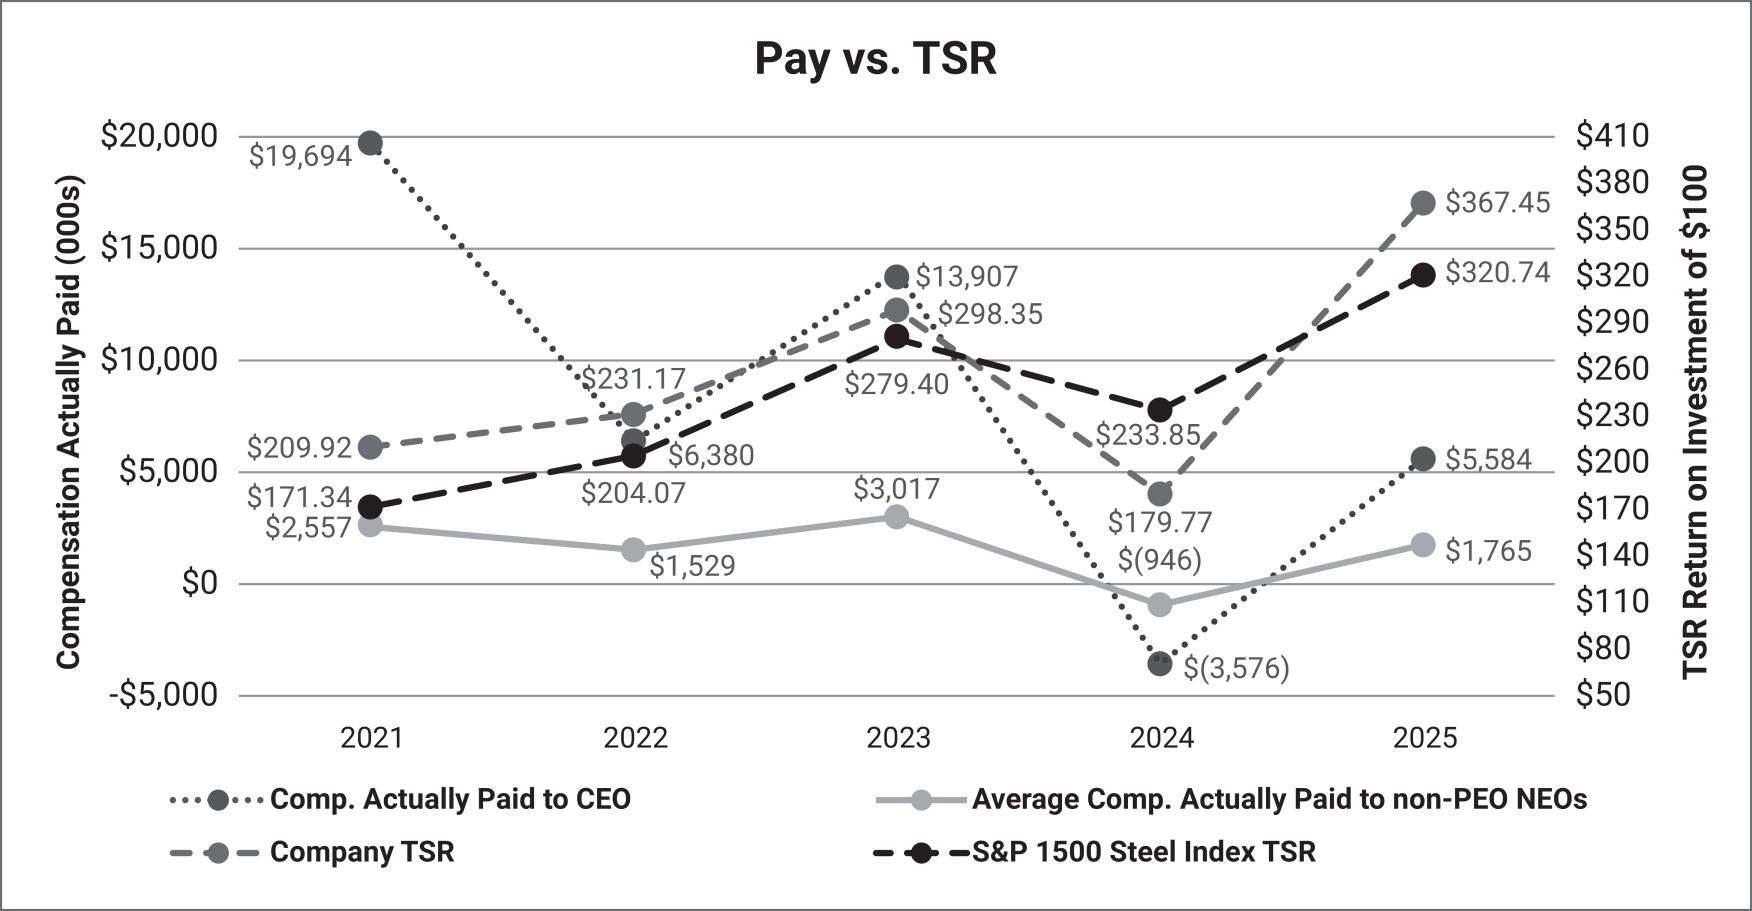
The following graph illustrates, for the period disclosed in the table above, the relationship between (a) both CAP of the PEO and average CAP of the
Non-PEO
NEOs, and (b) the company’s net income. 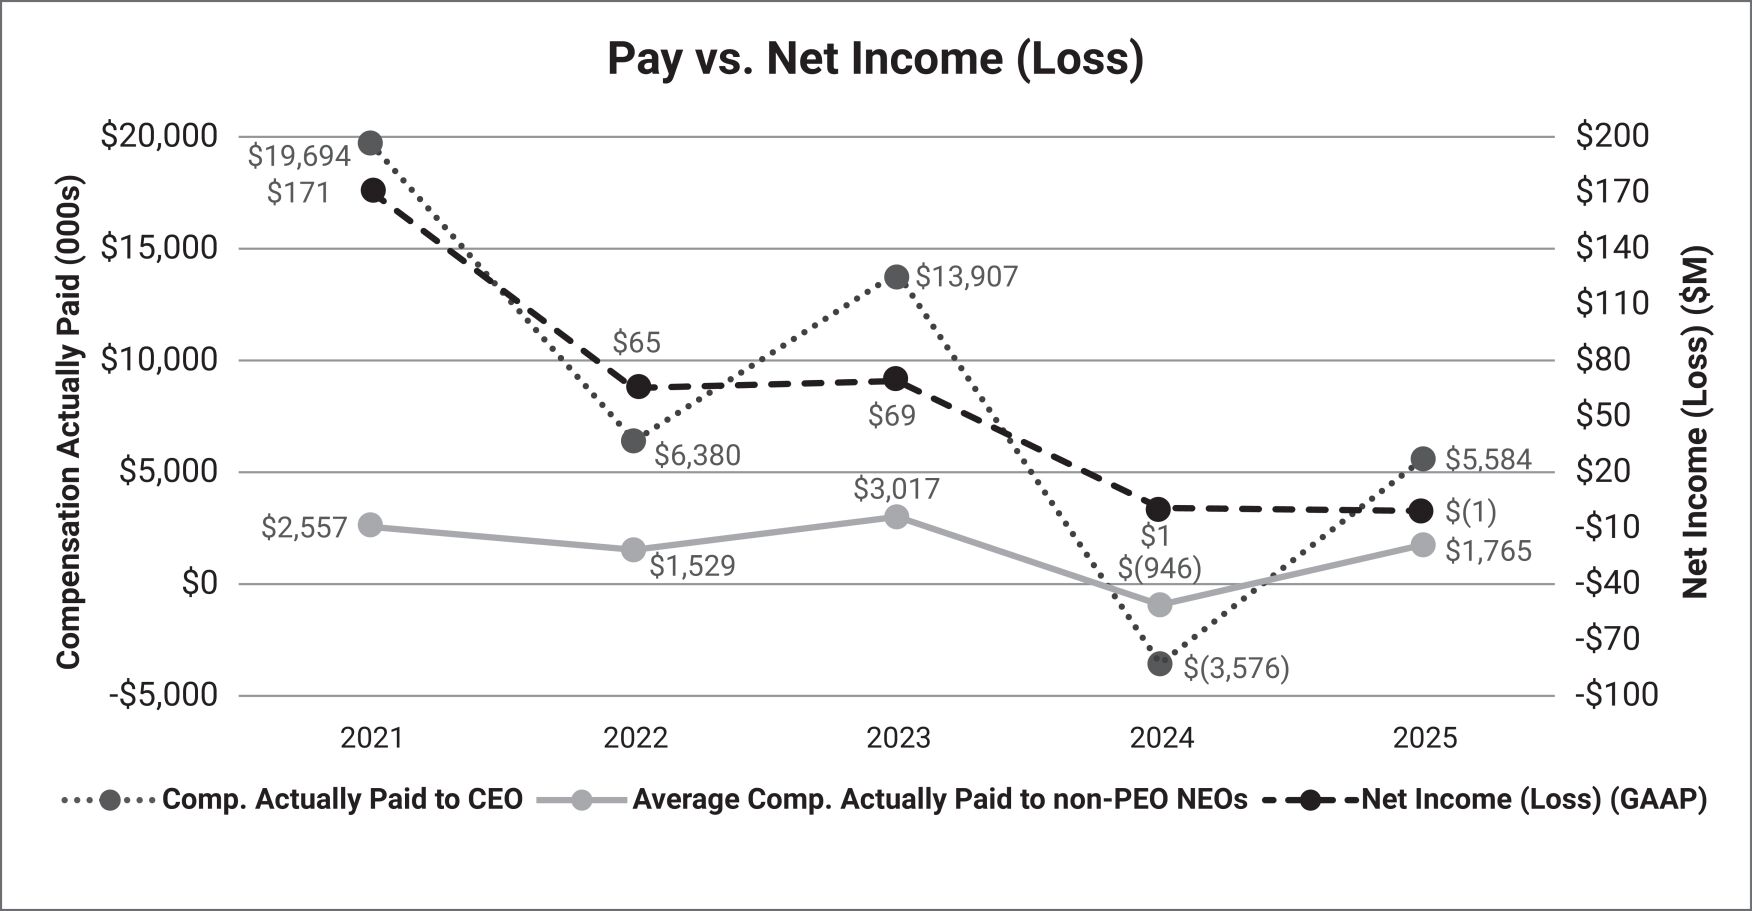
The following graph illustrates, for the period disclosed in the table above, the relationship between (a) both CAP of the PEO and average CAP of the
Non-PEO
NEOs, and (b) the CSM, Adjusted EBITDA. 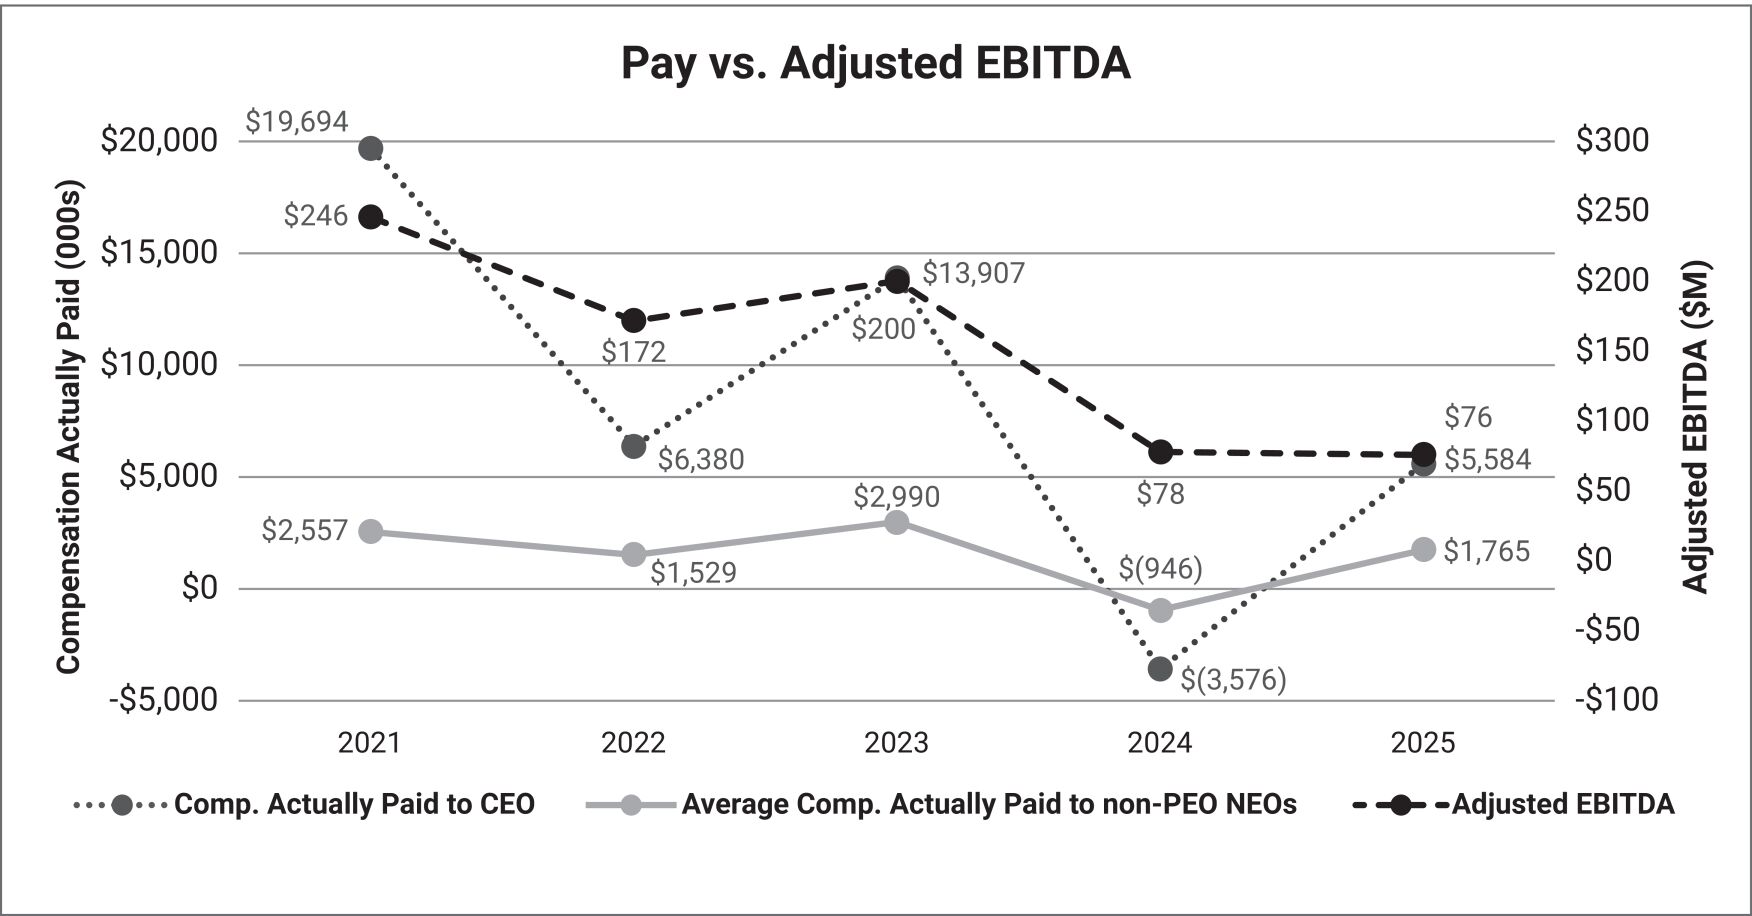
(a) the relationship between (i) both CAP of the PEO and average CAP of the
Non-PEO
NEOs and (ii) the company’s TSR; and (b) the relationship between (i) the company’s TSR and (ii) the TSR of the peer group. Most Important Performance Measures |
Financial measures |
Adjusted EBITDA |
Adjusted operating cash flow |
Relative total shareholder return |
Absolute stock price appreciation |
Non-financial measures |
Safety |
non-GAAP
measure. For more information about how we calculate Adjusted EBITDA, please see “Analysis of 2025 compensation — Annual incentive — 2025 APA decisions” in the Compensation discussion and analysis section of this proxy statement, as well as Appendix A to this proxy statement.