Pure in Millions
In the below Pay Versus Performance Table, we provide information about the compensation of our named executive officers (“NEOs”) and the results of certain financial performance measures for each of the last five fiscal years. The amounts shown below are calculated in accordance with Rule 402(v) of Regulation S-K. For further information concerning our pay-for-performance philosophy and how we align executive compensation with our performance, refer to our “Compensation Discussion and Analysis”.
| Year | Summary Compensation Table Total for PEO(1) ($) |
Compensation Actually Paid to PEO(2) ($) |
Average Summary Compensation Table Total for Non-PEO NEOs(1) ($) |
Average Compensation Actually Paid to Non-PEO NEOs(2) ($) |
Value of Initial Fixed $100 Investment Based on: | Net Income (in millions) ($) |
Company Selected Measure: ARR (in millions) ($) |
|
| TSR | Peer Group TSR | |||||||
| (a) | (b) | (c) | (d) | (e) | (f) | (g) | (h) | (i) |
| 2025 | 2,957,478 | 473,267 | 2,826,120 | 1,319,081 | 116.23 | 135.33 | 35.1 | 416.8 |
| 2024 | 2,971,548 | 16,004,952 | 2,375,243 | 10,994,120 | 134.78 | 125.95 | (29.0) | 327.0 |
| 2023 | 1,824,757 | 8,144,996 | 1,869,554 | 5,193,364 | 68.70 | 114.01 | (21.5) | 264.5 |
| 2022 | 2,202,003 | (3,454,799) | 1,539,835 | (938,597) | 34.39 | 68.13 | (38.7) | 214.7 |
| 2021 | 6,783,290 | (23,866,881) | 4,569,544 | (3,833,254) | 52.64 | 108.35 | (33.2) | 167.2 |
|
(1) |
Dr. Tianyi Jiang was our principal executive officer (“PEO”) for all of fiscal years 2021, 2022, 2023, 2024 and 2025. The other NEOs were Xunkai Gong, Brian Michael Brown and James Caci for all of fiscal years 2021, 2022, 2023, 2024 and 2025. |
|
(2) |
The following table shows the amounts deducted from and added to the Summary Compensation Table (“SCT”) total compensation to calculate “compensation actually paid” to our PEO and non-PEO NEOs in accordance with the pay versus performance rules. There were no equity awards that failed to meet vesting conditions during 2021, 2022, 2023, 2024 or 2025 for any of our NEOs. |
| Year | Named Executive Officer |
SCT Total for Covered Year ($) |
Subtract Stock Award and Option Award Value as Reported in SCT for Covered Year ($) |
Add Covered Year-End Value of Awards Granted in Covered Year and Outstanding and Unvested as of Covered Year-End ($) |
Change in Value as of Covered Year-End (as Compared to Prior Year-End) of Equity Awards Granted Prior to Covered Year and Outstanding and Unvested as of Covered Year-End ($) |
Change in Value as of Covered Year-End (as Compared to Prior Year-End) of Equity Awards Granted Prior to Covered Year that Vested During Covered Year ($) |
Compensation Actually Paid ($) |
| 2025 | PEO | 2,957,478 | 2,000,001 | 855,186 | (1,129,411) | (209,985) | 473,267 |
| Non-PEO NEOs | 2,826,120 | 1,933,326 | 1,402,841 | (804,364) | (172,189) | 1,319,081 | |
| 2024 | PEO | 2,971,548 | 999,997 | 6,092,322 | 6,083,967 | 1,857,112 | 16,004,952 |
| Non-PEO NEOs | 2,375,243 | 933,332 | 3,948,812 | 4,423,583 | 1,179,814 | 10,994,120 | |
| 2023 | PEO | 1,824,757 | 999,997 | 1,774,572 | 3,620,209 | 1,925,456 | 8,144,996 |
| Non-PEO NEOs | 1,869,554 | 1,133,333 | 2,079,554 | 1,634,493 | 743,096 | 5,193,364 | |
| 2022 | PEO | 2,202,003 | 1,500,003 | 786,354 | (3,564,175) | (1,378,978) | (3,454,799) |
| Non-PEO NEOs | 1,539,835 | 943,335 | 494,529 | (1,439,197) | (590,430) | (938,597) | |
| 2021 | PEO | 6,783,290 | 6,069,290 | 1,957,467 | (13,271,309) | (13,267,039) | (23,866,881) |
| Non-PEO NEOs | 4,569,544 | 4,042,342 | 1,413,726 | (4,924,198) | (849,984) | (3,833,254) |
| Year | Named Executive Officer |
SCT Total for Covered Year ($) |
Subtract Stock Award and Option Award Value as Reported in SCT for Covered Year ($) |
Add Covered Year-End Value of Awards Granted in Covered Year and Outstanding and Unvested as of Covered Year-End ($) |
Change in Value as of Covered Year-End (as Compared to Prior Year-End) of Equity Awards Granted Prior to Covered Year and Outstanding and Unvested as of Covered Year-End ($) |
Change in Value as of Covered Year-End (as Compared to Prior Year-End) of Equity Awards Granted Prior to Covered Year that Vested During Covered Year ($) |
Compensation Actually Paid ($) |
| 2025 | PEO | 2,957,478 | 2,000,001 | 855,186 | (1,129,411) | (209,985) | 473,267 |
| Non-PEO NEOs | 2,826,120 | 1,933,326 | 1,402,841 | (804,364) | (172,189) | 1,319,081 | |
| 2024 | PEO | 2,971,548 | 999,997 | 6,092,322 | 6,083,967 | 1,857,112 | 16,004,952 |
| Non-PEO NEOs | 2,375,243 | 933,332 | 3,948,812 | 4,423,583 | 1,179,814 | 10,994,120 | |
| 2023 | PEO | 1,824,757 | 999,997 | 1,774,572 | 3,620,209 | 1,925,456 | 8,144,996 |
| Non-PEO NEOs | 1,869,554 | 1,133,333 | 2,079,554 | 1,634,493 | 743,096 | 5,193,364 | |
| 2022 | PEO | 2,202,003 | 1,500,003 | 786,354 | (3,564,175) | (1,378,978) | (3,454,799) |
| Non-PEO NEOs | 1,539,835 | 943,335 | 494,529 | (1,439,197) | (590,430) | (938,597) | |
| 2021 | PEO | 6,783,290 | 6,069,290 | 1,957,467 | (13,271,309) | (13,267,039) | (23,866,881) |
| Non-PEO NEOs | 4,569,544 | 4,042,342 | 1,413,726 | (4,924,198) | (849,984) | (3,833,254) |
Relationship Between Compensation Actually Paid and TSR, Peer Group TSR, Net Income and ARR
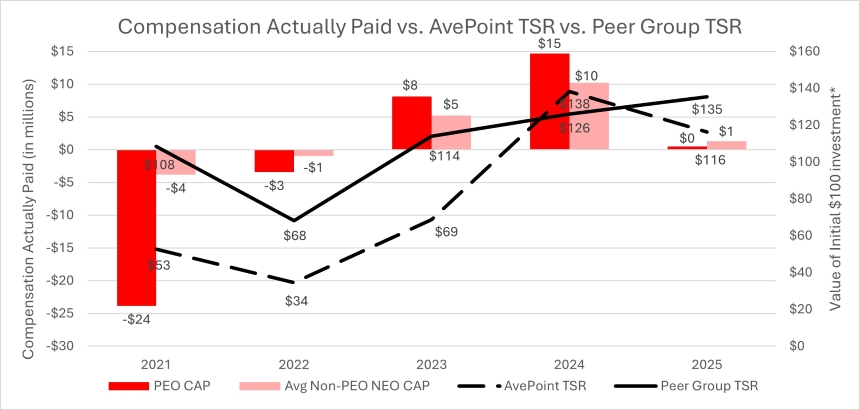
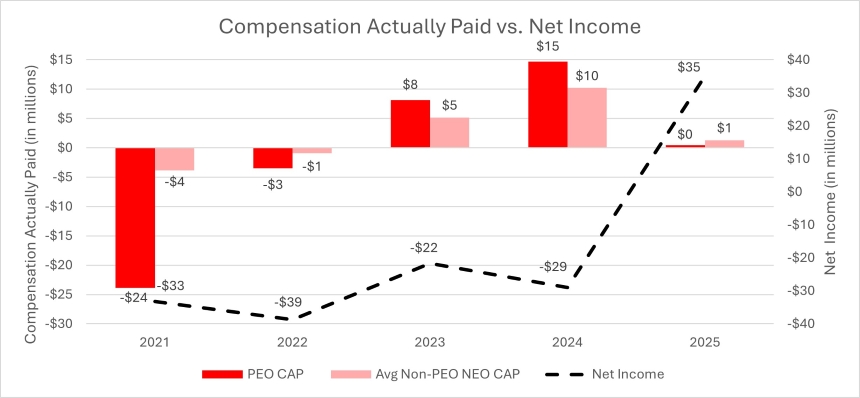
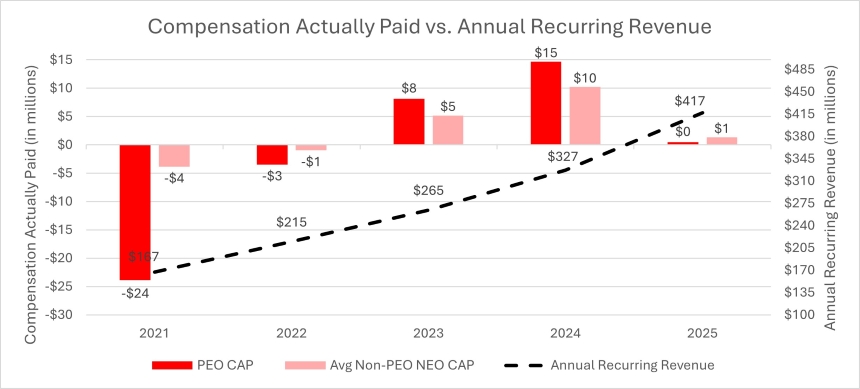
The following graphs show how compensation actually paid to our PEO and other NEOs compare to the Company’s TSR, peer group TSR, Net Income, and Annual Recurring Revenue.
Financial Performance Measures
In accordance with the pay versus performance rules, the following table lists the financial performance measures that, in the Company’s assessment, represent the most important financial performance measures used to link “compensation actually paid” to our NEOs for the fiscal year 2025, to the Company performance, as further described in our “Compensation Discussion and Analysis”.
| Most Important Performance Measures |
| Annual Recurring Revenue (Company Selected) |
| Net Income |
| Total Revenue |