Pay vs Performance Disclosure
Dec. 31, 2025
USD ($)
oz
Dec. 31, 2024
USD ($)
oz
Dec. 31, 2023
USD ($)
oz
Dec. 31, 2022
USD ($)
oz
Dec. 31, 2021
USD ($)
oz
| Value of Initial Fixed $100 Investment Based on: | ||||||||||||||||||||||||||
Summary Compensation Table Total for CEO(1) | Compensation Actually Paid to CEO(2) | Average Summary Compensation Table Total Paid to Non-CEO NEOs(1) | Average Compensation Actually Paid to Non-CEO NEOs(2) | Cumulative Total Shareholder Return(3) | Peer Group Total Shareholder Return(4) | Net Income | Gold-Equivalent Ounces Produced(5) | |||||||||||||||||||
| Year | ($) | ($) | ($) | ($) | ($) | ($) | ($) | (#) | ||||||||||||||||||
| 2025 | 7,563,241 | 23,819,845 | 3,001,492 | 7,775,513 | 114.41 | 261.46 | 362,417,000 | 447,207 | ||||||||||||||||||
| 2024 | 5,115,709 | 2,491,644 | 1,944,919 | 1,264,848 | 36.33 | 94.21 | (352,582,000) | 399,267 | ||||||||||||||||||
| 2023 | 5,285,606 | (149,067) | 1,968,184 | 300,972 | 56.16 | 77.54 | (120,225,000) | 706,894 | ||||||||||||||||||
| 2022 | 4,610,900 | 787,873 | 2,395,370 | 1,306,548 | 80.17 | 68.90 | 210,428,000 | 623,819 | ||||||||||||||||||
| 2021 | 5,572,402 | 1,379,663 | 1,945,563 | 826,874 | 89.08 | 78.62 | 425,922,000 | 794,456 | ||||||||||||||||||
| ____________________ | ||||||||||||||||||||||||||
| 2021 | 2022 | 2023 | 2024 | 2025 | |||||||||||||
| CEO | Mr. Rod Antal | Mr. Rod Antal | Mr. Rod Antal | Mr. Rod Antal | Mr. Rod Antal | ||||||||||||
| Non-CEO NEOs | Mr. Michael Sparks Mr. F. Edward Farid Ms. Alison White Mr. Stewart Beckman | Mr. Michael Sparks Mr. F. Edward Farid Ms. Alison White Mr. Stewart Beckman | Mr. Michael Sparks Mr. Bill MacNevin Mr. F. Edward Farid Ms. Alison White | Mr. Michael Sparks Mr. Bill MacNevin Mr. F. Edward Farid Mr. John Ebbett | Mr. Michael Sparks Mr. Bill MacNevin Mr. F. Edward Farid Mr. John Ebbett | ||||||||||||
| CEO | Non-CEO NEOs Averages | ||||||||||||||||
| 2025 | 2025 | ||||||||||||||||
| Total Compensation as reported in Summary Compensation Table (SCT) | 7,563,241 | 3,001,492 | |||||||||||||||
Pension values reported in SCT(a) | — | — | |||||||||||||||
| Fair value of equity awards granted during fiscal year | 3,225,000 | (b) | 993,125 | (b) | |||||||||||||
Change in fair value of equity awards granted in current year: change in value of awards from time of grant to end of year-end | 7,087,450 | 2,182,542 | |||||||||||||||
Change in fair value of awards that vested during current fiscal year: change in value of awards from end of prior fiscal year to vest date | 1,689,436 | 442,219 | |||||||||||||||
Change in fair value of awards that were unvested at end of current fiscal year: change in value of awards from end of prior fiscal year to end of current fiscal year | 10,704,718 | 3,142,385 | |||||||||||||||
| Dividends or other earnings paid on stock awards in the covered fiscal year prior to the vesting date that are not otherwise included in the total compensation for the covered fiscal year | — | — | |||||||||||||||
| Fair value of awards forfeited in current fiscal year determined at end of prior fiscal year | — | — | |||||||||||||||
| Compensation Actually Paid | 23,819,845 | 7,775,513 | |||||||||||||||
| ____________________ | |||||||||||||||||
(a) The Company does not offer a pension plan or nonqualified deferred compensation to its employees, including NEOs. As such, no adjustment was needed with respect to pensions and nonqualified deferred compensation.
(b) Market value at the time of grant was $4.36 for each share, which is the 30-day volume weighted average price ("VWAP") on the Nasdaq as of March 28, 2024.
| CEO | Non-CEO NEOs Averages | ||||||||||||||||
| 2025 | 2025 | ||||||||||||||||
| Total Compensation as reported in Summary Compensation Table (SCT) | 7,563,241 | 3,001,492 | |||||||||||||||
Pension values reported in SCT(a) | — | — | |||||||||||||||
| Fair value of equity awards granted during fiscal year | 3,225,000 | (b) | 993,125 | (b) | |||||||||||||
Change in fair value of equity awards granted in current year: change in value of awards from time of grant to end of year-end | 7,087,450 | 2,182,542 | |||||||||||||||
Change in fair value of awards that vested during current fiscal year: change in value of awards from end of prior fiscal year to vest date | 1,689,436 | 442,219 | |||||||||||||||
Change in fair value of awards that were unvested at end of current fiscal year: change in value of awards from end of prior fiscal year to end of current fiscal year | 10,704,718 | 3,142,385 | |||||||||||||||
| Dividends or other earnings paid on stock awards in the covered fiscal year prior to the vesting date that are not otherwise included in the total compensation for the covered fiscal year | — | — | |||||||||||||||
| Fair value of awards forfeited in current fiscal year determined at end of prior fiscal year | — | — | |||||||||||||||
| Compensation Actually Paid | 23,819,845 | 7,775,513 | |||||||||||||||
| ____________________ | |||||||||||||||||
(a) The Company does not offer a pension plan or nonqualified deferred compensation to its employees, including NEOs. As such, no adjustment was needed with respect to pensions and nonqualified deferred compensation.
(b) Market value at the time of grant was $4.36 for each share, which is the 30-day volume weighted average price ("VWAP") on the Nasdaq as of March 28, 2024.
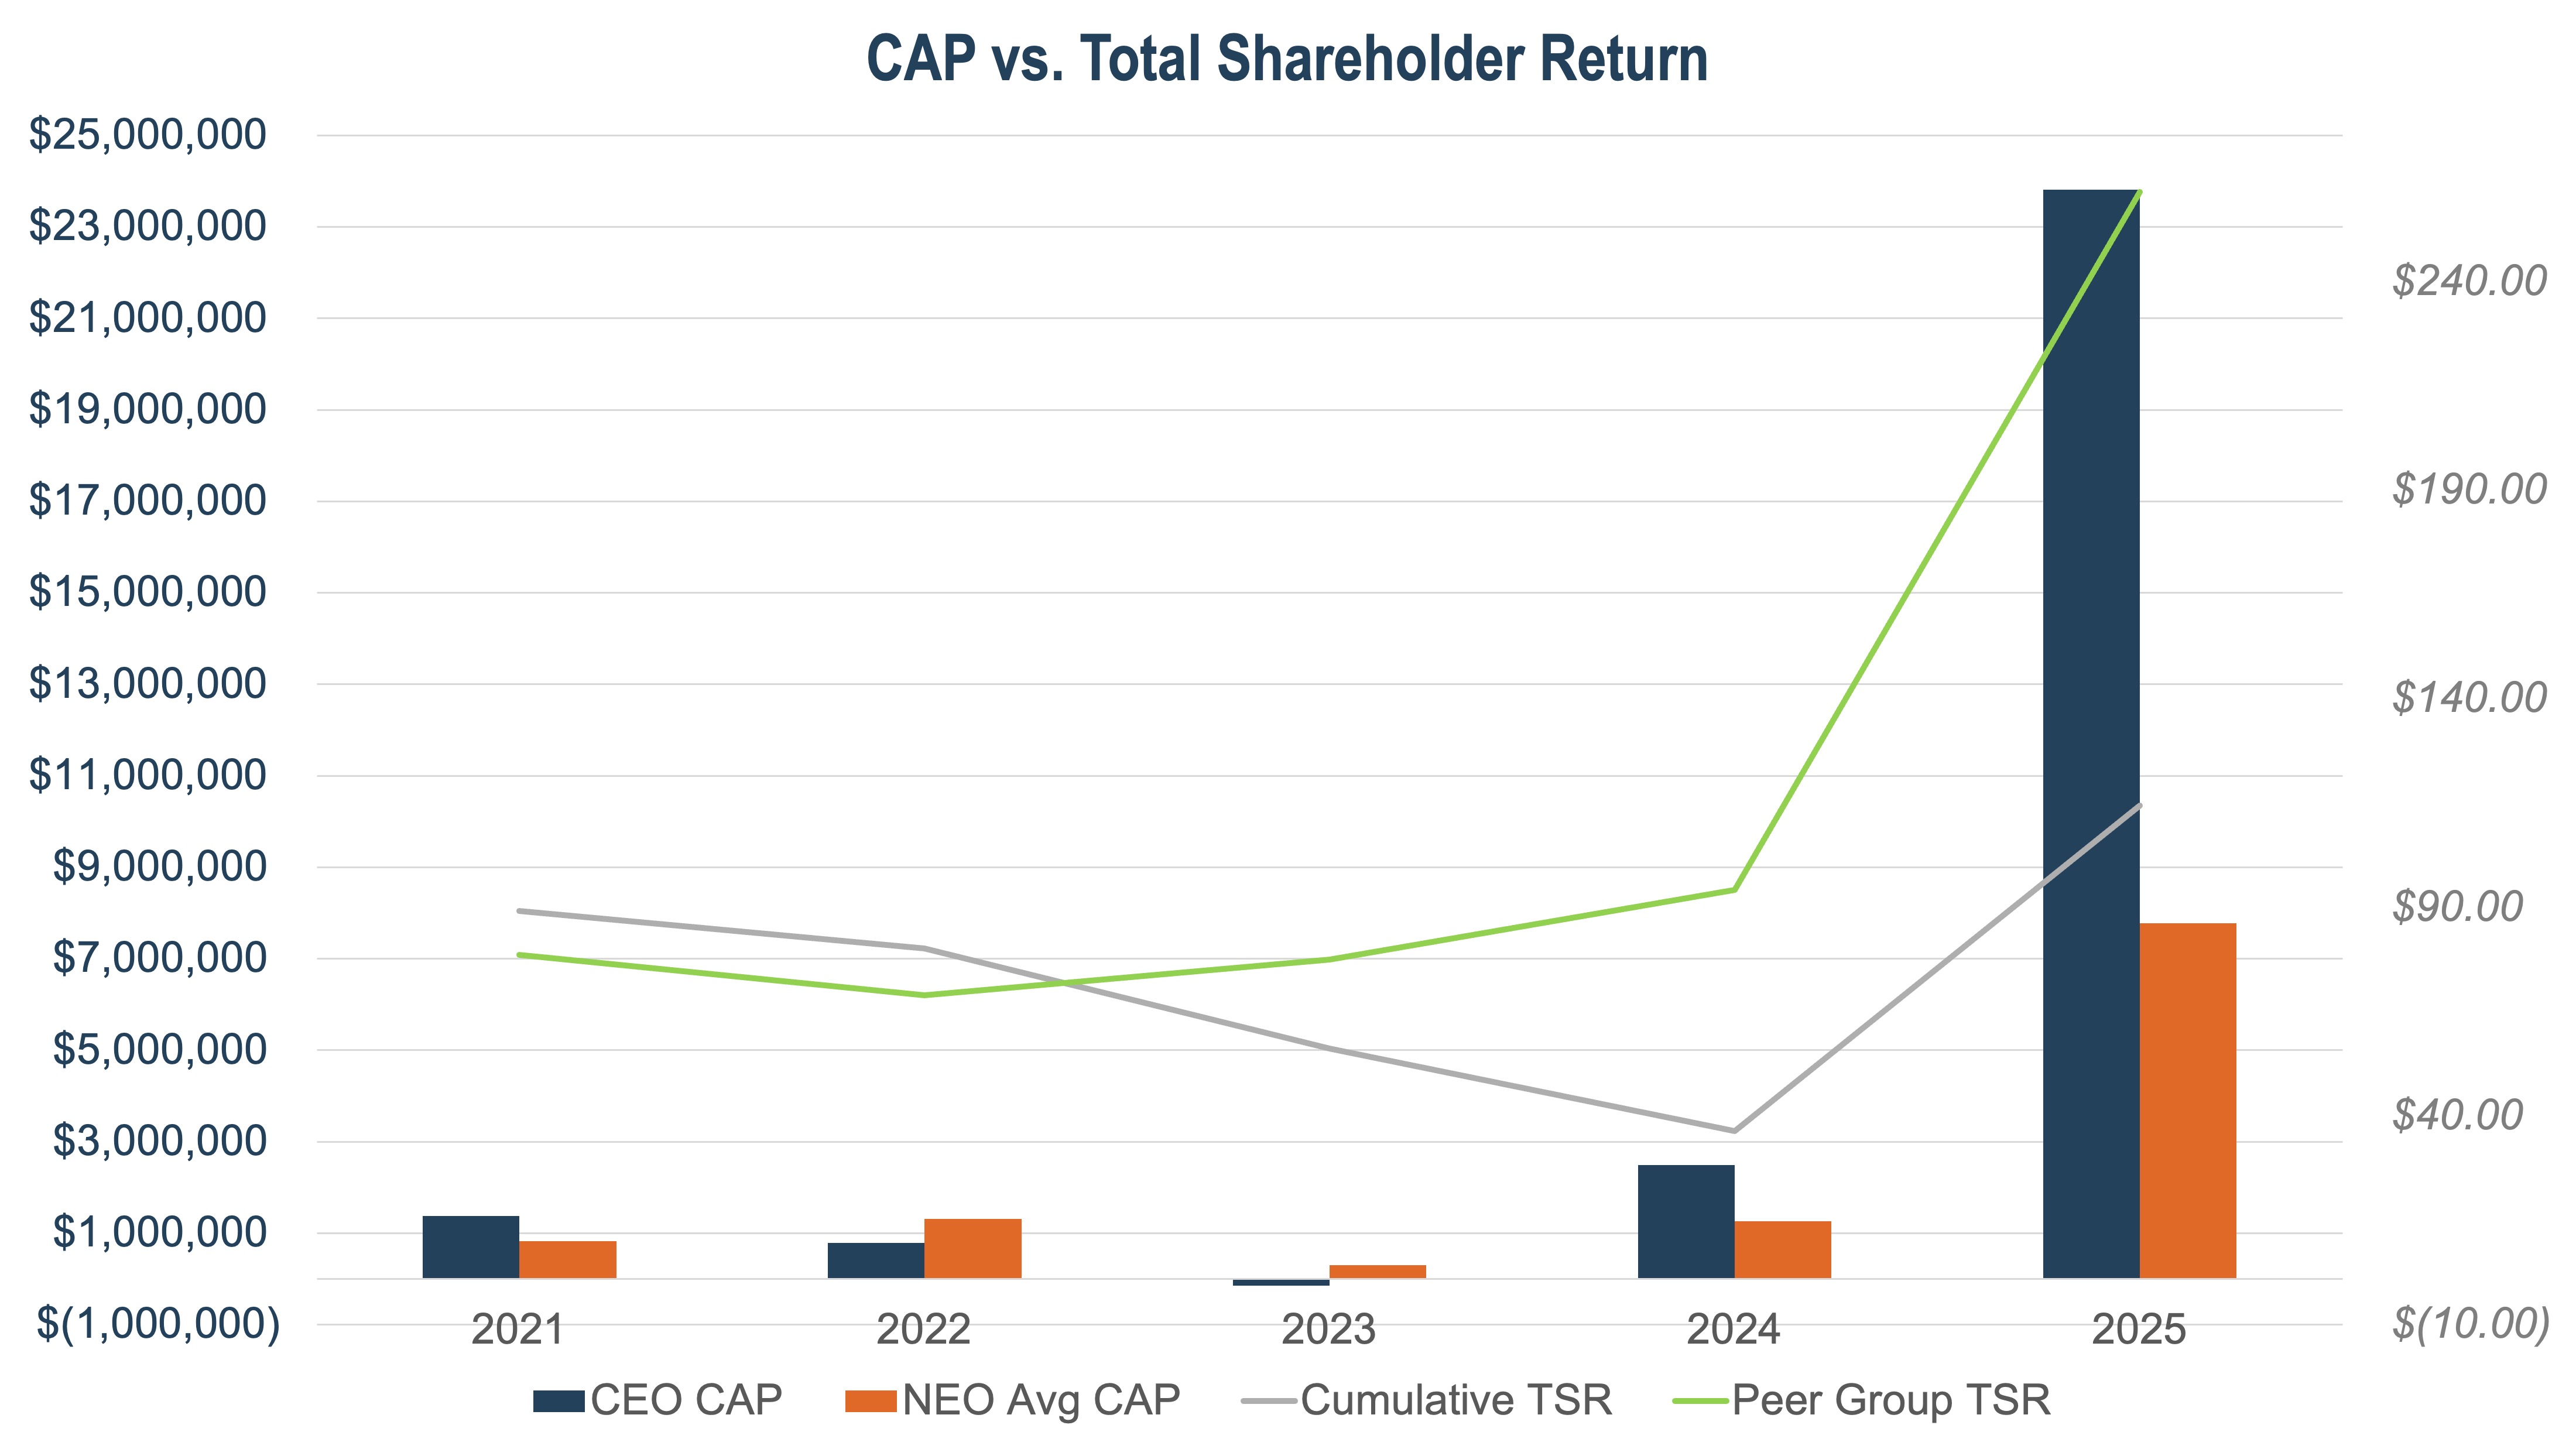
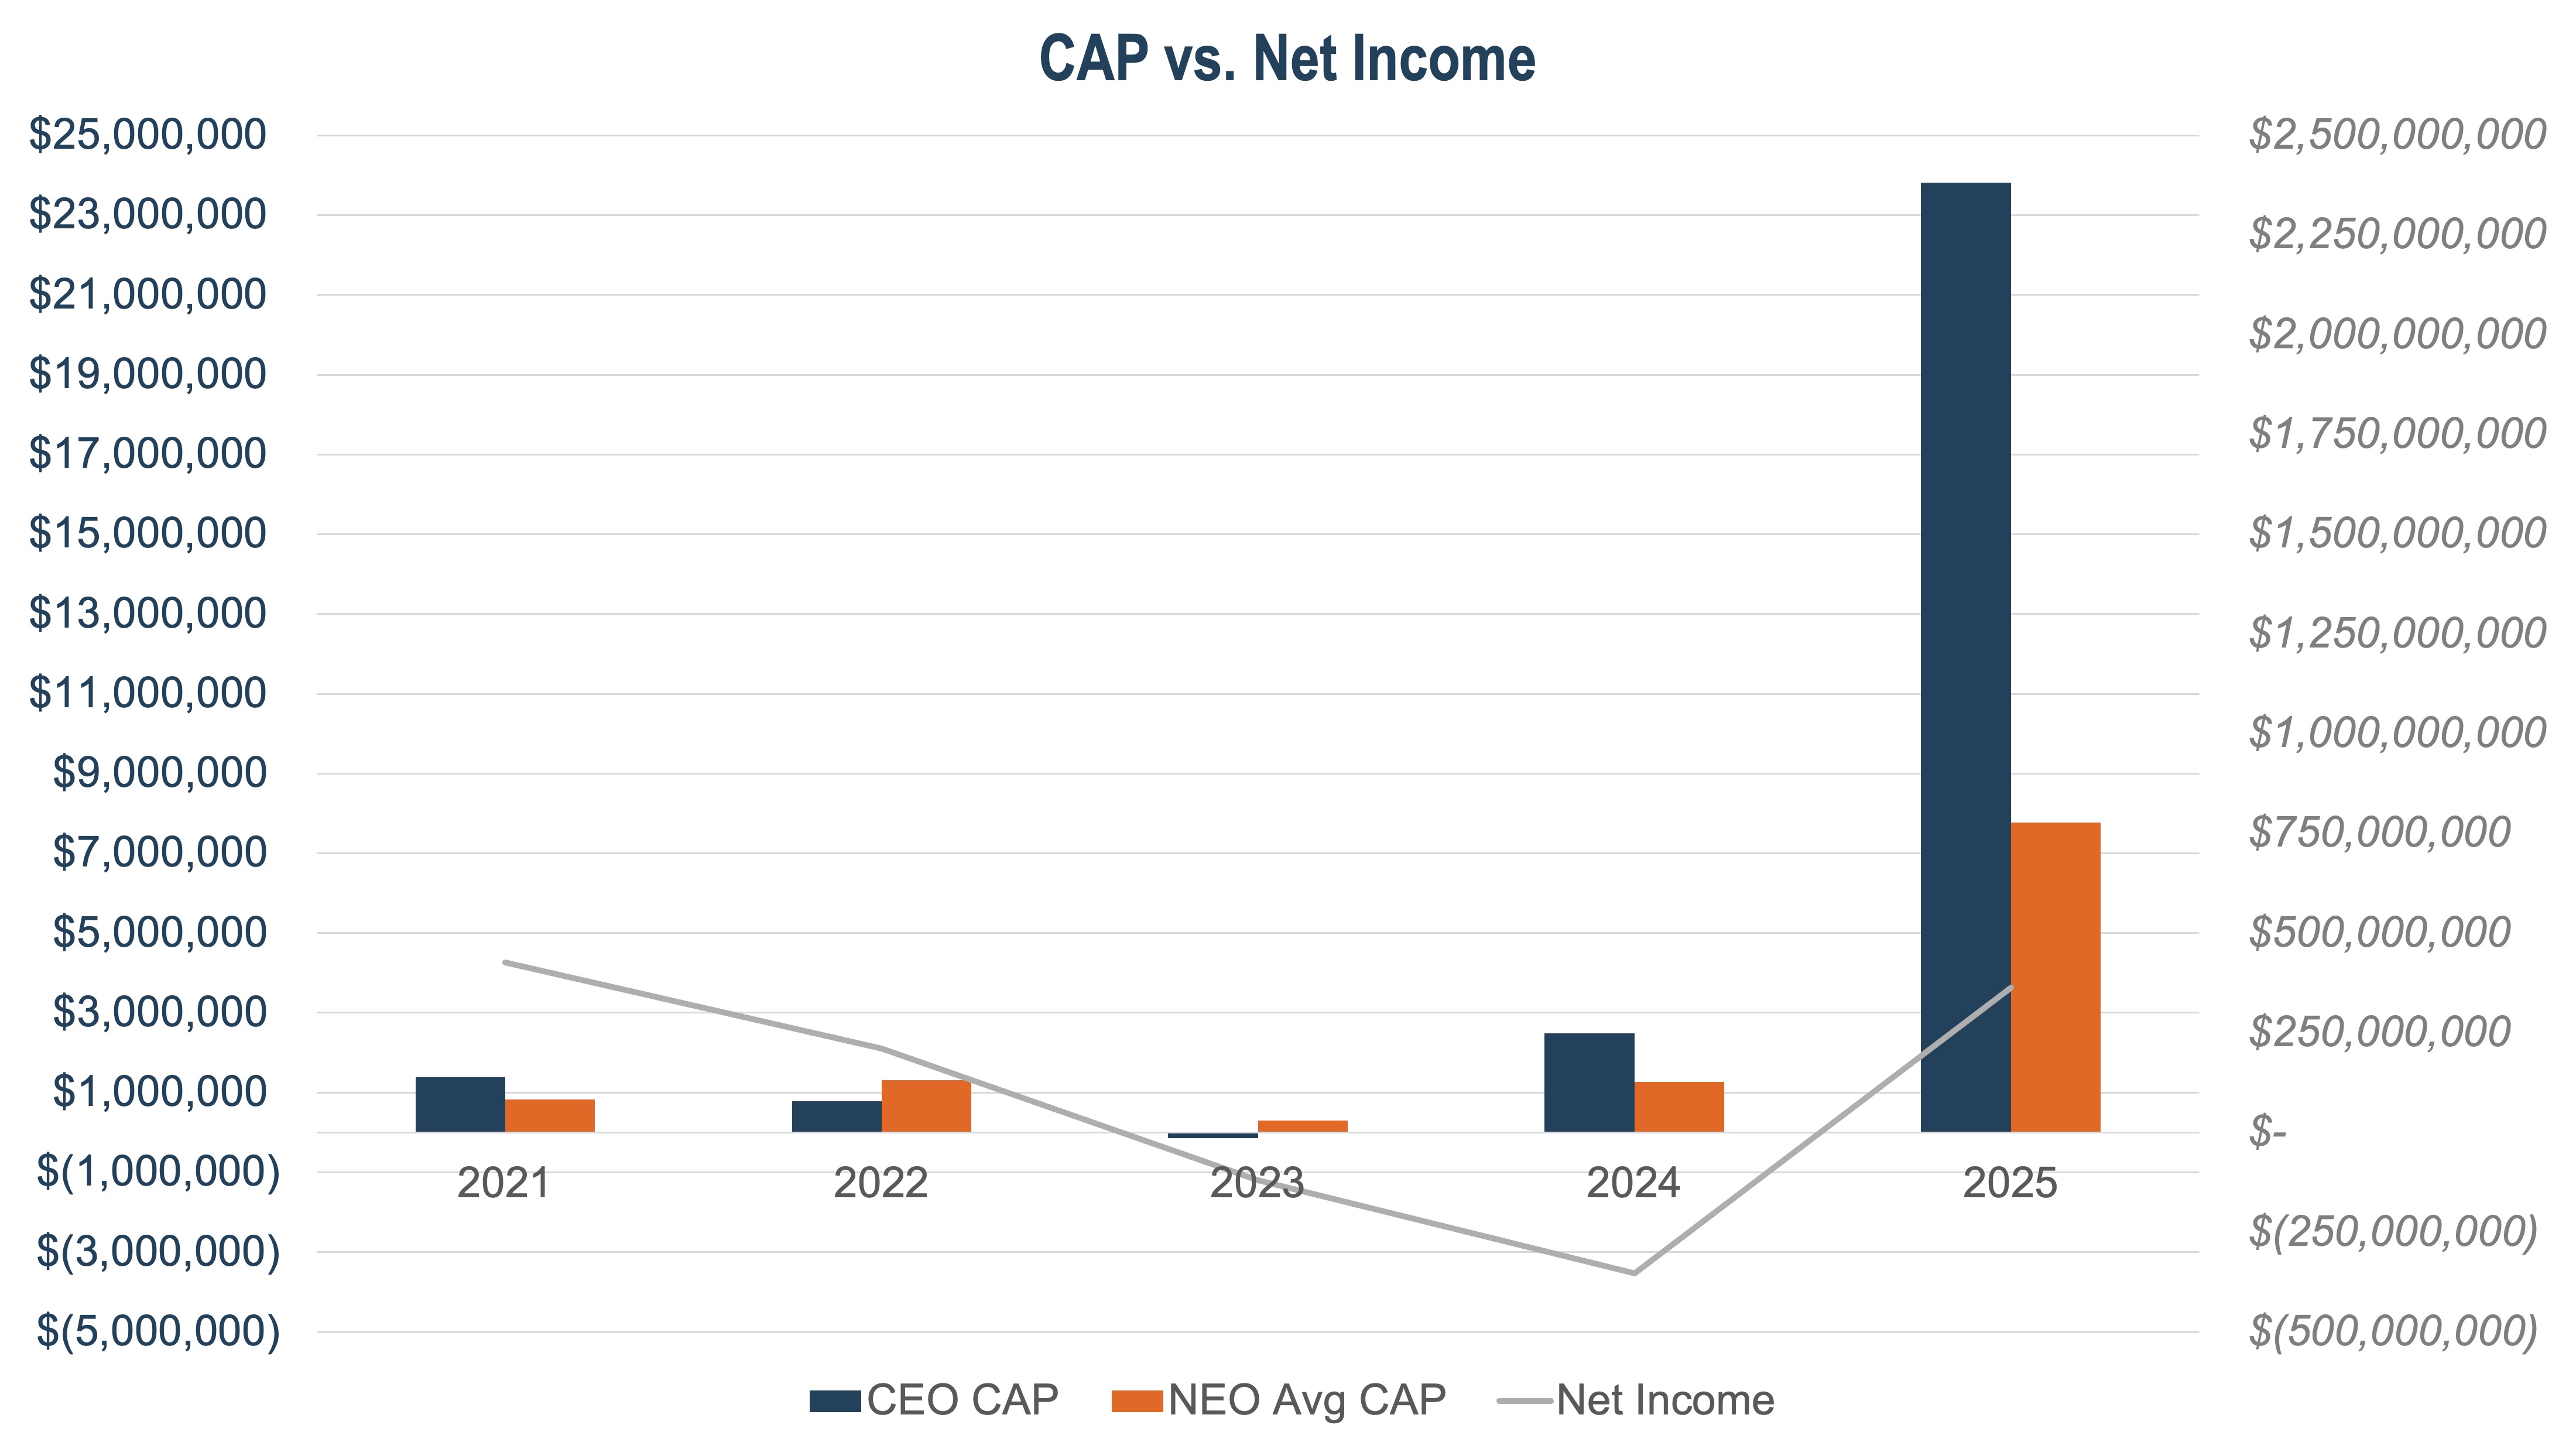
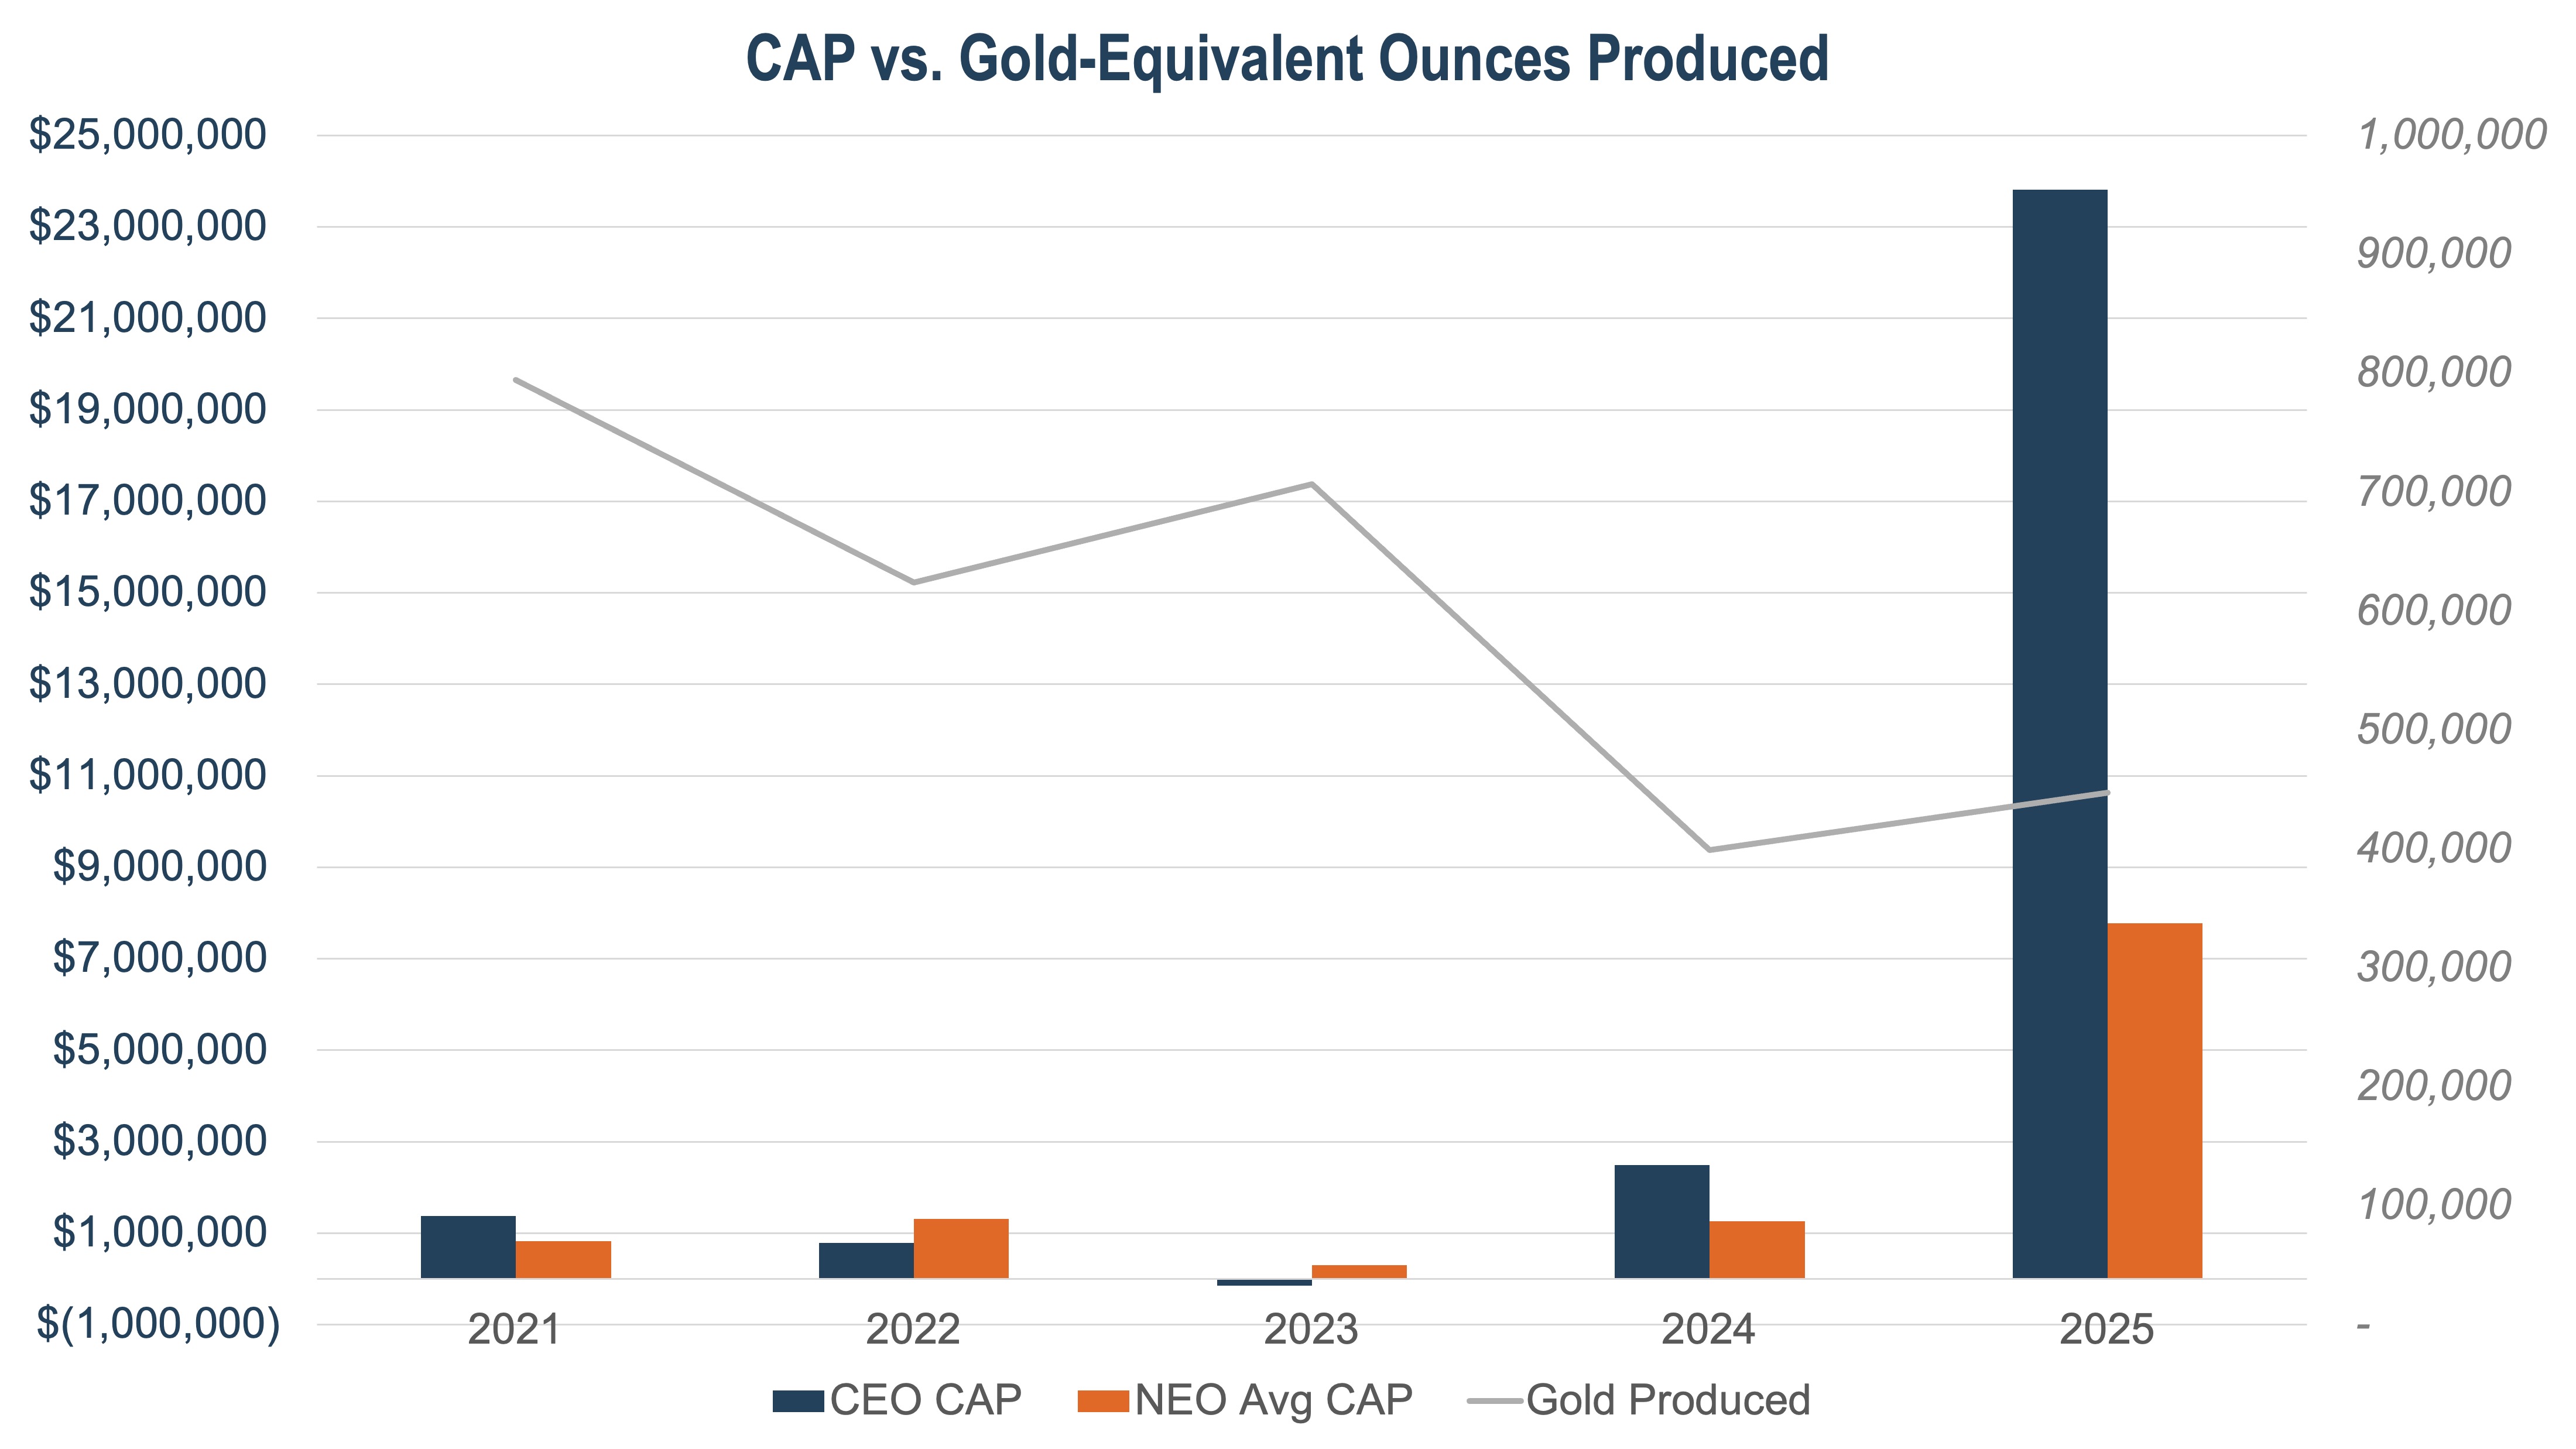
The charts below reflect the relationship between the CEO and the average Non-CEO NEO CAP and the performance measures shown in the pay versus performance table for the reporting years:
(Company Selected Measure)
In 2025, the Company’s strong share price performance—reflecting a 215% year‑over‑year increase—resulted in higher values for all vested and outstanding equity awards held by our NEOs. The increase in CAP for 2024 primarily reflects the change in value of equity awards granted on April 1, 2024, which were issued at a share price of $4.36 and valued at year‑end using a fair value of $6.96, while all other outstanding or vested awards declined in value during the year.
The charts below reflect the relationship between the CEO and the average Non-CEO NEO CAP and the performance measures shown in the pay versus performance table for the reporting years:
(Company Selected Measure)
In 2025, the Company’s strong share price performance—reflecting a 215% year‑over‑year increase—resulted in higher values for all vested and outstanding equity awards held by our NEOs. The increase in CAP for 2024 primarily reflects the change in value of equity awards granted on April 1, 2024, which were issued at a share price of $4.36 and valued at year‑end using a fair value of $6.96, while all other outstanding or vested awards declined in value during the year.
The charts below reflect the relationship between the CEO and the average Non-CEO NEO CAP and the performance measures shown in the pay versus performance table for the reporting years:
(Company Selected Measure)
In 2025, the Company’s strong share price performance—reflecting a 215% year‑over‑year increase—resulted in higher values for all vested and outstanding equity awards held by our NEOs. The increase in CAP for 2024 primarily reflects the change in value of equity awards granted on April 1, 2024, which were issued at a share price of $4.36 and valued at year‑end using a fair value of $6.96, while all other outstanding or vested awards declined in value during the year.
The charts below reflect the relationship between the CEO and the average Non-CEO NEO CAP and the performance measures shown in the pay versus performance table for the reporting years:
(Company Selected Measure)
In 2025, the Company’s strong share price performance—reflecting a 215% year‑over‑year increase—resulted in higher values for all vested and outstanding equity awards held by our NEOs. The increase in CAP for 2024 primarily reflects the change in value of equity awards granted on April 1, 2024, which were issued at a share price of $4.36 and valued at year‑end using a fair value of $6.96, while all other outstanding or vested awards declined in value during the year.
| Measure | Nature | Explanation | ||||||||||||
| Gold-Equivalent Ounces Produced | Financial measure | Actual gold and gold-equivalent ounces produced. | ||||||||||||
| Cost of Sales | Financial measure | The total of all costs associated with producing gold and gold-equivalent ounces, and does not include depreciation, depletion and amortization. The Company uses cost of sales as the GAAP equivalent to the non-GAAP metric all-in sustaining costs (AISC). | ||||||||||||
| Relative TSR | Financial measure | Total shareholder return relative to the Company's peer group. | ||||||||||||
| Return on Invested Capital | Financial measure | The rate of return on cash invested in the Company’s business. | ||||||||||||
As required by Section 953(a) of the Dodd-Frank Act and Item 402(v) of Regulation S-K, the following table summarizes the compensation of our CEO, and the average compensation of the other NEOs (“Non-CEO NEOs”), as reported in the Summary Compensation Table, as well as their “compensation actually paid” (“CAP”) as calculated pursuant to recently adopted SEC rules and certain performance measures required by the rules.
The Compensation Committee did not consider the pay versus performance disclosure below in making its compensation decisions for any of the years shown. For further information concerning our “pay-for-performance” compensation philosophy and greater detail on the elements of our executive compensation program, please see the “Compensation Discussion and Analysis” section of this Proxy Statement.
The Cumulative Total Shareholder Return is based on SSR Mining's Nasdaq trading volume.