Pay vs Performance Disclosure
Dec. 31, 2025
USD ($)
| | | | | PEO(1) | | | Non-PEO NEOs(1) | | | Value of initial fixed $100 investment based on: | | | (millions) | | ||||||||||||||||||||||||||||||||||||||||||
| | Year | | | Summary Compensation Table Total for PEO ($)(2) | | | Compensation Actually Paid to PEO ($)(3) | | | Average Summary Compensation Table Total for non-PEO NEOs ($)(2) | | | Average Compensation Actually Paid to non-PEO NEOs ($)(3) | | | Total Shareholder Return (“TSR”) ($)(4) | | | Peer Group TSR ($)(5) | | | Net Income ($)(6) | | | Adjusted OIBDA ($)(7) | | ||||||||||||||||||||||||||||||
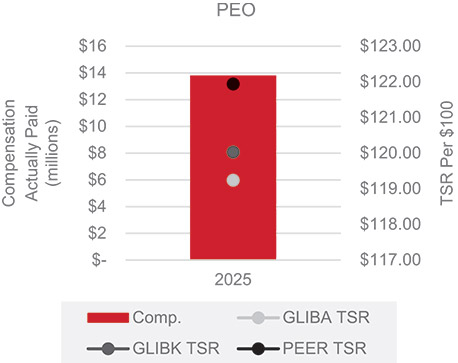
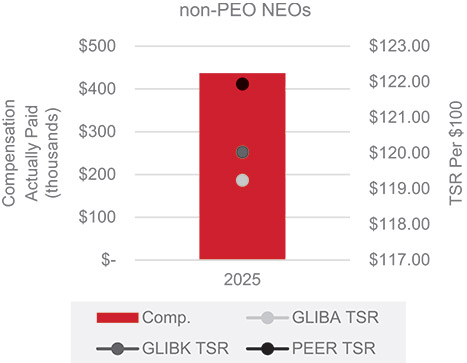
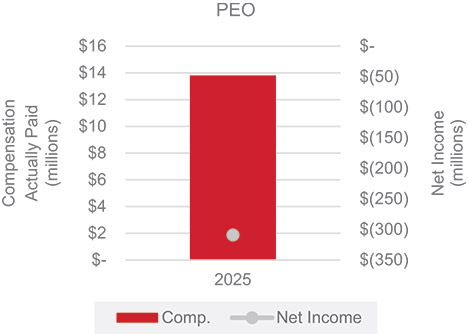
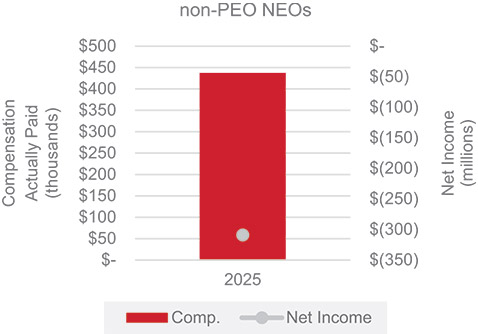
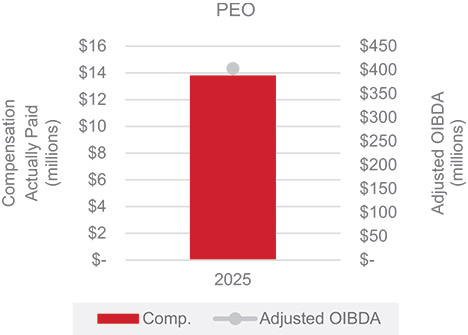
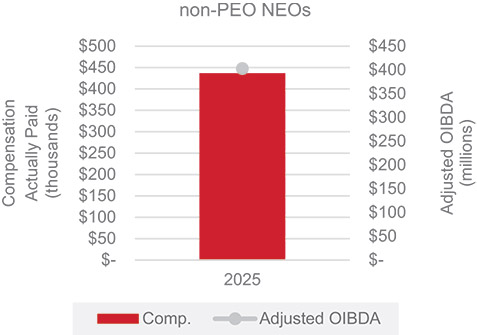
| | 2025 | | | | | 12,937,719 | | | | | | 13,815,045 | | | | | | 373,183 | | | | | | 437,497 | | | | | | GLIBA | | | | | | 119.24 | | | | | | 121.94 | | | | | | (309) | | | | | | 403 | | |
| | | | | | | | | | | | | | | | | | | | | | | | | | | | | | | GLIBK | | | | | | 120.03 | | | | | | | | | | | | | | | | | | | | |
(1)
Our Principal Executive Officer (PEO) Mr. Duncan. Our named executive officers other than our PEO (non-PEO NEOs) were Mr. Wendling and Ms. Wilm.
(2)
Reflects, for Mr. Duncan, the total compensation reported in the Summary Compensation Table and for the non-PEO NEOs, the average total compensation reported in the Summary Compensation Table in each of the fiscal years indicated.
(3)
Represents the compensation actually paid to Mr. Duncan and the non-PEO NEOs in each of the fiscal years indicated as computed in accordance with Item 402(v) of Regulation S-K and related SEC guidance, as set forth below:
| | Compensation actually paid to PEO and Non-PEO NEOs | | ||||||||||||||||||||||||||||||||||||||||||||||||
| | | | | As Reported in Summary Compensation Table(a) | | | Equity Award Adjustments(b) | | | | | | | | ||||||||||||||||||||||||||||||||||||
| | Year | | | Total | | | Stock Awards | | | Option Awards | | | Fair Value at Year End of Awards Granted During Year that Remain Outstanding and Unvested at Year End(c) | | | Year-over- Year Change in Fair Value of Awards Granted in Prior Year that Remain Outstanding and Unvested at Year End(d) | | | Fair Value at Vesting Date of Awards Granted and Vested in Same Year(e) | | | Change in Fair Value from Prior Year End to Vesting Date of Awards Granted in Prior Year and Vested in Covered Year(f) | | | Total Compensation Actually Paid | | ||||||||||||||||||||||||
| | PEO | | ||||||||||||||||||||||||||||||||||||||||||||||||
| | 2025 | | | | | 12,937,719 | | | | | | (1,459,893) | | | | | | (10,057,524) | | | | | | 11,623,108 | | | | | | 26,769 | | | | | | 744,866 | | | | | | | | | | | 13,815,045 | | | |
| | Non-PEO NEOs | | ||||||||||||||||||||||||||||||||||||||||||||||||
| | 2025 | | | | | 373,183 | | | | | | (373,183) | | | | | | | | | | | 437,497 | | | | | | | | | | | | | | | | | | | | | 437,497 | | | ||||
(a)
Reflects, for Mr. Duncan, the applicable amounts reported in the Summary Compensation Table and for the non-PEO NEOs, the average of the applicable amounts reported in the Summary Compensation Table in each of the fiscal years indicated.
(b)
The adjustments made to the fair value of equity awards in accordance with Item 402(v) of Regulation S-K and include, for Mr. Duncan, equity awards with respect to our common stock that were issued in connection with adjustments made to outstanding equity awards with respect to shares of Liberty Broadband’s Series C common stock in connection with the GCI Liberty Spin-Off.
(c)
Reflects, with respect to Mr. Duncan, the fair value and, with respect to the non-PEO NEOs, the average of the fair values, as of the end of the covered fiscal year of awards granted in, and remaining outstanding and unvested (in whole or in part) as of the end of, the covered fiscal year.
(d)
Reflects, with respect to Mr. Duncan, the change in fair value, and with respect to the non-PEO NEOs, the average of the change in fair values, from July 14, 2025 (the date of the GCI Liberty Spin-Off) to the end of the covered fiscal year of awards granted in prior fiscal years that remained outstanding and unvested (in whole or in part) as of the end of the covered fiscal year.
(e)
Reflects, with respect to Mr. Duncan, the fair value, and with respect to the non-PEO NEOs, the average of the fair values, as of the day awards became vested in the covered fiscal year, when such awards were also granted in the covered fiscal year.
(f)
Reflects, with respect to Mr. Duncan, the change in fair value, and with respect to the non-PEO NEOs, the average of the change in fair values, from July 14, 2025 (the date of the GCI Liberty Spin-Off) to the day awards became vested in the covered fiscal year, when such awards were granted in a prior fiscal year.
(4)
Represents the cumulative total stockholder return on an initial fixed $100 investment in each of GLIBA and GLIBK from July 15, 2025 through December 31, 2025.
(5)
Represents the cumulative total stockholder return on an initial fixed $100 investment in the S&P 500 Communication Services Index from July 15, 2025 through December 31, 2025.
(6)
Represents the amount of net income reflected in our consolidated financial statements for each covered fiscal year.
(7)
We define Adjusted OIBDA as operating income (loss) plus depreciation and amortization, stock-based compensation, separately reported litigation settlements, transaction related costs (including acquisition, restructuring, integration, and advisory fees), and impairment charges. For purposes of this disclosure, Adjusted OIBDA includes our attributable interests in our equity investments.
(1)
Our Principal Executive Officer (PEO) Mr. Duncan. Our named executive officers other than our PEO (non-PEO NEOs) were Mr. Wendling and Ms. Wilm.
(2)
Reflects, for Mr. Duncan, the total compensation reported in the Summary Compensation Table and for the non-PEO NEOs, the average total compensation reported in the Summary Compensation Table in each of the fiscal years indicated.
(5)
Represents the cumulative total stockholder return on an initial fixed $100 investment in the S&P 500 Communication Services Index from July 15, 2025 through December 31, 2025.
(3)
Represents the compensation actually paid to Mr. Duncan and the non-PEO NEOs in each of the fiscal years indicated as computed in accordance with Item 402(v) of Regulation S-K and related SEC guidance, as set forth below:
| | Compensation actually paid to PEO and Non-PEO NEOs | | ||||||||||||||||||||||||||||||||||||||||||||||||
| | | | | As Reported in Summary Compensation Table(a) | | | Equity Award Adjustments(b) | | | | | | | | ||||||||||||||||||||||||||||||||||||
| | Year | | | Total | | | Stock Awards | | | Option Awards | | | Fair Value at Year End of Awards Granted During Year that Remain Outstanding and Unvested at Year End(c) | | | Year-over- Year Change in Fair Value of Awards Granted in Prior Year that Remain Outstanding and Unvested at Year End(d) | | | Fair Value at Vesting Date of Awards Granted and Vested in Same Year(e) | | | Change in Fair Value from Prior Year End to Vesting Date of Awards Granted in Prior Year and Vested in Covered Year(f) | | | Total Compensation Actually Paid | | ||||||||||||||||||||||||
| | PEO | | ||||||||||||||||||||||||||||||||||||||||||||||||
| | 2025 | | | | | 12,937,719 | | | | | | (1,459,893) | | | | | | (10,057,524) | | | | | | 11,623,108 | | | | | | 26,769 | | | | | | 744,866 | | | | | | | | | | | 13,815,045 | | | |
| | Non-PEO NEOs | | ||||||||||||||||||||||||||||||||||||||||||||||||
| | 2025 | | | | | 373,183 | | | | | | (373,183) | | | | | | | | | | | 437,497 | | | | | | | | | | | | | | | | | | | | | 437,497 | | | ||||
(a)
Reflects, for Mr. Duncan, the applicable amounts reported in the Summary Compensation Table and for the non-PEO NEOs, the average of the applicable amounts reported in the Summary Compensation Table in each of the fiscal years indicated.
(b)
The adjustments made to the fair value of equity awards in accordance with Item 402(v) of Regulation S-K and include, for Mr. Duncan, equity awards with respect to our common stock that were issued in connection with adjustments made to outstanding equity awards with respect to shares of Liberty Broadband’s Series C common stock in connection with the GCI Liberty Spin-Off.
(c)
Reflects, with respect to Mr. Duncan, the fair value and, with respect to the non-PEO NEOs, the average of the fair values, as of the end of the covered fiscal year of awards granted in, and remaining outstanding and unvested (in whole or in part) as of the end of, the covered fiscal year.
(d)
Reflects, with respect to Mr. Duncan, the change in fair value, and with respect to the non-PEO NEOs, the average of the change in fair values, from July 14, 2025 (the date of the GCI Liberty Spin-Off) to the end of the covered fiscal year of awards granted in prior fiscal years that remained outstanding and unvested (in whole or in part) as of the end of the covered fiscal year.
(e)
Reflects, with respect to Mr. Duncan, the fair value, and with respect to the non-PEO NEOs, the average of the fair values, as of the day awards became vested in the covered fiscal year, when such awards were also granted in the covered fiscal year.
(f)
Reflects, with respect to Mr. Duncan, the change in fair value, and with respect to the non-PEO NEOs, the average of the change in fair values, from July 14, 2025 (the date of the GCI Liberty Spin-Off) to the day awards became vested in the covered fiscal year, when such awards were granted in a prior fiscal year.
| |
|
| |
|
|
| |
|
| |
|
|
(7)
We define Adjusted OIBDA as operating income (loss) plus depreciation and amortization, stock-based compensation, separately reported litigation settlements, transaction related costs (including acquisition, restructuring, integration, and advisory fees), and impairment charges. For purposes of this disclosure, Adjusted OIBDA includes our attributable interests in our equity investments.