Pay vs Performance Disclosure
Unit_pure in Thousands
Unit_pure in Thousands
Dec. 31, 2022
Aug. 04, 2022
Dec. 31, 2025
USD ($)
Dec. 31, 2024
USD ($)
Dec. 31, 2023
USD ($)
Dec. 31, 2022
USD ($)
Dec. 31, 2021
USD ($)
Pay versus Performance
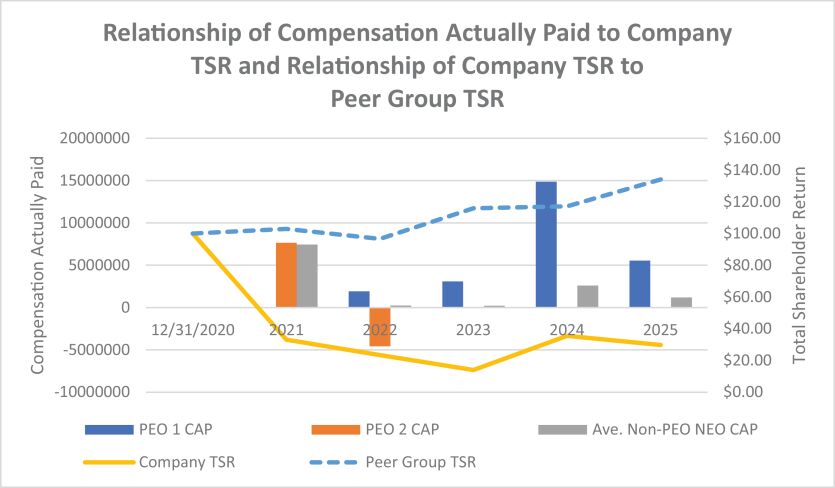
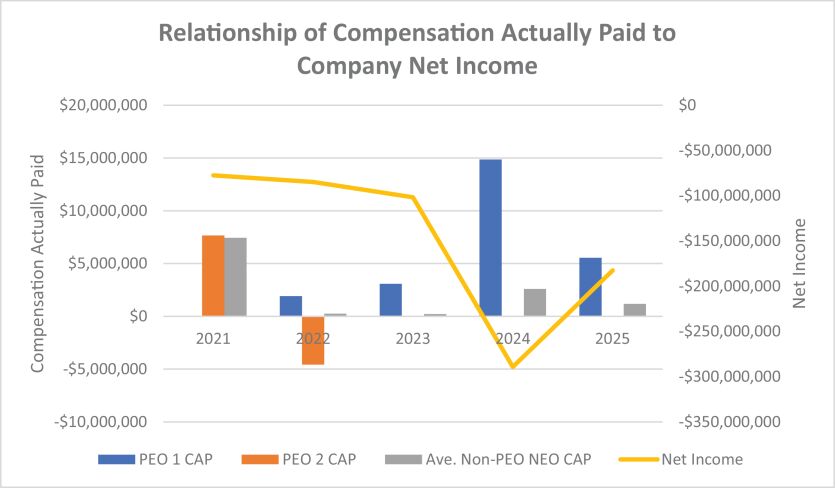
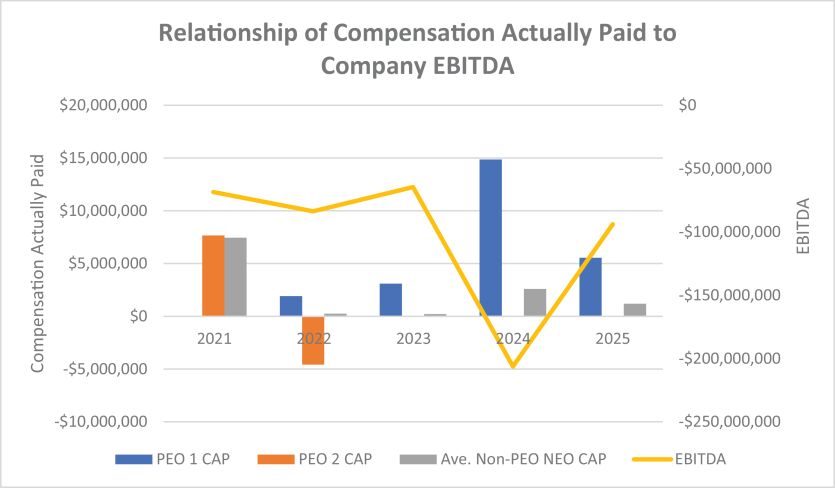
The table below discloses the total compensation for our NEOs for the past five fiscal years as disclosed in the Summary Compensation Table, the “compensation actually paid” to our principal executive officer (our “PEO”) and, on an average basis, our other NEOs (in each case, as determined under SEC rules) (collectively, the “PVP NEOs”), our total shareholder return (“TSR”), the TSR of the S&P Small Cap 600 Materials Index over the same period, our net income, and our company-selected financial performance measure, EBITDA.
PAY VERSUS PERFORMANCE TABLE |
||||||||||||||||||||||||||||||||||||||||||||||||||||||||||||||||||||||||||||
Year(a) |
Summary Compensation Table Total for PEO 1 (b)(1) |
Compensation Actually Paid to PEO 1 (c)(1)(2) |
Summary Compensation Table Total for PEO 2 (b)(1) |
Compensation Actually Paid for PEO 2 (c)(1)(2) |
Average Summary Compensation Table Total for Non-PEO Named Executive Officers (d)(1) |
Average Compensation Actually Paid to Non-PEO Named Executive Officers (e)(1)(2) |
Value of Initial Fixed $100 Investment Based On: |
Net Income (Loss) (in thousands) (h) |
Company- Selected Measure: EBITDA (in thousands) (i)(4) |
|||||||||||||||||||||||||||||||||||||||||||||||||||||||||||||||||||
Total Shareholder Return(f)(3) |
Peer Group Total Shareholder Return(g)(3) |
|||||||||||||||||||||||||||||||||||||||||||||||||||||||||||||||||||||||||||
2025 |
$ | 6,237,167 | $ | 5,546,033 | — | — | $ | 1,242,753 | $ | 1,185,614 | $ | 29.72 | $ | 134.12 | ($ | 182,565 | ) | ($ | 93,889 | ) | ||||||||||||||||||||||||||||||||||||||||||||||||||||||||
2024 |
$ | 4,074,178 | $ | 14,860,919 | (5) |
— | — | $ | 1,005,566 | $ | 2,594,132 | (5) |
$ | 35.47 | $ | 117.10 | ($ | 289,136 | ) | ($ | 206,239 | ) | ||||||||||||||||||||||||||||||||||||||||||||||||||||||
2023 |
$ | 3,946,566 | $ | 3,084,231 | — | — | $ | 1,216,476 | $ | 210,388 | $ | 14.01 | $ | 115.92 | ($ | 101,715 | ) | ($ | 64,625 | ) | ||||||||||||||||||||||||||||||||||||||||||||||||||||||||
2022 |
$ | 4,323,045 | $ | 1,911,537 | $ | 4,266,831 | ($ | 4,574,715 | ) | $ | 1,313,331 | $ | 245,344 | $ | 23.39 | $ | 96.62 | ($ | 84,746 | ) | ($ | 83,744 | ) | |||||||||||||||||||||||||||||||||||||||||||||||||||||
2021 |
— | — | $ | 9,352,652 | $ | 7,655,192 | $ | 14,889,283 | $ | 7,444,210 | $ | 33.11 | $ | 102.88 | ($ | 77,502 | ) | ($ | 68,569 | ) | ||||||||||||||||||||||||||||||||||||||||||||||||||||||||
| 1 | Dustin Olson (“PEO 1”) has served as our principal executive officer since August 5, 2022. Michael Otworth (“PEO 2” and, together with PEO 1, the “PEOs”) served as our principal executive officer from January 1, 2022, through August 4, 2022, and for all of 2021. For 2025, our non-PEO NEOs were Jaime Vasquez and Brad Kalter. For 2024, our non-PEO NEOs were Jaime Vasquez, Jeffrey Fieler, and Brad Kalter. For 2023, our non-PEO NEOs were Lawrence Somma, Jeffrey Fieler and Brad Kalter. For 2022, our non-PEO NEOs were Lawrence Somma, Brad Kalter and David Brenner. For 2021, our non-PEO NEOs were Lawrence Somma, Michael Dee and Dustin Olson. In this disclosure, we refer to each of 2025, 2024, 2023, 2022 and 2021 as a “Covered Year.” |
| 2 | For each of 2025, 2024, 2023, 2022 and 2021, the values included in this column for the CAP to our PEOs and the average CAP to our non-PEO NEOs reflect certain adjustments to the values included in column (b) and column (d), respectively. For 2025, those adjustments are as follows: |
PEO 1 (Dustin Olson) |
2025 ($) |
|||
Summary Compensation Table Total for PEO (column (b)) |
$ | 6,237,167 | ||
- aggregate change in actuarial present value of pension benefits |
($ | 0 | ) | |
+ service cost of pension benefits |
$ | 0 | ||
+ prior service cost of pension benefits |
$ | 0 | ||
- SCT “Stock Awards” column value |
($ | 4,548,019 | ) | |
- SCT “Option Awards” column value |
($ | 674,998 | ) | |
+year-end fair value of equity awards granted in the Covered Year that are outstanding and unvested as of the Covered Year-end |
$ | 2,609,816 | ||
+/- change in fair value (from prior year-end to Covered Year-end) of equity awards granted in prior years that are outstanding and unvested as of the Covered Year-end |
($ | 454,954 | ) | |
+ vesting date fair value of equity awards granted and vested in the Covered Year |
$ | 2,268,000 | ||
+/- change in fair value (from prior year-end to vesting date) of equity awards granted in prior years that vested in the Covered Year |
$ | 109,021 | ||
- fair value as of prior year end of equity awards granted in prior years that failed to vest in the Covered Year |
$ | 0 | ||
+ dollar value of dividends/earnings paid on equity awards in the Covered Year |
$ | 0 | ||
+ excess fair value for equity award modifications |
$ | 0 | ||
Compensation Actually Paid to PEO 1 (column (c)) |
$ | 5,546,033 | ||
AVERAGE FOR NON-PEO NEOS |
2025 ($) |
|||
Average SCT Total for Non-PEO NEOs (column (d)) |
$ | 1,242,753 | ||
- aggregate change in actuarial present value of pension benefits |
$ | 0 | ||
+ service cost of pension benefits |
$ | 0 | ||
+ prior service cost of pension benefits |
$ | 0 | ||
- SCT “Stock Awards” column value |
($ | 506,029 | ) | |
- SCT “Option Awards” column value |
($ | 149,807 | ) | |
+year-end fair value of equity awards granted in the Covered Year that are outstanding and unvested as of the Covered Year-end |
$ | 579,221 | ||
+/- change in fair value (from prior year-end to Covered Year-end) of equity awards granted in prior years that are outstanding and unvested as of the Covered Year-end |
($ | 5,249 | ) | |
+ vesting date fair value of equity awards granted and vested in the Covered Year |
$ | 0 | ||
+/- change in fair value (from prior year-end to vesting date) of equity awards granted in prior years that vested in the Covered Year |
$ | 24,724 | ||
- fair value as of prior year end of equity awards granted in prior years that failed to vest in the Covered Year |
$ | 0 | ||
+ dollar value of dividends/earnings paid on equity awards in the Covered Year |
$ | 0 | ||
+ excess fair value for equity award modifications |
$ | 0 | ||
Average Compensation Actually Paid to Non-PEO NEOs (column (e)) |
$ | 1,185,614 | ||
| 3 | For each of 2025, 2024, 2023, 2022 and 2021, TSR for the Company and the peer group was calculated as the yearly percentage change in cumulative total shareholder return applied to a deemed fixed investment of $100 at market close on March 17, 2021, the day immediately prior to the first date on which the Company’s securities were registered under Section 12 of the Exchange Act. The yearly percentage change in cumulative TSR was measured as the quotient of (a) the sum of (i) the cumulative amount of dividends for the period from March 17, 2021, through and including the last day of the Covered Year (the “Measurement Period”), assuming dividend reinvestment, plus (ii) the difference between stock price per share at the end and the beginning of the Measurement Period, divided by (b) stock price per share at the beginning of the Measurement Period. For purposes of this PVP disclosure, our peer group is the S&P Small Cap 600 Materials index, which we use for purposes of the performance graph in our annual report (the “Peer Group”). Because fiscal years are presented in the table in reverse chronological order (from top to bottom), the table should be read from bottom to top for purposes of understanding cumulative returns over time. The Peer Group TSR for 2024 was updated from last year’s disclosure to correct an error. |
| 4 | EBITDA means earnings before income, taxes, depreciation and amortization for the consolidated Company. |
| 5 | Due to an administrative error last year, the compensation actually paid to the PEO in 2024 is restated from $17,555,705 to $14,860,919 to reflect the correction of the change in fair value (from prior year-end to covered year-end) of equity awards granted in prior years that were outstanding and unvested as of 2024 year-end. The recalculated amount of such change in fair value is $9,675,299 (reduced from $11,951,457 reported in last year’s proxy statement). Also due to such administrative error, the average compensation actually paid to the non-PEO NEOs in 2024 is restated from $2,827,411 to $2,594,132 to reflect: (a) the correction of the change in fair value (from prior year-end to covered year-end) of equity awards granted in prior years that were outstanding and unvested as of 2024 year-end - the recalculated amount of such change in fair value is $1,316,307 (reduced from $1,506,869 reported in last year’s proxy statement) and (b) the correction of the fair value as of prior year end of equity awards granted in prior years that failed to vest in 2024 (which fair value was subtracted from the Summary Compensation Table total as part of the calculation of compensation actually paid) - the recalculated amount of such fair value is $56,723 (changed from $14,006 reported in last year’s proxy statement). Other than the amounts described in this footnote, none of the additions or subtractions to the Summary Compensation Table amounts for 2024 disclosed in last year’s proxy statement were changed. |
non-PEO
NEOs were Jaime Vasquez and Brad Kalter. For 2024, our non-PEO
NEOs were Jaime Vasquez, Jeffrey Fieler, and Brad Kalter. For 2023, our non-PEO
NEOs were Lawrence Somma, Jeffrey Fieler and Brad Kalter. For 2022, our non-PEO
NEOs were Lawrence Somma, Brad Kalter and David Brenner. For 2021, our non-PEO
NEOs were Lawrence Somma, Michael Dee and Dustin Olson. In this disclosure, we refer to each of 2025, 2024, 2023, 2022 and 2021 as a “Covered Year.”
| 2 | For each of 2025, 2024, 2023, 2022 and 2021, the values included in this column for the CAP to our PEOs and the average CAP to our non-PEO NEOs reflect certain adjustments to the values included in column (b) and column (d), respectively. For 2025, those adjustments are as follows: |
PEO 1 (Dustin Olson) |
2025 ($) |
|||
Summary Compensation Table Total for PEO (column (b)) |
$ | 6,237,167 | ||
- aggregate change in actuarial present value of pension benefits |
($ | 0 | ) | |
+ service cost of pension benefits |
$ | 0 | ||
+ prior service cost of pension benefits |
$ | 0 | ||
- SCT “Stock Awards” column value |
($ | 4,548,019 | ) | |
- SCT “Option Awards” column value |
($ | 674,998 | ) | |
+year-end fair value of equity awards granted in the Covered Year that are outstanding and unvested as of the Covered Year-end |
$ | 2,609,816 | ||
+/- change in fair value (from prior year-end to Covered Year-end) of equity awards granted in prior years that are outstanding and unvested as of the Covered Year-end |
($ | 454,954 | ) | |
+ vesting date fair value of equity awards granted and vested in the Covered Year |
$ | 2,268,000 | ||
+/- change in fair value (from prior year-end to vesting date) of equity awards granted in prior years that vested in the Covered Year |
$ | 109,021 | ||
- fair value as of prior year end of equity awards granted in prior years that failed to vest in the Covered Year |
$ | 0 | ||
+ dollar value of dividends/earnings paid on equity awards in the Covered Year |
$ | 0 | ||
+ excess fair value for equity award modifications |
$ | 0 | ||
Compensation Actually Paid to PEO 1 (column (c)) |
$ | 5,546,033 | ||
AVERAGE FOR NON-PEO NEOS |
2025 ($) |
|||
Average SCT Total for Non-PEO NEOs (column (d)) |
$ | 1,242,753 | ||
- aggregate change in actuarial present value of pension benefits |
$ | 0 | ||
+ service cost of pension benefits |
$ | 0 | ||
+ prior service cost of pension benefits |
$ | 0 | ||
- SCT “Stock Awards” column value |
($ | 506,029 | ) | |
- SCT “Option Awards” column value |
($ | 149,807 | ) | |
+year-end fair value of equity awards granted in the Covered Year that are outstanding and unvested as of the Covered Year-end |
$ | 579,221 | ||
+/- change in fair value (from prior year-end to Covered Year-end) of equity awards granted in prior years that are outstanding and unvested as of the Covered Year-end |
($ | 5,249 | ) | |
+ vesting date fair value of equity awards granted and vested in the Covered Year |
$ | 0 | ||
+/- change in fair value (from prior year-end to vesting date) of equity awards granted in prior years that vested in the Covered Year |
$ | 24,724 | ||
- fair value as of prior year end of equity awards granted in prior years that failed to vest in the Covered Year |
$ | 0 | ||
+ dollar value of dividends/earnings paid on equity awards in the Covered Year |
$ | 0 | ||
+ excess fair value for equity award modifications |
$ | 0 | ||
Average Compensation Actually Paid to Non-PEO NEOs (column (e)) |
$ | 1,185,614 | ||
Tabular List
The following table lists the financial and
non-financial
performance measures that we believe are the most important measures we used to link compensation actually paid to our NEOs for fiscal 2025 to Company performance. EBITDA |
Revenue |
Operational Production |