Pay vs Performance Disclosure - USD ($)
|
12 Months Ended |
Dec. 31, 2025 |
Dec. 31, 2024 |
Dec. 31, 2023 |
Dec. 31, 2022 |
Dec. 31, 2021 |
| Pay vs Performance Disclosure |
|
|
|
|
|
| Pay vs Performance Disclosure, Table |
| | | | | | | | | | | | | | | | | | | | | | | | | | | | | | | | | | | | | | | | | | | | | | | | | | | | | | | | | | | | | | | | | | | | | | | | | Value of Initial Fixed $100
Investment Based On: | | | | Year | Summary Compensation Table Total for PEO Flanagan(1) ($) | Compensation Actually Paid to PEO Flanagan (1)(2) ($) | Summary Compensation Table Total for Former PEO Kessler(3) ($) | Compensation Actually Paid to Former PEO Kessler (3)(2) ($) | Summary Compensation Table Total for Former PEO Rintoul(4) ($) | Compensation Actually Paid to Former PEO Rintoul(4)(2) ($) | Average Summary Compensation Table Total for Non-PEO Named Executive Officers(5) ($) | Average Compensation Actually Paid to Non-PEO Named Executive Officers(5)(6) ($) | GrafTech
Total
Stockholder
Return | NYSE Arca
Steel Index
(TR)
Total
Stockholder
Return | Net
(Loss)
Income
(in
000s)
($) | Adjusted EBITDA(7) (in 000s) ($) | | 2025 | 2,042,500 | 1,837,326 | N/A | N/A | N/A | N/A | 1,065,091 | 764,312 | $15 | $237 | (219,835) | (9,088) | | 2024 | 3,023,506 | 2,393,131 | N/A | N/A | N/A | N/A | 1,494,232 | 1,393,696 | $16 | $162 | (131,165) | 1,632 | | 2023 | 1,535,021 | 808,453 | 3,521,684 | 674,631 | N/A | N/A | 1,423,584 | 727,028 | $21 | $196 | (255,250) | 20,484 | | 2022 | N/A | N/A | 1,407,268 | 1,153,710 | 1,406,150 | 1,405,993 | 1,538,305 | 1,097,819 | $45 | $148 | 382,962 | 536,464 | | 2021 | N/A | N/A | N/A | N/A | 3,445,257 | 4,377,435 | 6,471,272 | 6,656,296 | $111 | $129 | 388,330 | 669,940 |
|
|
|
|
|
| Company Selected Measure Name |
adjusted EBITDA
|
|
|
|
|
| Named Executive Officers, Footnote |
Mr. Flanagan was appointed Interim Chief Executive Officer and President as of November 15, 2023 and became our Chief Executive Officer and President on March 26, 2024. Mr. Flanagan previously served as our Chief Financial Officer, Senior Vice President Finance and Treasurer since November 29, 2021. Our principal executive officer is referred to as the “PEO” in this disclosure. Mr. Flanagan was one of our PEOs during 2023 and was our only PEO during 2024 and 2025. Mr. Kessler was one of our PEOs during each of 2023 and 2022. Mr. Kessler resigned from the Company as our Chief Executive Officer and President as of November 15, 2023. (4)Mr. David J. Rintoul was our only PEO during 2021, and one of our PEOs during 2022. Mr. Rintoul resigned from the Company as our Chief Executive Officer and President on June 30, 2022. (5)The identity of the non-PEO NEOs for each of 2025, 2024, 2023, 2022, and 2021 (each, a “Covered Year”) are as follows:
| | | | | | | | | Year | Non-PEO NEOs | | | | | | 2021 | Timothy K. Flanagan, Quinn J. Coburn, Jeremy S. Halford, Iñigo Perez Ortiz, Gina K. Gunning | | | | 2022 | Timothy K. Flanagan, Jeremy S. Halford, Iñigo Perez Ortiz, Gina K. Gunning | | | | 2023 | Catherine Hedoux-Delgado, Jeremy S. Halford, Iñigo Perez Ortiz, Gina K. Gunning | | | | 2024 | Rory F. O’Donnell, Catherine Hedoux-Delgado, Jeremy S. Halford, Iñigo Perez Ortiz, Gina K. Gunning | | 2025 | Rory F. O’Donnell, Jeremy J. Clemens, Jeremy S. Halford, Iñigo Perez Ortiz, Andrew J. Renacci |
|
|
|
|
|
| Adjustment To PEO Compensation, Footnote |
| | | | | | | 2025 | | Flanagan | | SCT Total Compensation | $2,042,500 | | | | Less: Stock Award Value Reported in SCT for the Covered Year | $(972,000) | | Less: Option Award Value Reported in SCT for the Covered Year | — | | Plus: Covered Year-End Fair Value for Stock Awards Granted in the Covered Year | $1,188,540 | | Change in Fair Value (from Prior Year-End to Covered Year-End) of Covered Year-End Outstanding Unvested Stock Awards Granted Prior to Covered Year | $(292,046) | | Change in Fair Value (from Prior Year-End to Vesting Date) of Stock Awards Granted Prior to Covered Year that Vested in the Covered Year | $(129,668) | | Fair Value as of the Vesting Date for Stock Awards Granted and Vested in the Covered Year | — | | Less: Prior Year-End Fair Value of Stock and Option Awards Forfeited in the Covered Year | — | | Compensation Actually Paid | $1,837,326 |
|
|
|
|
|
| Non-PEO NEO Average Total Compensation Amount |
$ 1,065,091
|
$ 1,494,232
|
$ 1,423,584
|
$ 1,538,305
|
$ 6,471,272
|
| Non-PEO NEO Average Compensation Actually Paid Amount |
$ 764,312
|
1,393,696
|
727,028
|
1,097,819
|
6,656,296
|
| Adjustment to Non-PEO NEO Compensation Footnote |
| | | | | | | 2025 | | Non-PEO
NEOs | | | | SCT Total Compensation | $1,065,091 | | | | Less: Stock Award Value Reported in SCT for the Covered Year | $(438,022) | | Less: Option Award Value Reported in SCT for the Covered Year | - | | Plus: Covered Year-End Fair Value for Stock Awards Granted in the Covered Year | $403,301 | | Change in Fair Value (from Prior Year-End to Covered Year-End) of Covered Year-End Outstanding Unvested Stock Awards Granted Prior to Covered Year | $(53,216) | | Change in Fair Value (from Prior Year-End to Vesting Date) of Stock Awards Granted Prior to Covered Year that Vested in the Covered Year | $(60,233) | | Fair Value as of the Vesting Date for Stock Awards Granted and Vested in the Covered Year | - | | Less: Prior Year-End Fair Value of Stock Awards Forfeited in the Covered Year | (152,609) | | Compensation Actually Paid | $764,312 |
|
|
|
|
|
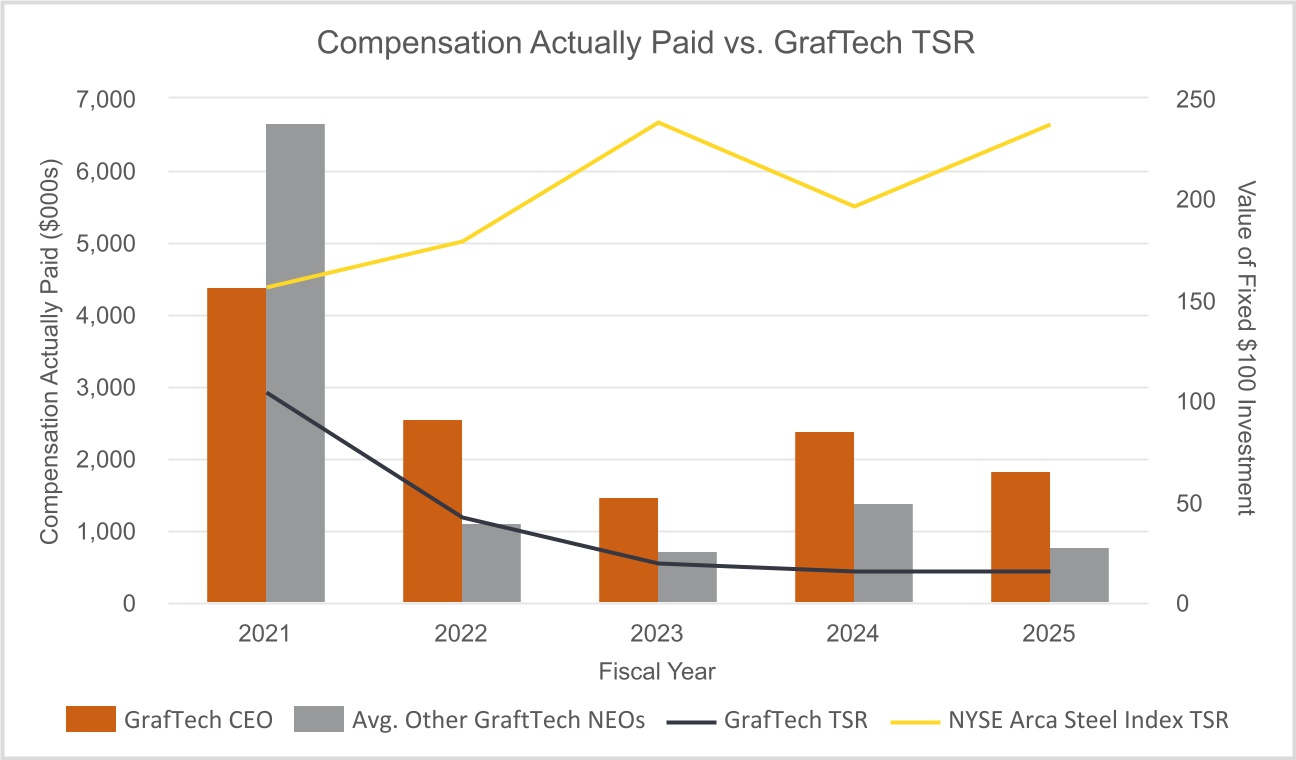
| Compensation Actually Paid vs. Total Shareholder Return |
|
|
|
|
|
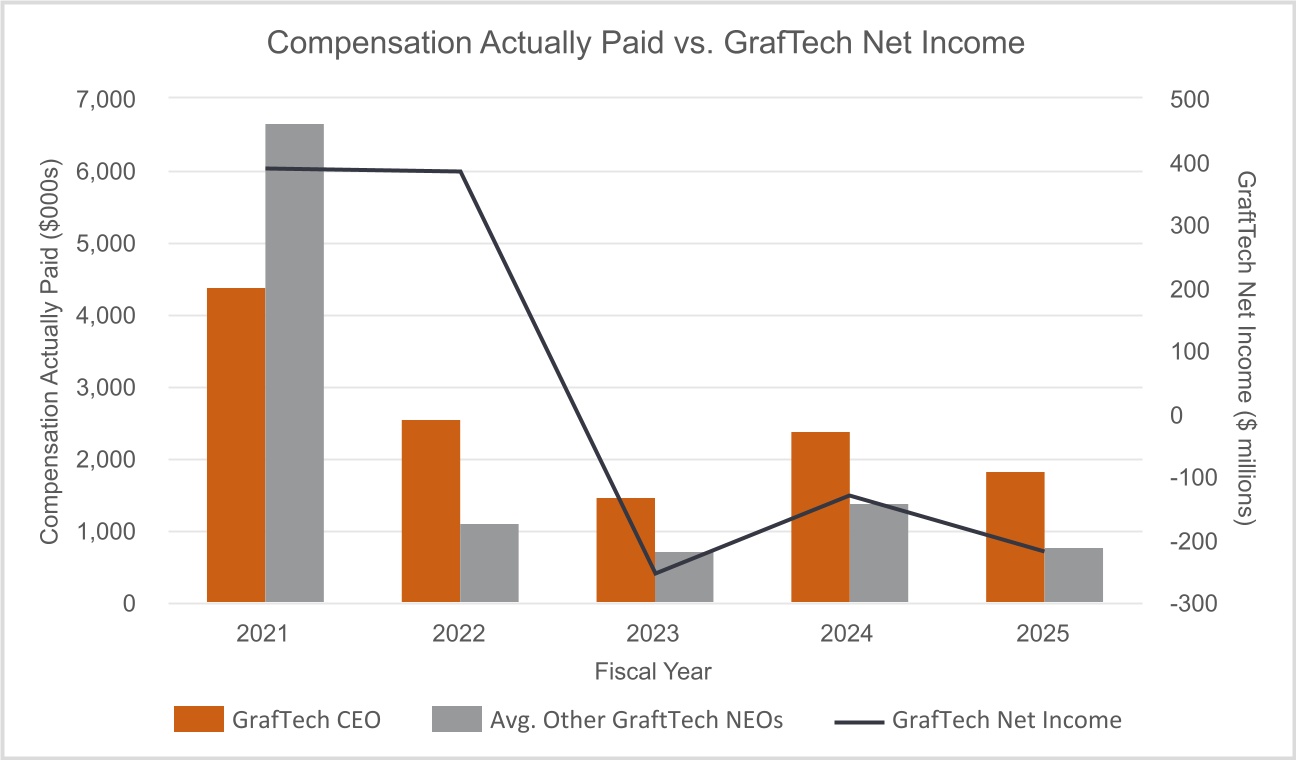
| Compensation Actually Paid vs. Net Income |
|
|
|
|
|
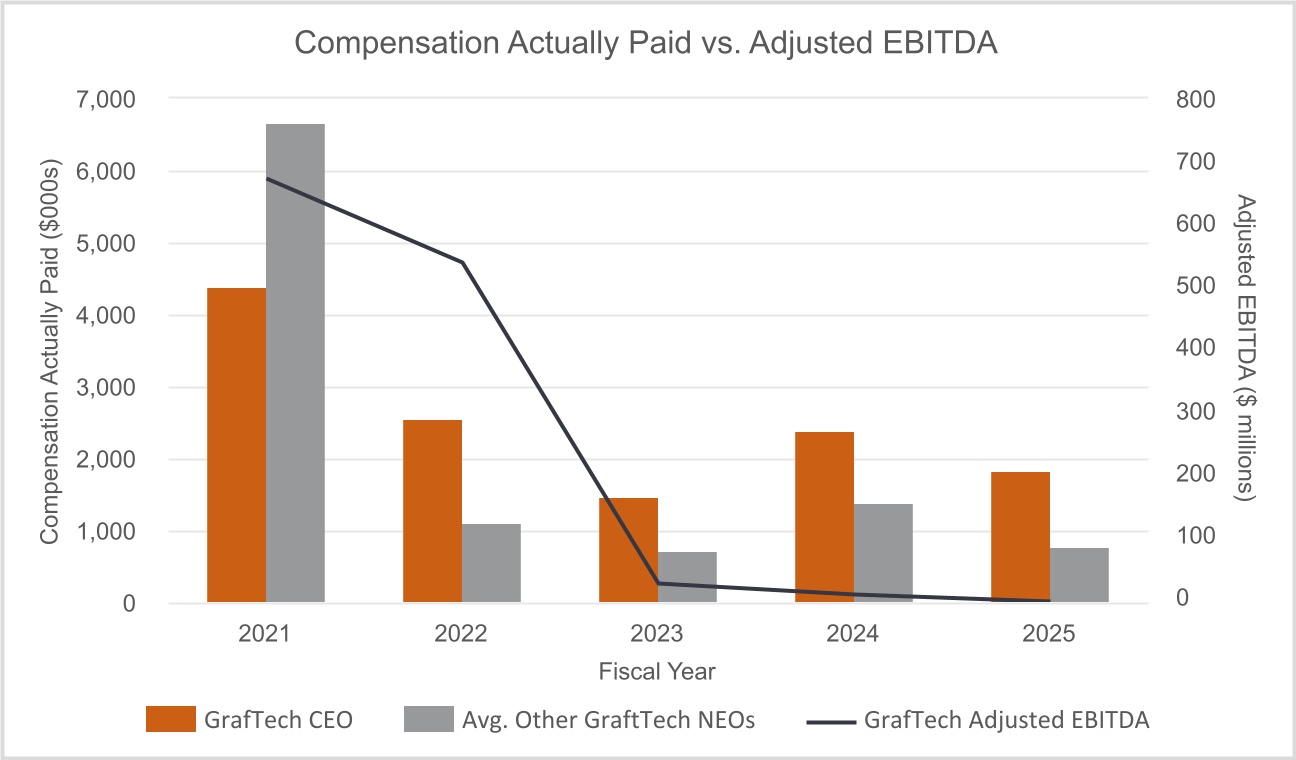
| Compensation Actually Paid vs. Company Selected Measure |
|
|
|
|
|
| Total Shareholder Return Vs Peer Group |
|
|
|
|
|
| Tabular List, Table |
| | | | | | | | | | | | | Performance Measure | Nature | Explanation | | | | | Adjusted EBITDA | Financial Measure | A non-GAAP financial measure. See “Appendix A” to this Proxy Statement for additional information, including how we define this financial measure and a reconciliation to Net (Loss) Income, the most directly comparable financial measure calculated and presented in accordance with U.S. GAAP. | | Adjusted Free Cash Flow | Financial Measure | A non-GAAP financial measure. See “Appendix A” to this Proxy Statement for additional information, including how we define this financial measure and a reconciliation to Net Cash (used in) Provided by Operating Activities, the most directly comparable financial measure calculated and presented in accordance with U.S. GAAP. | | Relative Total Shareholder Return | Financial Measure | Our PSUs are based on our relative total shareholder return achievement, with total shareholder return (measured by stock performance price and any dividends reinvested) for us compared against that for a peer group. |
|
|
|
|
|
| Total Shareholder Return Amount |
$ 15
|
16
|
21
|
45
|
111
|
| Peer Group Total Shareholder Return Amount |
237
|
162
|
196
|
148
|
129
|
| Net Income (Loss) |
$ (219,835,000)
|
$ (131,165,000)
|
$ (255,250,000)
|
$ 382,962,000
|
$ 388,330,000
|
| Company Selected Measure Amount |
(9,088,000)
|
1,632,000
|
20,484,000
|
536,464,000
|
669,940,000
|
| Additional 402(v) Disclosure |
“Compensation actually paid” to our CEO in 2025 reflects the respective amount set forth in the table above, adjusted as set forth in the table below, as determined in accordance with SEC rules. The dollar amount reflected in the table above does not reflect the actual amount of compensation earned by or paid to our CEO during 2025. For information regarding the decisions made by our Human Resources and Compensation Committee in regards to the CEO’s and each of our former CEOs’ compensation for each fiscal year, please see the “Compensation Discussion & Analysis” sections of the proxy statements reporting pay for the fiscal years covered in the table above. Please note that while similar adjustment information was provided in our 2025 proxy statement for Covered Years (as defined below) 2021, 2022, 2023 and 2024 under applicable SEC guidance, repeating such adjustment information is not required in this Proxy Statement because in our view it is not material to our stockholders’ understanding of the information reported in the Pay Versus Performance table above for 2025 or the relationships disclosures provided below. Average “compensation actually paid” for our non-PEO NEOs in 2025 reflects the respective amount set forth in the table above, adjusted as set forth in the table below, as determined in accordance with SEC rules. The dollar amount reflected in the table above does not reflect the actual amount of compensation earned by or paid to our non-PEO NEOs during 2025. For information regarding the decisions made by our Human Resources and Compensation Committee in regards to the non-PEO NEOs’ compensation for each fiscal year, please see the “Compensation Discussion & Analysis” sections of the proxy statements reporting pay for the fiscal years covered in the table above. Please note that while similar adjustment information was provided in our 2025 proxy statement for Covered Years 2021, 2022, 2023, and 2024 under applicable SEC guidance, repeating such adjustment information is not required in this Proxy Statement because in our view it is not material to our stockholders’ understanding of the information reported in the Pay Versus Performance table above for 2025 or the relationships disclosures provided below.
|
|
|
|
|
| Measure:: 1 |
|
|
|
|
|
| Pay vs Performance Disclosure |
|
|
|
|
|
| Name |
Adjusted EBITDA
|
|
|
|
|
| Non-GAAP Measure Description |
A non-GAAP financial measure. See “Appendix A” to this Proxy Statement for additional information, including how we define this financial measure and a reconciliation to Net (Loss) Income, the most directly comparable financial measure calculated and presented in accordance with U.S. GAAP.
|
|
|
|
|
| Measure:: 2 |
|
|
|
|
|
| Pay vs Performance Disclosure |
|
|
|
|
|
| Name |
Adjusted Free Cash Flow
|
|
|
|
|
| Measure:: 3 |
|
|
|
|
|
| Pay vs Performance Disclosure |
|
|
|
|
|
| Name |
Relative Total Shareholder Return
|
|
|
|
|
| Flanagan [Member] |
|
|
|
|
|
| Pay vs Performance Disclosure |
|
|
|
|
|
| PEO Total Compensation Amount |
$ 2,042,500
|
$ 3,023,506
|
$ 1,535,021
|
|
|
| PEO Actually Paid Compensation Amount |
$ 1,837,326
|
$ 2,393,131
|
808,453
|
|
|
| PEO Name |
Mr. Flanagan
|
Mr. Flanagan
|
|
|
|
| Kessler [Member] |
|
|
|
|
|
| Pay vs Performance Disclosure |
|
|
|
|
|
| PEO Total Compensation Amount |
|
|
3,521,684
|
$ 1,407,268
|
|
| PEO Actually Paid Compensation Amount |
|
|
$ 674,631
|
$ 1,153,710
|
|
| PEO Name |
|
|
Mr. Kessler
|
Mr. Kessler
|
|
| David J. Rintoul [Member] |
|
|
|
|
|
| Pay vs Performance Disclosure |
|
|
|
|
|
| PEO Total Compensation Amount |
|
|
|
$ 1,406,150
|
$ 3,445,257
|
| PEO Actually Paid Compensation Amount |
|
|
|
$ 1,405,993
|
$ 4,377,435
|
| PEO Name |
|
|
|
|
Mr. David J. Rintoul
|
| PEO | Flanagan [Member] | Year-end Fair Value of Equity Awards Granted in Covered Year that are Outstanding and Unvested |
|
|
|
|
|
| Pay vs Performance Disclosure |
|
|
|
|
|
| Adjustment to Compensation, Amount |
$ 1,188,540
|
|
|
|
|
| PEO | Flanagan [Member] | Year-over-Year Change in Fair Value of Equity Awards Granted in Prior Years That are Outstanding and Unvested |
|
|
|
|
|
| Pay vs Performance Disclosure |
|
|
|
|
|
| Adjustment to Compensation, Amount |
(292,046)
|
|
|
|
|
| PEO | Flanagan [Member] | Vesting Date Fair Value of Equity Awards Granted and Vested in Covered Year |
|
|
|
|
|
| Pay vs Performance Disclosure |
|
|
|
|
|
| Adjustment to Compensation, Amount |
0
|
|
|
|
|
| PEO | Flanagan [Member] | Change in Fair Value as of Vesting Date of Prior Year Equity Awards Vested in Covered Year |
|
|
|
|
|
| Pay vs Performance Disclosure |
|
|
|
|
|
| Adjustment to Compensation, Amount |
(129,668)
|
|
|
|
|
| PEO | Flanagan [Member] | Prior Year End Fair Value of Equity Awards Granted in Any Prior Year that Fail to Meet Applicable Vesting Conditions During Covered Year |
|
|
|
|
|
| Pay vs Performance Disclosure |
|
|
|
|
|
| Adjustment to Compensation, Amount |
0
|
|
|
|
|
| PEO | Flanagan [Member] | Stock Award Values Reported In SCT For The Covered Year [Member] |
|
|
|
|
|
| Pay vs Performance Disclosure |
|
|
|
|
|
| Adjustment to Compensation, Amount |
(972,000)
|
|
|
|
|
| PEO | Flanagan [Member] | Option Award Values Reported in SCT for the Covered Year [Member] |
|
|
|
|
|
| Pay vs Performance Disclosure |
|
|
|
|
|
| Adjustment to Compensation, Amount |
0
|
|
|
|
|
| Non-PEO NEO | Year-end Fair Value of Equity Awards Granted in Covered Year that are Outstanding and Unvested |
|
|
|
|
|
| Pay vs Performance Disclosure |
|
|
|
|
|
| Adjustment to Compensation, Amount |
403,301
|
|
|
|
|
| Non-PEO NEO | Year-over-Year Change in Fair Value of Equity Awards Granted in Prior Years That are Outstanding and Unvested |
|
|
|
|
|
| Pay vs Performance Disclosure |
|
|
|
|
|
| Adjustment to Compensation, Amount |
(53,216)
|
|
|
|
|
| Non-PEO NEO | Vesting Date Fair Value of Equity Awards Granted and Vested in Covered Year |
|
|
|
|
|
| Pay vs Performance Disclosure |
|
|
|
|
|
| Adjustment to Compensation, Amount |
0
|
|
|
|
|
| Non-PEO NEO | Change in Fair Value as of Vesting Date of Prior Year Equity Awards Vested in Covered Year |
|
|
|
|
|
| Pay vs Performance Disclosure |
|
|
|
|
|
| Adjustment to Compensation, Amount |
(60,233)
|
|
|
|
|
| Non-PEO NEO | Prior Year End Fair Value of Equity Awards Granted in Any Prior Year that Fail to Meet Applicable Vesting Conditions During Covered Year |
|
|
|
|
|
| Pay vs Performance Disclosure |
|
|
|
|
|
| Adjustment to Compensation, Amount |
(152,609)
|
|
|
|
|
| Non-PEO NEO | Stock Award Values Reported In SCT For The Covered Year [Member] |
|
|
|
|
|
| Pay vs Performance Disclosure |
|
|
|
|
|
| Adjustment to Compensation, Amount |
(438,022)
|
|
|
|
|
| Non-PEO NEO | Option Award Values Reported in SCT for the Covered Year [Member] |
|
|
|
|
|
| Pay vs Performance Disclosure |
|
|
|
|
|
| Adjustment to Compensation, Amount |
$ 0
|
|
|
|
|