The bar chart and performance table below show the variability of the Fund’s returns, which is some indication of the risks of investing in the Fund. The bar chart shows the performance of the Fund’s Class I shares for the last five calendar years. Returns for Class A shares, which are not presented in the bar chart, will vary from the return for the Class I shares to the extent the expenses of such classes differ. The performance table compares the performance of the Fund’s Class I and Class A shares over time to the performance of the Russell 3000 Index, a broad-based securities index, and the Russell 2500 Index, an index more representative of the Fund’s investment strategy. You should be aware that the Fund’s past performance (before and after taxes) may not be an indication of how the Fund will perform in the future. Performance reflects expense reimbursements in effect. If expense reimbursements were not in place, the Fund’s performance would be reduced. Updated performance information is available at no cost by calling 1-888-9-COPELAND (1-888-926-7352).
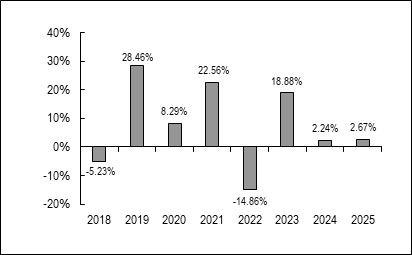
| Best Quarter: | 6/30/2020 | 19.07% |
| Worst Quarter: | 3/31/2020 | (24.02)% |
| Class I Shares | One
Year |
Five
Years |
Since
Inception of the Class(1) |
| Return before taxes | 2.67% | 5.42% | 7.58% |
| Return after taxes on distributions | 1.81% | 4.57% | 6.87% |
| Return after taxes on distributions and sale of Fund Shares | 1.99% | 4.10% | 5.96% |
| Class A Shares | |||
| Return before taxes | (3.38)% | 3.94% | 6.26% |
| Russell 3000 Total Return Index(2) | 17.15% | 13.15% | 13.97%(4) 15.47%(5) |
| Russell 2500 Total Return Index(3) | 11.91% | 7.26% | 9.21%(4) 9.97%(5) |
| (1) | The inception date of the Fund’s Class I shares is February 27, 2017. The inception date of the Fund’s Class A shares is February 11, 2019. |
| (2) | The Russell 3000 Total Return Index measures the performance of the largest 3000 U.S. companies designed to represent approximately 98% of the investable U.S. equity market. The Index is constructed to provide a comprehensive, unbiased and stable barometer of the broad U.S. equity market and is completely reconstituted annually to ensure new and growing equities are included. An investor cannot invest directly in an index. |
| (3) | The Russell 2500 Total Return Index measures the performance of the small to mid-cap segment of the U.S. equity universe, commonly referred to as “smid” cap. The Russell 2500 Index is a subset of the Russell 3000 Index. It includes approximately 2500 of the smallest securities based on a combination of their market cap and current index membership. The Russell 2500 Index is constructed to provide a comprehensive and unbiased barometer for the small to mid-cap segment. The index is completely reconstituted annually to ensure larger stocks do not distort the performance and characteristics of the true small to mid-cap opportunity set. Investors cannot invest directly in an index or benchmark. |
| (4) | Since the date of Class I shares inception, February 27, 2017. |
| (5) | Since the date of Class A shares inception, February 11, 2019. |
After-tax returns are calculated using the highest historical individual federal marginal income tax rate and do not reflect the impact of state and local taxes. Actual after-tax returns depend on a shareholder’s tax situation and may differ from those shown. The after-tax returns are not relevant if you hold your Fund shares in tax-deferred arrangements, such as 401(k) plans or individual retirement accounts (“IRA”).
For important information about purchase and sale of fund shares, tax information, and payments to broker-dealers and other financial intermediaries, please turn to “How to Purchase Shares” starting on page [29] of this prospectus.
The bar chart and performance table below show the variability of the Fund’s returns, which is some indication of the risks of investing in the Fund. The bar chart shows the performance of the Fund’s Class A shares for the last ten calendar years. Returns for Class C shares and Class I shares, which are not presented in the bar chart, will vary from the return for the Class A shares to the extent the expenses of such classes differ. The performance table compares the performance of the Fund’s Class A, Class C and Class I shares over time to the performance of a broad-based market index. You should be aware that the Fund’s past performance (before and after taxes) may not be an indication of how the Fund will perform in the future. Performance reflects expense reimbursements in effect. If expense reimbursements were not in place, the Fund’s performance would be reduced. Updated performance information is available at no cost by calling 1-888-9-COPELAND (1-888-926-7352).
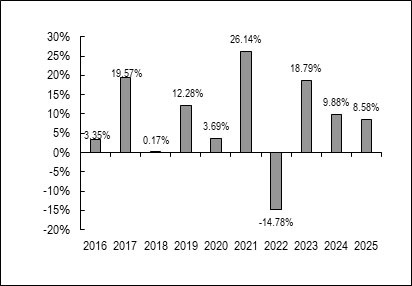
| Best Quarter: | 12/31/2023 | 11.82% |
| Worst Quarter: | 3/31/2020 | (19.97)% |
| Class A Shares | One
Year |
Five Years |
Ten Years |
| Return before taxes | 2.33% | 7.51% | 7.55% |
| Return after taxes on distributions | 0.26% | 5.30% | 5.51% |
| Return after taxes on distributions and sale of Fund shares(1) | 2.88% | 5.61% | 5.63% |
| Class C Shares | |||
| Return before taxes | 7.75% | 7.98% | 7.37% |
| Class I Shares | |||
| Return before taxes | 8.75% | 8.96% | 8.35% |
| Russell 3000 Total Return Index(2) | 17.15% | 13.15% | 14.29% |
| S&P 500® Index(3) | 17.88% | 14.42% | 14.82% |
| (1) | In certain cases, the Return after taxes on distributions and sale of the Fund shares for a period may be higher than other return figures for the same period. This will occur when a capital loss is realized upon the sale of the Fund shares and provides an assumed tax benefit that increases the return. |
| (2) | The Russell 3000 Total Return Index measures the performance of the largest 3000 U.S. companies designed to represent approximately 98% of the investable U.S. equity market. The Index is constructed to provide a comprehensive, unbiased and stable barometer of the broad U.S. equity market and is completely reconstituted annually to ensure new and growing equities are included. An investor cannot invest directly in an index. |
| (3) | The S&P 500® Index is widely regarded as the best single gauge of large-cap U.S. equities. The index includes 500 leasing companies and covers approximately 80% of available market capitalization. An investor cannot invest directly in an index. |
After-tax returns above are shown for Class A shares of the Fund; after-tax returns for the Fund’s Class C and Class I shares will vary. After-tax returns are calculated using the highest historical individual federal marginal income tax rate and do not reflect the impact of state and local taxes. Actual after-tax returns depend on a shareholder’s tax situation and may differ from those shown. The after-tax returns are not relevant if you hold your Fund shares in tax-deferred arrangements, such as 401(k) plans or individual retirement accounts (“IRA”).
For important information about purchase and sale of fund shares, tax information, and payments to broker-dealers and other financial intermediaries, please turn to “How to Purchase Shares” starting on page [29] of this prospectus.
The bar chart and performance table below show the variability of the Fund’s returns, which is some indication of the risks of investing in the Fund. The bar chart shows the performance of the Fund’s Class I shares for the first calendar year. Returns for Class A shares, which are not presented in the bar chart, will vary from the return for the Class I shares to the extent the expenses of such classes differ. The performance table compares the performance of the Fund’s Class I and Class A shares over time to the performance of the MSCI World ex USA Index, a broad-based securities index, and the MSCI World ex USA Small Cap Index, an index more representative of the Fund’s investment strategy. You should be aware that the Fund’s past performance (before and after taxes) may not be an indication of how the Fund will perform in the future. Performance reflects expense reimbursements in effect. If expense reimbursements were not in place, the Fund’s performance would be reduced. Updated performance information is available at no cost by calling 1-888-9-COPELAND (1-888-926-7352).
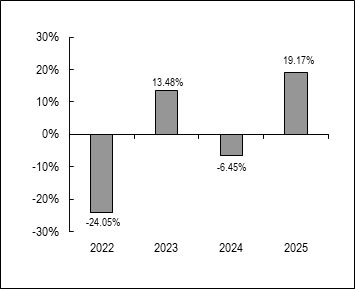
| Best Quarter: | 6/30/2025 | 14.67% |
| Worst Quarter: | 6/30/2022 | (15.70)% |
| Class I Shares | One Year | Since
Inception of the Class(1) |
| Return before taxes | 19.17% | (0.94)% |
| Return after taxes on distributions | 18.98% | (1.27)% |
| Return after taxes on distributions and sale of Fund Shares(2) | 11.93% | (0.60)% |
| Class A Shares | ||
| Return before taxes | 11.96% | (2.53)% |
| MSCI World ex USA Index(3) | 31.85% | 8.74% |
| MSCI World Index ex USA Small Cap Net Index(4) | 29.26% | 5.68% |
| (1) | The inception date of the Fund’s Class I shares and Class A shares is December 28, 2021. |
| (2) | In certain cases, the Return after taxes on distributions and sale of Fund shares for a period may be higher than other return figures for the same period. This will occur when a capital loss is realized upon the sale of fund shares and provides an assumed tax benefit that increases the return. |
| (3) | The MSCI World ex USA Index captures large and mid cap representation across 22 of 23 Developed Markets (DM) countries (excluding the United States). With 775 constituents, the index covers approximately 85% of the free float-adjusted market capitalization in each country. DM countries include: Australia, Austria, Belgium, Canada, Denmark, Finland, France, Germany, Hong Kong, Ireland, Israel, Italy, Japan, Netherlands, New Zealand, Norway, Portugal, Singapore, Spain, Sweden, Switzerland and the UK. |
| (4) | The MSCI World ex USA Small Cap Net Index captures small cap representation across 22 of 23 Developed Markets (DM) countries (excluding the United States). With 2,172 constituents, the index covers approximately 14% of the free float-adjusted market capitalization in each country. |
After-tax returns are calculated using the highest historical individual federal marginal income tax rate and do not reflect the impact of state and local taxes. Actual after-tax returns depend on a shareholder’s tax situation and may differ from those shown. The after-tax returns are not relevant if you hold your Fund shares in tax-deferred arrangements, such as 401(k) plans or individual retirement accounts (“IRA”).
For important information about purchase and sale of fund shares, tax information, and payments to broker-dealers and other financial intermediaries, please turn to “How to Purchase Shares” starting on page [29] of this prospectus.