The bar chart illustrates the risks of investing in the Micro Cap Fund by showing how the Micro Cap Fund’s average annual returns for each calendar year since the Micro Cap Fund’s inception compare with those of certain indexes. In addition to the Fund’s performance, the Average Annual Total Returns table includes performance of: (i) a broad-based securities market index (i.e., a regulatory index) and (ii) a supplemental index. It is not possible to invest directly in an unmanaged index. The Micro Cap Fund is the successor to the Kuby Gottlieb Special Value Fund, L.P. (the “Predecessor Micro Cap Fund”), which transferred its assets to the Micro Cap Fund in connection with the Micro Cap Fund’s commencement of operations on May 31, 2013. Past performance, both before and after taxes, does not necessarily indicate how the Micro Cap Fund will perform in the future. Updated performance information is available on the Micro Cap Fund’s website at www.nsinvestfunds.com or by calling the Micro Cap Fund toll-free at 1-855-580-0900. Because Class R shares have not commenced investment operations, no performance information is available at this time. In the future, performance information will be presented in this section of the Prospectus.
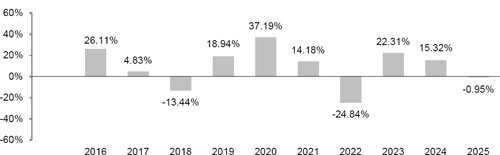
During the period shown in the bar chart, the best performance for a quarter was 42.21% (for the quarter ended June 30, 2020). The worst performance was -30.93% (for the quarter ended March 31, 2020).
| One Year | Five Years | Ten Years | |
| Class I Shares | |||
| Return Before Taxes | (0.95)% | 3.70% | 8.39% |
| Return After Taxes on Distributions | (1.89)% | 3.15% | 7.74% |
| Return After Taxes on Distributions and Sale of Fund Shares | (0.05)% | 2.83% | 6.71% |
| S&P
500 Total Return Index (reflects no deduction for fees, expenses or taxes) |
17.88% | 14.42% | 14.82% |
| Morningstar
US Small Value TR USD Index (reflects no deduction for fees, expenses or taxes) |
11.84% | 11.59% | 9.26% |
After tax returns depend on an investor’s tax situation and may differ from those shown. After tax returns are calculated using the historical highest individual federal marginal income tax rates in effect and do not reflect the effect of state and local taxes. The after-tax returns shown may not be relevant to those investors who hold their shares through tax-deferred arrangements such as 401(k) plans or individual retirement accounts (“IRAs”). “Return After Taxes on Distributions” shows the effect of taxable distributions (dividends and capital gains distributions) but assumes that Micro Cap Fund shares are still held at the end of the period.
The S&P 500 Total Return Index, a widely accepted, unmanaged index of U.S. stock market performance, is the Fund’s regulatory index. The Fund’s regulatory index is shown in connection with certain regulatory requirements to provide a broad measure of market performance. The index does not take into account charges, fees and other expenses.
The Morningstar US Small Value TR USD Index, which is designed to provide consistent representation of the small-cap value segment of the US equity market, with no overlapping constituents across styles, is a supplemental index of the Fund.
The bar chart illustrates the risks of investing in the Dividend Fund by showing how the Dividend Fund’s average annual returns for each calendar year since the Dividend Fund’s inception compare with those of certain indexes. In addition to the Fund’s performance, the Average Annual Total Returns table includes performance of: (i) a broad-based securities market index (i.e., a regulatory index) and (ii) a supplemental index. It is not possible to invest directly in an unmanaged index. The Dividend Fund’s past performance, before and after taxes, is not an indication of how the Dividend Fund will perform in the future. The Dividend Fund is the successor to the North Star Dividend Fund, L.P. (the “Predecessor Dividend Fund”), which transferred its assets to the Dividend Fund in connection with the Dividend Fund’s commencement of operations on May 31, 2013. Updated performance information is available on the Dividend Fund’s website at www.nsinvestfunds.com or by calling the Dividend Fund toll-free at 1-855-580-0900. Because Class R shares have not commenced investment operations no performance information is available at this time. In the future, performance information will be presented in this section of the Prospectus.
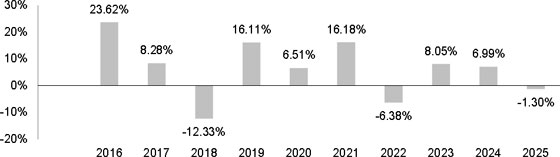
During the period shown in the bar chart, the best performance for a quarter was 21.88% (for the quarter ended December 31, 2020). The worst performance was -26.04% (for the quarter ended March 31, 2020).
| One Year | Five Years | Ten Years | |
| Class I Shares | |||
| Return Before Taxes | (1.30)% | 4.41% | 6.06% |
| Return After Taxes on Distributions | (2.10)% | 3.35% | 5.02% |
| Return After Taxes on Distributions and Sale of Fund Shares | (0.21)% | 3.32% | 4.65% |
| S&P
500 Total Return Index (reflects no deduction for fees, expenses or taxes) |
17.88% | 14.42% | 14.82% |
| Morningstar
US Small Value TR USD Index (reflects no deduction for fees, expenses or taxes) |
11.84% | 11.59% | 9.26% |
After tax returns depend on an investor’s tax situation and may differ from those shown. After tax returns are calculated using the historical highest individual federal marginal income tax rates in effect and do not reflect the effect of state and local taxes. The after-tax returns shown may not be relevant to those investors who hold their shares through tax-deferred arrangements such as 401(k) plans or individual retirement accounts (“IRAs”). “Return After Taxes on Distributions” shows the effect of taxable distributions (dividends and capital gains distributions) but assumes that Dividend Fund shares are still held at the end of the period.
The S&P 500 Total Return Index. a widely accepted, unmanaged index of U.S. stock market performance, is the Fund’s regulatory index. The Fund’s regulatory index is shown in connection with certain regulatory requirements to provide a broad measure of market performance. The index does not take into account charges, fees and other expenses.
The Morningstar US Small Value TR USD Index, which is designed to provide consistent representation of the small-cap value segment of the US equity market, with no overlapping constituents across styles, is a supplemental index of the Fund.
The bar chart illustrates the risks of investing in the Opportunity Fund by showing how the Opportunity Fund’s average annual returns for each calendar year since the Opportunity Fund’s inception compare with those of a broad measure of market performance. The Opportunity Fund is the successor to the North Star Opportunity Fund, L.P. (the “Predecessor Opportunity Fund”), which transferred its assets to the Opportunity Fund in connection with the Opportunity Fund’s commencement of operations on May 31, 2013. Past performance, both before and after taxes, does not necessarily indicate how the Opportunity Fund will perform in the future. Updated performance information is available on the Opportunity Fund’s website at www.nsinvestfunds.com or by calling the Opportunity Fund toll-free at 1-855-580-0900. Because Class R shares have not commenced investment operations, no performance information is available at this time. In the future, performance information will be presented in this section of the Prospectus.
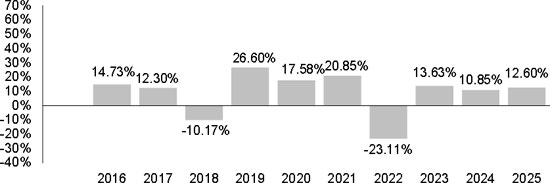
| 1 | The returns shown in the bar chart are for Class I shares. The performance of Class A shares will differ due to differences in expenses and sales load charges. |
During the period shown in the bar chart, the best performance for a quarter was 21.48% (for the quarter ended June 30, 2020). The worst performance was -20.16% (for the quarter ended March 31, 2020).
| One Year | Five Years | Ten Years | |
| Class I Shares | |||
| Return Before Taxes | 12.60% | 5.68% | 8.55% |
| Return After Taxes on Distributions | 10.96% | 4.69% | 7.66% |
| Return After Taxes on Distributions and Sale of Fund Shares | 8.51% | 4.31% | 6.74% |
| Class A Shares* | |||
| Return Before Taxes | 5.85% | 4.16% | 7.65% |
| S&P
500 Total Return Index (reflects no deduction for fees, expenses or taxes) |
17.88% | 14.42% | 14.82% |
| S&P
Target Risk Aggressive Index (reflects no deduction for fees, expenses or taxes) |
19.75% | 9.31% | 9.97% |
| S&P 500 Target Risk Balanced Index | 16.59% | 7.05% | 8.14% |
| * | Class A shares commenced operations on December 15, 2011. |
After-tax returns are based on the highest historical individual federal marginal income tax rates, and do not reflect the impact of state and local taxes; actual after-tax returns depend on an individual investor’s tax situation and may differ from those shown. If you own shares of the Opportunity Fund in a tax-deferred account, such as an individual retirement account or a 401(k) plan, this information is not applicable to your investment. A higher after-tax return results when a capital loss occurs upon redemption and translates into an assumed tax deduction that benefits the shareholder. After tax returns are shown for only for Class I Shares and after tax returns for Class A Shares will vary.
The S&P 500 Total Return Index is a widely accepted, unmanaged index of U.S. stock market performance which does not take into account charges, fees and other expenses.
The S&P Target Risk Aggressive Index is designed to measure the performance of aggressive stock-bond allocations to equities, seeking to maximize opportunities for long-term capital accumulation. It may include small allocations to fixed income to enhance portfolio efficiency.
The S&P Target Risk Balanced Index is designed to measure the performance of equity allocations, while seeking to provide limited fixed income exposure to diversify risk.
The bar chart illustrates the risks of investing in the Bond Fund by showing how the Bond Fund’s average annual returns for each calendar year since the Bond Fund’s inception compare with those of certain indexes. In addition to the Fund’s performance, the Average Annual Total Returns table includes performance of: (i) a broad-based securities market index (i.e., a regulatory index) and (ii) a supplemental index. It is not possible to invest directly in an unmanaged index. The Bond Fund’s past performance, before and after taxes, is not an indication of how the Bond Fund will perform in the future. Past performance, both before and after taxes, does not necessarily indicate how the Bond Fund will perform in the future. Updated performance information is available on the Bond Fund’s website at www.nsinvestfunds.com or by calling the Bond Fund toll-free at 1-855-580-0900.
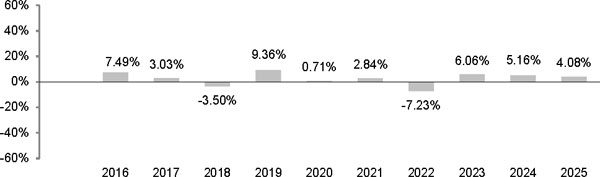
During the period shown in the bar chart, the best performance for a quarter was 6.97% (for the quarter ended June 30, 2020). The worst performance was -11.18% (for the quarter ended March 31, 2020).
| One Year |
Five
Years |
Ten Years | |
| Class I Shares | |||
| Return Before Taxes | 4.08% | 2.06% | 2.69% |
| Return After Taxes on Distributions | 2.35% | 0.71% | 1.36% |
| Return After Taxes on Distributions and Sale of Fund Shares | 2.39% | 1.03% | 1.53% |
| Bloomberg
U.S. Aggregate Bond Index (reflects no deduction for fees, expenses or taxes) |
7.30% | -0.36% | 2.01% |
| Bloomberg
Barclays Ba/B U.S. High Yield Index TR (reflects no deduction for fees, expenses or taxes) |
8.78% | 4.12% | 6.17% |
After-tax returns are based on the highest historical individual federal marginal income tax rates, and do not reflect the impact of state and local taxes; actual after-tax returns depend on an individual investor’s tax situation and may differ from those shown. If you own shares of the Bond Fund in a tax-deferred account, such as an individual retirement account or a 401(k) plan, this information is not applicable to your investment. A higher after-tax return results when a capital loss occurs upon redemption and translates into an assumed tax deduction that benefits the shareholder.
The Bloomberg US Aggregate Bond Index, a market capitalization-weighted index that measures the investment grade, US dollar denominated, fixed-rate taxable bond market, is the Fund’s regulatory index. The Fund’s regulatory index is shown in connection with certain regulatory requirements to provide a broad measure of market performance. The index does not take into account charges, fees and other expenses.
The Bloomberg Barclays Ba/B U.S. High Yield Index TR, which measures the performance of U.S. dollar-denominated, high yield bonds with Ba or B ratings, is a supplemental index of the Fund.
The following performance information provides some indication of the risks of investing in the Small Cap Value Fund. The Small Cap Value Fund is the successor to the Walthausen Small Cap Value Fund, a series of Walthausen Funds (the “Predecessor Small Cap Fund”), a mutual fund with substantially similar investment objectives, policies, and restrictions, as a result of the reorganization of the Predecessor Small Cap Fund into the Small Cap Value Fund on May 12, 2023. The performance provided in the bar chart and table prior to May 12, 2023, is that of the Predecessor Small Cap Fund. The bar chart illustrates how the Small Cap Value Fund’s (and Predecessor Small Cap Fund’s) average annual returns have varied from year to year for the past ten calendar years. The table below illustrates how the Small Cap Value Fund’s (Predecessor Small Cap Fund’s) average annual total returns over time compare with certain indexes. In addition to the Fund’s performance, the Average Annual Total Returns table includes performance of: (i) a broad-based securities market index (i.e., a regulatory index) and (ii) a supplemental index. It is not possible to invest directly in an unmanaged index. The Small Cap Value Fund’s (and Predecessor Small Cap Fund’s) past performance, before and after taxes, is not necessarily an indication of how the Small Cap Value Fund will perform in the future. Updated performance information is available on the Small Cap Value Fund’s website at www.nsinvestfunds.com or by calling the Small Cap Value Fund toll-free at 1-855-580-0900.
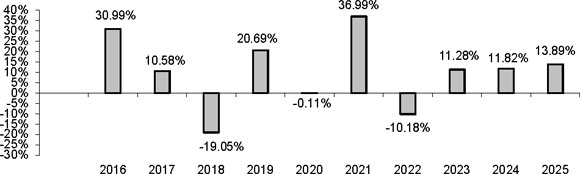
| 1 | The returns shown in the bar chart are for Investor Class shares. The performance of Institutional Class shares will differ due to differences in expenses. |
During the period shown in the bar chart, the best performance for a quarter was 27.27% (for the quarter ended December 31, 2020). The worst performance was -34.21% (for the quarter ended March 31, 2020).
| One Year |
Five Years |
Ten Years | |
| Investor Class | |||
| Return Before Taxes | 13.89% | 11.76% | 9.44% |
| Return After Taxes on Distributions | 10.72% | 7.04% | 6.51% |
| Return After Taxes on Distributions and Sale of Fund Shares | 10.48% | 8.17% | 6.92% |
| Institutional Class Shares* | |||
| Return Before Taxes | 14.14% | 11.99% | — |
| S&P
500 Total Return Index (reflects no deduction for fees, expenses or taxes) |
17.88% | 14.42% | 14.82% |
| Morningstar
US Small Value TR USD Index (reflects no deduction for fees, expenses or taxes) |
11.84% | 11.59% | 9.26% |
| * | Institutional Class shares commenced operations on December 31, 2018. |
After tax returns depend on an investor’s tax situation and may differ from those shown. After tax returns are calculated using the historical highest individual federal marginal income tax rates in effect and do not reflect the effect of state and local taxes. The after-tax returns shown may not be relevant to those investors who hold their shares through tax-deferred arrangements such as 401(k) plans or individual retirement accounts (“IRAs”). “Return After Taxes on Distributions” shows the effect of taxable distributions (dividends and capital gains distributions) but assumes that Fund shares are still held at the end of the period. After tax returns are shown for only Investor Class shares and after tax returns for Institutional Class shares will vary.
The S&P 500 Total Return Index, a widely accepted, unmanaged index of U.S. stock market performance, is the Fund’s regulatory index. The Fund’s regulatory index is shown in connection with certain regulatory requirements to provide a broad measure of market performance. The index does not take into account charges, fees and other expenses.
The Morningstar US Small Value TR USD Index, which is designed to provide consistent representation of the small-cap value segment of the US equity market, with no overlapping constituents across styles, is a supplemental index of the Fund.