Pay vs Performance Disclosure
Dec. 31, 2025
Oct. 01, 2025
Dec. 31, 2025
USD ($)
$ / shares
Dec. 31, 2024
USD ($)
$ / shares
Dec. 31, 2023
USD ($)
$ / shares
Dec. 31, 2022
USD ($)
$ / shares
Dec. 31, 2021
USD ($)
$ / shares
| | | | | | | | | | | | | | | | | | | | | | | | | | | | Average SCT Total for Non-PEO NEOs(3) ($) (d) | | | | | | | | | Value of initial fixed $100 investment based on: | | | | | | | | | Company- Selected Measure: Ameren Adjusted (Non-GAAP) Annual Earnings Per Share(8) ($) (i) | | |||||||||||||||
| Year (a) | | | SCT Total for PEO (Birk/Lyons)(1) ($) (b) | | | CAP to PEO (Birk/Lyons)(4) ($) (c) | | | SCT Total for PEO (Moehn)(2) ($) (b) | | | CAP to PEO (Moehn)(4) ($) (c) | | | Average CAP to Non-PEO NEOs(5) ($) (e) | | | Cumulative TSR ($) (f) | | | Peer Group Cumulative TSR(6) ($) (g) | | | Net Income(7) (in millions) $ (h) | | ||||||||||||||||||||||||||||||||||||
| 2025 | | | | | 2,860,218 | | | | | | 813,989 | | | | | | 6,383,194 | | | | | | 9,094,715 | | | | | | 5,279,317 | | | | | | 5,675,669 | | | | | | N/A | | | | | | N/A | | | | | | 747 | | | | | | 5.03 | | |
| 2024 | | | | | 2,973,817 | | | | | | 4,808,411 | | | | | | | | | | | | | | | | 4,933,199 | | | | | | 9,345,357 | | | | | | N/A | | | | | | N/A | | | | | | 559 | | | | | | 4.63 | | | ||
| 2023 | | | | | 2,892,627 | | | | | | 1,269,859 | | | | | | | | | | | | | | | | 6,033,703 | | | | | | 2,478,194 | | | | | | N/A | | | | | | N/A | | | | | | 545 | | | | | | 4.38 | | | ||
| 2022 | | | | | 2,376,562 | | | | | | 2,614,438 | | | | | | | | | | | | | | | | 5,100,902 | | | | | | 6,083,692 | | | | | | N/A | | | | | | N/A | | | | | | 562 | | | | | | 4.14 | | | ||
| 2021 | | | | | 4,305,713 | | | | | | 5,977,831 | | | | | | | | | | | | | | | | 4,578,798 | | | | | | 6,226,159 | | | | | | N/A | | | | | | N/A | | | | | | 518 | | | | | | 3.84 | | | ||
(1)
Mr. Birk served as the PEO during 2022, 2023, 2024, and through October 2, 2025, when he retired. Mr. Lyons served as the PEO in 2021.
(2)
Effective with Mr. Birk’s retirement, Mr. Moehn began serving as the PEO effective October 2, 2025.
(3)
The non-PEO NEOs for the applicable periods are: Mr. Lyons (2022-2025), Mr. Moehn (2021-October 2, 2025), Mr. Warner L. Baxter (2021-2022), Ms. Chonda J. Nwamu (2021-2024), Mr. Diya (2021; 2023-2025), Mr. Lindgren (2025), and Ms. Shaw (2025).
(4)
To calculate CAP for the PEOs, as reported in column (c), the following amounts were deducted from and added to the PEO’s total compensation, as reported in the SCT:
| | | | 2025 | | | 2025 | | ||||||
| | | | PEO #1 (Birk) | | | PEO #2 (Moehn) | | ||||||
| SCT Total for PEO | | | | | 2,860,218 | | | | | | 6,383,194 | | |
| Deductions from SCT: | | | | | | | | | |||||
| Grant Date Fair Value of Equity-Based Awards Granted in Year (as Reported in Column (e) of the SCT) | | | | | (1,883,848) | | | | | | (3,491,892) | | |
| Change in Pension Value (as included in column (g) of the SCT) | | | | | (255,640) | | | | | | (236,925) | | |
| Additions to SCT: | | | | | | | | | |||||
| Fair Value at Year-end of Unvested Awards Granted in Year(9) | | | | | 456,345 | | | | | | 3,370,918 | | |
| Change in Fair Value of Awards Granted in Prior Years that Vested during the Year(8) | | | | | 165,201 | | | | | | 422,337 | | |
| Change in Fair Value of Unvested Awards Granted in Prior Years that Remain Unvested and Outstanding at Year-End(8) | | | | | 432,917 | | | | | | 2,461,320 | | |
| Fair Value of Prior Year Awards Forfeited During the Year | | | | | (1,020,037) | | | | | | | | |
| Service Cost for all Defined Benefit Pension Plans | | | | | 58,833 | | | | | | 185,763 | | |
| Compensation Actually Paid to PEO(10) | | | | | 813,989 | | | | | | 9,094,715 | | |
(5)
To calculate Average CAP for the other NEOs, as reported in column (e), the following amounts were deducted from and added to the NEOs’ total compensation, as reported in the SCT:
| | | | 2025 | | |||
| Average SCT Total Compensation for Non-PEO NEOs | | | | | 5,279,317 | | |
| Deductions from SCT: | | | | | | | |
| Grant Date Fair Value of Equity-Based Awards Granted in Year (as Reported in Column (e) of the SCT) | | | | | (2,820,446) | | |
| Change in Pension Value (as included in column (g) of the SCT) | | | | | (241,090) | | |
| Additions to SCT: | | | | | | | |
| Fair Value at Year-end of Unvested Awards Granted in Year(9) | | | | | 2,407,503 | | |
| Change in Fair Value of Awards Granted in Prior Years that Vested during the Year(9) | | | | | 228,235 | | |
| Change in Fair Value of Unvested Awards Granted in Prior Years that Remain Unvested and Outstanding at Year-End(9) | | | | | 978,480 | | |
| Fair Value of Prior Year Awards Forfeited During the Year | | | | | (285,724) | | |
| Service Cost for all Defined Benefit Pension Plans | | | | | 129,394 | | |
| Average Compensation Actually Paid to Non-PEO NEOs(10) | | | | | 5,675,669 | | |
(6)
The Company does not have publicly traded shares of common stock and, as a result, does not have a “total shareholder return”. As a result no cumulative total shareholder return or peer group cumulative total shareholder return has been included in this table.
(7)
Value reported is the Company’s net income attributable to Ameren common shareholders, as reported in the Company’s Annual Report on Form 10-K for the applicable period.
(8)
Our named executive officers are compensated by Ameren in accordance with its executive compensation policies. The Company does not make independent decisions regarding the compensation of its executive officers. As a result, the company-selected measure included in this table is Ameren’s adjusted (non-GAAP) diluted EPS for the respective year, which reflects the financial performance measure that in Ameren’s assessment represents the most important financial measure used to link compensation actually paid for the most recently completed fiscal year to company performance. Except for 2024 and 2025, values reported represent Ameren’s GAAP diluted EPS and adjusted (non-GAAP) diluted EPS. See Appendix A for a reconciliation of GAAP to adjusted (non-GAAP) EPS for 2024 and 2025.
(9)
The below table provides the valuation assumptions used in determining the fair value of equity awards (on the respective valuation dates) that are materially different from those originally disclosed as of the grant date of such equity awards.
| Performance Period | | | Valuation Date | | | Risk-Free Rate | | | Ameren’s Common Stock Volatility | | | Volatility Range for the Peer Group | |
| 2025 – 2027 | | | 12/31/2025 | | | 3.47% | | | 17.19% | | | 16.30% – 25.64% | |
| 2024 – 2026 | | | 12/31/2024 | | | 4.25% | | | 19.77% | | | 17.27% – 23.80% | |
| | 12/31/2025 | | | 3.48% | | | 17.34% | | | 16.71% – 27.48% | | ||
| 2023 – 2028 | | | 12/31/2023 | | | 3.85% | | | 26.20% | | | 24.49% – 30.56% | |
| | 12/31/2024 | | | 4.32% | | | 19.82% | | | 18.15% – 22.91% | | ||
| | 12/31/2025 | | | 3.54% | | | 18.93% | | | 17.19% – 26.33% | | ||
| 2023 – 2025 | | | 12/31/2023 | | | 4.23% | | | 22.0% | | | 19.98% – 24.79% | |
| | 12/31/2024 | | | 4.16% | | | 17.05% | | | 15.08% – 23.65% | |
(10)
No adjustments were required with respect to the dollar value of dividends or other earnings paid on stock or option awards, because the value of dividend equivalents accrued on such awards are included in the calculation of the fair value of such awards as of each applicable valuation date.
(1)
Mr. Birk served as the PEO during 2022, 2023, 2024, and through October 2, 2025, when he retired. Mr. Lyons served as the PEO in 2021.
(2)
Effective with Mr. Birk’s retirement, Mr. Moehn began serving as the PEO effective October 2, 2025.
(3)
The non-PEO NEOs for the applicable periods are: Mr. Lyons (2022-2025), Mr. Moehn (2021-October 2, 2025), Mr. Warner L. Baxter (2021-2022), Ms. Chonda J. Nwamu (2021-2024), Mr. Diya (2021; 2023-2025), Mr. Lindgren (2025), and Ms. Shaw (2025).
(6)
The Company does not have publicly traded shares of common stock and, as a result, does not have a “total shareholder return”. As a result no cumulative total shareholder return or peer group cumulative total shareholder return has been included in this table.
(4)
To calculate CAP for the PEOs, as reported in column (c), the following amounts were deducted from and added to the PEO’s total compensation, as reported in the SCT:
| | | | 2025 | | | 2025 | | ||||||
| | | | PEO #1 (Birk) | | | PEO #2 (Moehn) | | ||||||
| SCT Total for PEO | | | | | 2,860,218 | | | | | | 6,383,194 | | |
| Deductions from SCT: | | | | | | | | | |||||
| Grant Date Fair Value of Equity-Based Awards Granted in Year (as Reported in Column (e) of the SCT) | | | | | (1,883,848) | | | | | | (3,491,892) | | |
| Change in Pension Value (as included in column (g) of the SCT) | | | | | (255,640) | | | | | | (236,925) | | |
| Additions to SCT: | | | | | | | | | |||||
| Fair Value at Year-end of Unvested Awards Granted in Year(9) | | | | | 456,345 | | | | | | 3,370,918 | | |
| Change in Fair Value of Awards Granted in Prior Years that Vested during the Year(8) | | | | | 165,201 | | | | | | 422,337 | | |
| Change in Fair Value of Unvested Awards Granted in Prior Years that Remain Unvested and Outstanding at Year-End(8) | | | | | 432,917 | | | | | | 2,461,320 | | |
| Fair Value of Prior Year Awards Forfeited During the Year | | | | | (1,020,037) | | | | | | | | |
| Service Cost for all Defined Benefit Pension Plans | | | | | 58,833 | | | | | | 185,763 | | |
| Compensation Actually Paid to PEO(10) | | | | | 813,989 | | | | | | 9,094,715 | | |
(9)
The below table provides the valuation assumptions used in determining the fair value of equity awards (on the respective valuation dates) that are materially different from those originally disclosed as of the grant date of such equity awards.
| Performance Period | | | Valuation Date | | | Risk-Free Rate | | | Ameren’s Common Stock Volatility | | | Volatility Range for the Peer Group | |
| 2025 – 2027 | | | 12/31/2025 | | | 3.47% | | | 17.19% | | | 16.30% – 25.64% | |
| 2024 – 2026 | | | 12/31/2024 | | | 4.25% | | | 19.77% | | | 17.27% – 23.80% | |
| | 12/31/2025 | | | 3.48% | | | 17.34% | | | 16.71% – 27.48% | | ||
| 2023 – 2028 | | | 12/31/2023 | | | 3.85% | | | 26.20% | | | 24.49% – 30.56% | |
| | 12/31/2024 | | | 4.32% | | | 19.82% | | | 18.15% – 22.91% | | ||
| | 12/31/2025 | | | 3.54% | | | 18.93% | | | 17.19% – 26.33% | | ||
| 2023 – 2025 | | | 12/31/2023 | | | 4.23% | | | 22.0% | | | 19.98% – 24.79% | |
| | 12/31/2024 | | | 4.16% | | | 17.05% | | | 15.08% – 23.65% | |
(10)
No adjustments were required with respect to the dollar value of dividends or other earnings paid on stock or option awards, because the value of dividend equivalents accrued on such awards are included in the calculation of the fair value of such awards as of each applicable valuation date.
(5)
To calculate Average CAP for the other NEOs, as reported in column (e), the following amounts were deducted from and added to the NEOs’ total compensation, as reported in the SCT:
| | | | 2025 | | |||
| Average SCT Total Compensation for Non-PEO NEOs | | | | | 5,279,317 | | |
| Deductions from SCT: | | | | | | | |
| Grant Date Fair Value of Equity-Based Awards Granted in Year (as Reported in Column (e) of the SCT) | | | | | (2,820,446) | | |
| Change in Pension Value (as included in column (g) of the SCT) | | | | | (241,090) | | |
| Additions to SCT: | | | | | | | |
| Fair Value at Year-end of Unvested Awards Granted in Year(9) | | | | | 2,407,503 | | |
| Change in Fair Value of Awards Granted in Prior Years that Vested during the Year(9) | | | | | 228,235 | | |
| Change in Fair Value of Unvested Awards Granted in Prior Years that Remain Unvested and Outstanding at Year-End(9) | | | | | 978,480 | | |
| Fair Value of Prior Year Awards Forfeited During the Year | | | | | (285,724) | | |
| Service Cost for all Defined Benefit Pension Plans | | | | | 129,394 | | |
| Average Compensation Actually Paid to Non-PEO NEOs(10) | | | | | 5,675,669 | | |
(9)
The below table provides the valuation assumptions used in determining the fair value of equity awards (on the respective valuation dates) that are materially different from those originally disclosed as of the grant date of such equity awards.
| Performance Period | | | Valuation Date | | | Risk-Free Rate | | | Ameren’s Common Stock Volatility | | | Volatility Range for the Peer Group | |
| 2025 – 2027 | | | 12/31/2025 | | | 3.47% | | | 17.19% | | | 16.30% – 25.64% | |
| 2024 – 2026 | | | 12/31/2024 | | | 4.25% | | | 19.77% | | | 17.27% – 23.80% | |
| | 12/31/2025 | | | 3.48% | | | 17.34% | | | 16.71% – 27.48% | | ||
| 2023 – 2028 | | | 12/31/2023 | | | 3.85% | | | 26.20% | | | 24.49% – 30.56% | |
| | 12/31/2024 | | | 4.32% | | | 19.82% | | | 18.15% – 22.91% | | ||
| | 12/31/2025 | | | 3.54% | | | 18.93% | | | 17.19% – 26.33% | | ||
| 2023 – 2025 | | | 12/31/2023 | | | 4.23% | | | 22.0% | | | 19.98% – 24.79% | |
| | 12/31/2024 | | | 4.16% | | | 17.05% | | | 15.08% – 23.65% | |
(10)
No adjustments were required with respect to the dollar value of dividends or other earnings paid on stock or option awards, because the value of dividend equivalents accrued on such awards are included in the calculation of the fair value of such awards as of each applicable valuation date.
(9)
The below table provides the valuation assumptions used in determining the fair value of equity awards (on the respective valuation dates) that are materially different from those originally disclosed as of the grant date of such equity awards.
| Performance Period | | | Valuation Date | | | Risk-Free Rate | | | Ameren’s Common Stock Volatility | | | Volatility Range for the Peer Group | |
| 2025 – 2027 | | | 12/31/2025 | | | 3.47% | | | 17.19% | | | 16.30% – 25.64% | |
| 2024 – 2026 | | | 12/31/2024 | | | 4.25% | | | 19.77% | | | 17.27% – 23.80% | |
| | 12/31/2025 | | | 3.48% | | | 17.34% | | | 16.71% – 27.48% | | ||
| 2023 – 2028 | | | 12/31/2023 | | | 3.85% | | | 26.20% | | | 24.49% – 30.56% | |
| | 12/31/2024 | | | 4.32% | | | 19.82% | | | 18.15% – 22.91% | | ||
| | 12/31/2025 | | | 3.54% | | | 18.93% | | | 17.19% – 26.33% | | ||
| 2023 – 2025 | | | 12/31/2023 | | | 4.23% | | | 22.0% | | | 19.98% – 24.79% | |
| | 12/31/2024 | | | 4.16% | | | 17.05% | | | 15.08% – 23.65% | |
Relationship Between Compensation Actually Paid and Performance Measures in the PVP Table
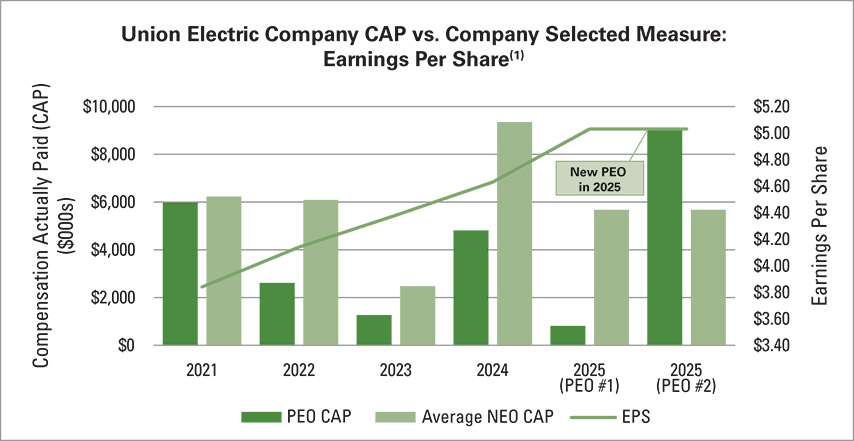
The most important annual financial measure that Ameren uses to link pay to performance is Ameren’s annual GAAP diluted EPS, which is not only the most heavily weighted metric in the STIP, but also generally consistent with Ameren’s TSR, which is the most heavily weighted performance metric in the LTIP. As shown in the chart below, Ameren’s GAAP diluted EPS increased by 7.8% between 2021 and 2022, while the PEO CAP and and the Average NEO CAP decreased by 56.3% and 2.3%, respectively, driven primarily by a new PEO in 2022. In 2023, while the PEO CAP and the Average NEO CAP decreased by 51.4% and 59.3% respectively, driven primarily by the impact on the fair value of outstanding equity awards of the fourth quarter 2023 Ameren stock price decline as a result of the unfavorable regulatory outcomes in Ameren Illinois’ natural gas and multi-year electric distribution rate review and grid plan proceedings, Ameren’s GAAP diluted EPS increased by 5.8%. In 2024, the PEO CAP and the Average NEO CAP increased by 278.7% and 277.1% respectively, and the Company’s adjusted (non-GAAP) diluted EPS increased by 5.7%. In 2025, the PEO CAP increased by 89.1% and the Average NEO CAP decreased by 39.3%, due primarily to the new PEO appointment in the fourth quarter, and the Company’s adjusted (non-GAAP) diluted EPS increased by 8.6%. During the five-year period (2021-2025), the Company’s net income increased by 44.2%.
(1)
Except for 2024 and 2025, EPS amounts in the chart represent both Ameren’s GAAP diluted EPS and its adjusted (non-GAAP) diluted EPS. See Appendix A for a reconciliation of Ameren’s GAAP to adjusted (non-GAAP) EPS for 2024 and 2025.
Additional Company-Selected Performance Measures
The following table represents the unranked list of the most important performance measures used to align compensation actually paid to the PEO and NEOs for 2025 to the performance of Ameren and its subsidiaries, including the Company. While these performance measures are the most important measures, additional measures were also considered to align the PEO and NEOs’ pay and performance as further described in the “Compensation Discussion and Analysis” section above.
| | Ameren Annual EPS | |
| | Ameren Three-Year TSR Ranking vs. the TSR Peer Group | |
| | Energy Transition metric | |
(8)
Our named executive officers are compensated by Ameren in accordance with its executive compensation policies. The Company does not make independent decisions regarding the compensation of its executive officers. As a result, the company-selected measure included in this table is Ameren’s adjusted (non-GAAP) diluted EPS for the respective year, which reflects the financial performance measure that in Ameren’s assessment represents the most important financial measure used to link compensation actually paid for the most recently completed fiscal year to company performance. Except for 2024 and 2025, values reported represent Ameren’s GAAP diluted EPS and adjusted (non-GAAP) diluted EPS. See Appendix A for a reconciliation of GAAP to adjusted (non-GAAP) EPS for 2024 and 2025.