Pay vs Performance Disclosure - USD ($)
Dec. 31, 2025
Dec. 31, 2024
Dec. 31, 2023
| | | | | Current PEO(1) | | | Former PEO(1) | | | Non-PEO NEOs(1) | | | Value of initial fixed $100 investment based on: | | | | | | | | | | | | | | ||||||||||||||||||||||||||||||||||||||||||
| | Year | | | Summary Compensation Table Total for PEO ($)(2) | | | Compensation Actually Paid to PEO ($)(3) | | | Summary Compensation Table Total for PEO ($)(2) | | | Compensation Actually Paid to PEO ($)(3) | | | Average Summary Compensation Table Total for Non-PEO NEOs ($)(2) | | | Average Compensation Actually Paid to Non-PEO NEOs ($)(3) | | | Total Shareholder Return (“TSR”) ($)(4) | | | Peer Group TSR ($)(5) | | | Net Income (in millions) ($)(6) | | | Revenue (in millions) ($)(7) | | ||||||||||||||||||||||||||||||||||||
| | 2025 | | | | | 19,886,498 | | | | | | 18,639,310 | | | | | | 0 | | | | | | 0 | | | | | | 6,161,433 | | | | | | 5,488,140 | | | | | | BATRA | | | | | | 97.97 | | | | | | 211.91 | | | | | | (23) | | | | | | 732 | | |
| | | | | | | | | | | | | | | | | | | | | | | | | | | | | | | | | | | | | | | | | | | BATRK | | | | | | 93.95 | | | | | | | | | | | | | | | | | | | | |
| | 2024 | | | | | 4,315,786 | | | | | | 3,697,068 | | | | | | 2,992,246 | | | | | | 3,902,414 | | | | | | 2,094,477 | | | | | | 1,878,374 | | | | | | BATRA | | | | | | 94.07 | | | | | | 155.63 | | | | | | (31) | | | | | | 662 | | |
| | | | | | | | | | | | | | | | | | | | | | | | | | | | | | | | | | | | | | | | | | | BATRK | | | | | | 91.12 | | | | | | | | | | | | | | | | | | | | |
| | 2023 | | | | | 0 | | | | | | 0 | | | | | | 2,196,335 | | | | | | 1,401,000 | | | | | | 2,442,870 | | | | | | 2,278,622 | | | | | | BATRA | | | | | | 98.64 | | | | | | 110.02 | | | | | | (125) | | | | | | 641 | | |
| | | | | | | | | | | | | | | | | | | | | | | | | | | | | | | | | | | | | | | | | | | BATRK | | | | | | 94.26 | | | | | | | | | | | | | | | | | | | | |
(1)
Our current principal executive officer (“Current PEO”) is Mr. McGuirk, and our former principal executive officer was Mr. Maffei (“Former PEO”). For 2025, our “Non-PEO NEOs” were Messrs. Schiller, Plant and Heller and Ms. Robinson. For 2024, “Non-PEO NEOs” were Messrs. Schiller, Plant and Heller and Ms. Robinson, and a prior NEO, Mr. Wendling, is also included. For 2023, our “Non-PEO NEOs” were Messrs. McGuirk and Wendling, Albert E. Rosenthaler and Renee L. Wilm.
(2)
Reflects, for Messrs. McGuirk and Maffei, the total compensation reported in the Summary Compensation Table and for the Non-PEO NEOs, the average total compensation reported in the Summary Compensation Table in each of the fiscal years indicated.
(3)
Represents the compensation actually paid to Messrs. McGuirk and Maffei, and to the Non-PEO NEOs, in each of the fiscal years indicated as computed in accordance with Item 402(v) of Regulation S-K and related SEC guidance, as set forth below:
| | Compensation actually paid to PEO and Non-PEO NEOs | | ||||||||||||||||||||||||||||||||||||||||||||||||||||||
| | | | | As Reported in Summary Compensation Table(a) | | | | | | | | | Equity Award Adjustments(b) | | | | | | | | ||||||||||||||||||||||||||||||||||||
| | Year | | | Total | | | Stock Awards | | | Option Awards | | | Change in Pension Value | | | Fair Value at Year End of Awards Granted During Year that Remain Outstanding and Unvested at Year End(c) | | | Year-over- Year Change in Fair Value of Awards Granted in Prior Year that Remain Outstanding and Unvested at Year End(d) | | | Fair Value at Vesting Date of Awards Granted and Vested in Same Year(e) | | | Change in Fair Value from Prior Year End to Vesting Date of Awards Granted in Prior Year and Vested in Covered Year(f) | | | Total Compensation Actually Paid | | |||||||||||||||||||||||||||
| | Current PEO | | | | | | | | | | | | | | | | | | | | | | | | | | | | | | | | | | | | | | | | | | | | | | | | | | | | | | | |
| | 2025 | | | | | 19,886,498 | | | | | | (13,815,500) | | | | | | | | | | | (176,776) | | | | | | 12,869,063 | | | | | | (75,637) | | | | | | | | | | | (48,338) | | | | | | 18,639,310 | | | ||
| | 2024 | | | | | 4,315,786 | | | | | | (1,080,000) | | | | | | | | | | | (118,356) | | | | | | 1,033,020 | | | | | | (361,528) | | | | | | | | | | | (91,854) | | | | | | 3,697,068 | | | ||
| | 2023 | | | | | – | | | | | | | | | | | | | | | | | | | | | | | | | | | | | | | | | | | | | | | | | – | | | |||||||
| | Former PEO | | | | | | | | | | | | | | | | | | | | | | | | | | | | | | | | | | | | | | | | | | | | | | | | | | | | | | | |
| | 2025 | | | | | – | | | | | | | | | | | | | | | | | | | | | | | | | | | | | | | | | | | | | | | | | – | | | |||||||
| | 2024 | | | | | 2,992,246 | | | | | | (1,351,998) | | | | | | | | | | | | | | | | | | | | | | | | | | 1,340,783 | | | | | | 921,383 | | | | | | 3,902,414 | | | ||||
| | 2023 | | | | | 2,196,335 | | | | | | | | | | | | | | | | | | | | | | | | | | (1,085,839) | | | | | | 1,237,231 | | | | | | (946,727) | | | | | | 1,401,000 | | | ||||
| | Non-PEO NEOs | | | | | | | | | | | | | | | | | | | | | | | | | | | | | | | | | | | | | | | | | | | | | | | | | | | | | | | |
| | 2025 | | | | | 6,161,433 | | | | | | (3,819,475) | | | | | | | | | | | (116,393) | | | | | | 3,340,162 | | | | | | (47,272) | | | | | | | | | | | (30,315) | | | | | | 5,488,140 | | | ||
| | 2024 | | | | | 2,094,477 | | | | | | (546,435) | | | | | | | | | | | (43,912) | | | | | | 506,945 | | | | | | (108,763) | | | | | | 16,299 | | | | | | (40,237) | | | | | | 1,878,374 | | | |
| | 2023 | | | | | 2,442,870 | | | | | | (807,095) | | | | | | (525,681) | | | | | | | | | | | 1,424,146 | | | | | | | | | | | 68,454 | | | | | | (324,072) | | | | | | 2,278,622 | | | ||
(a)
Reflects, for Messrs. McGuirk and Maffei, the applicable amounts reported in the Summary Compensation Table and, for the Non-PEO NEOs, the average of the applicable amounts reported in the Summary Compensation Table in each of the fiscal years indicated.
(b)
The adjustments made to the fair value of equity awards in accordance with Item 402(v) of Regulation S-K include equity awards with respect to the Company’s common stock that were issued in connection with adjustments made to outstanding equity awards with respect to shares of Liberty Media’s former Series C Liberty Braves common stock in connection with the Split-Off.
(c)
Reflects, with respect to Messrs. McGuirk and Maffei, the fair value and, with respect to the Non-PEO NEOs, the average of the fair values, as of the end of the covered fiscal year of awards granted in, and remaining outstanding and unvested (in whole or in part) as of the end of the covered fiscal years.
(d)
Reflects, with respect to Messrs. McGuirk and Maffei, the change in fair value, and with respect to the Non-PEO NEOs, the average of the fair values, as of the day awards became vested in the covered fiscal year when such awards were also granted in the covered fiscal year.
(e)
Reflects, with respect to Messrs. McGuirk and Maffei, the fair value, and with respect to the Non-PEO NEOs, the average of the fair values, as of the day awards became vested in the covered fiscal year when such awards were also granted in the covered fiscal years.
(f)
Reflects, with respect to Messrs. McGuirk and Maffei, the change in fair value, and with respect to the Non-PEO NEOs, the average of the change in fair values, of awards which failed to meet vesting conditions in the covered fiscal year when such awards were granted in a prior fiscal year.
(4)
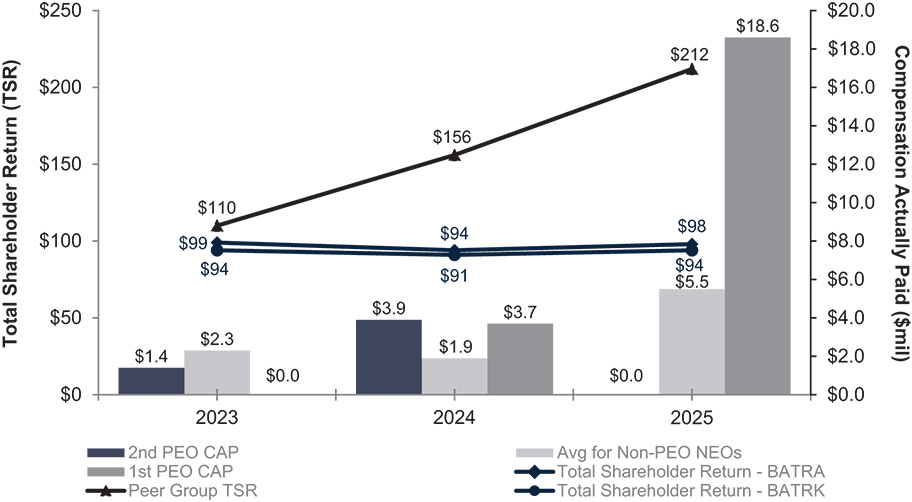
Represents the cumulative total stockholder return on an initial fixed $100 investment in each of our Series A and Series C common stock (Nasdaq: BATRA and BATRK) from December 30, 2022 through December 28, 2025.
(5)
Represents the cumulative total stockholder return on an initial fixed $100 investment in the S&P 500 Media Index from December 30, 2022 through December 28, 2025.
(6)
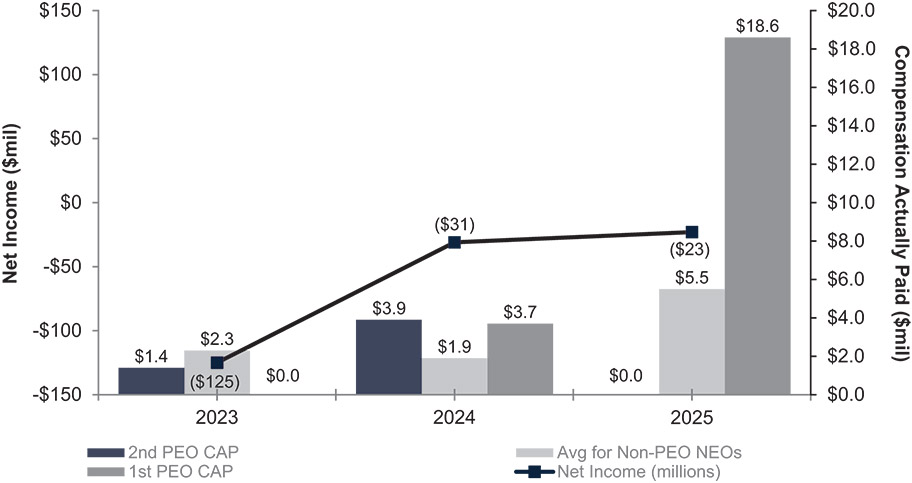
Represents the amount of net income reflected in our consolidated financial statements for the covered fiscal year.
(7)
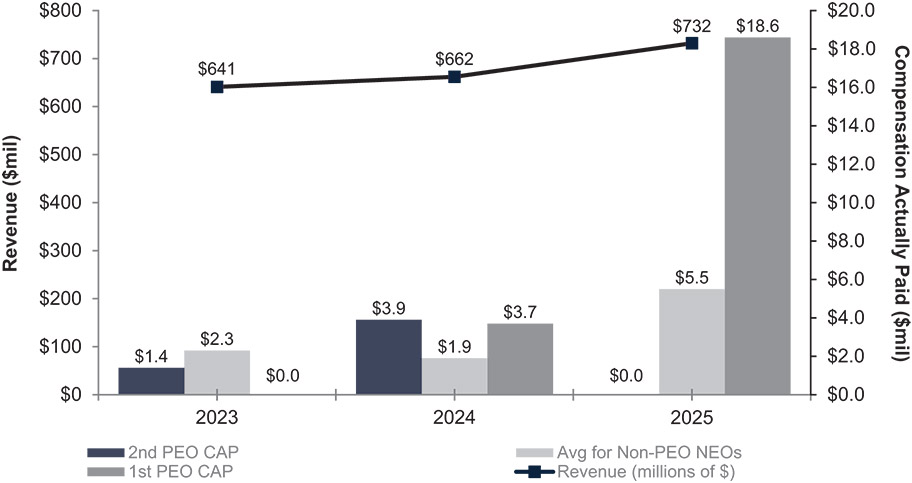
Represents the amount of revenue reflected in our consolidated financial statements for the covered fiscal year.
(1)
Our current principal executive officer (“Current PEO”) is Mr. McGuirk, and our former principal executive officer was Mr. Maffei (“Former PEO”). For 2025, our “Non-PEO NEOs” were Messrs. Schiller, Plant and Heller and Ms. Robinson. For 2024, “Non-PEO NEOs” were Messrs. Schiller, Plant and Heller and Ms. Robinson, and a prior NEO, Mr. Wendling, is also included. For 2023, our “Non-PEO NEOs” were Messrs. McGuirk and Wendling, Albert E. Rosenthaler and Renee L. Wilm.
(2)
Reflects, for Messrs. McGuirk and Maffei, the total compensation reported in the Summary Compensation Table and for the Non-PEO NEOs, the average total compensation reported in the Summary Compensation Table in each of the fiscal years indicated.
(4)
Represents the cumulative total stockholder return on an initial fixed $100 investment in each of our Series A and Series C common stock (Nasdaq: BATRA and BATRK) from December 30, 2022 through December 28, 2025.
(5)
Represents the cumulative total stockholder return on an initial fixed $100 investment in the S&P 500 Media Index from December 30, 2022 through December 28, 2025.
(3)
Represents the compensation actually paid to Messrs. McGuirk and Maffei, and to the Non-PEO NEOs, in each of the fiscal years indicated as computed in accordance with Item 402(v) of Regulation S-K and related SEC guidance, as set forth below:
| | Compensation actually paid to PEO and Non-PEO NEOs | | ||||||||||||||||||||||||||||||||||||||||||||||||||||||
| | | | | As Reported in Summary Compensation Table(a) | | | | | | | | | Equity Award Adjustments(b) | | | | | | | | ||||||||||||||||||||||||||||||||||||
| | Year | | | Total | | | Stock Awards | | | Option Awards | | | Change in Pension Value | | | Fair Value at Year End of Awards Granted During Year that Remain Outstanding and Unvested at Year End(c) | | | Year-over- Year Change in Fair Value of Awards Granted in Prior Year that Remain Outstanding and Unvested at Year End(d) | | | Fair Value at Vesting Date of Awards Granted and Vested in Same Year(e) | | | Change in Fair Value from Prior Year End to Vesting Date of Awards Granted in Prior Year and Vested in Covered Year(f) | | | Total Compensation Actually Paid | | |||||||||||||||||||||||||||
| | Current PEO | | | | | | | | | | | | | | | | | | | | | | | | | | | | | | | | | | | | | | | | | | | | | | | | | | | | | | | |
| | 2025 | | | | | 19,886,498 | | | | | | (13,815,500) | | | | | | | | | | | (176,776) | | | | | | 12,869,063 | | | | | | (75,637) | | | | | | | | | | | (48,338) | | | | | | 18,639,310 | | | ||
| | 2024 | | | | | 4,315,786 | | | | | | (1,080,000) | | | | | | | | | | | (118,356) | | | | | | 1,033,020 | | | | | | (361,528) | | | | | | | | | | | (91,854) | | | | | | 3,697,068 | | | ||
| | 2023 | | | | | – | | | | | | | | | | | | | | | | | | | | | | | | | | | | | | | | | | | | | | | | | – | | | |||||||
| | Former PEO | | | | | | | | | | | | | | | | | | | | | | | | | | | | | | | | | | | | | | | | | | | | | | | | | | | | | | | |
| | 2025 | | | | | – | | | | | | | | | | | | | | | | | | | | | | | | | | | | | | | | | | | | | | | | | – | | | |||||||
| | 2024 | | | | | 2,992,246 | | | | | | (1,351,998) | | | | | | | | | | | | | | | | | | | | | | | | | | 1,340,783 | | | | | | 921,383 | | | | | | 3,902,414 | | | ||||
| | 2023 | | | | | 2,196,335 | | | | | | | | | | | | | | | | | | | | | | | | | | (1,085,839) | | | | | | 1,237,231 | | | | | | (946,727) | | | | | | 1,401,000 | | | ||||
| | Non-PEO NEOs | | | | | | | | | | | | | | | | | | | | | | | | | | | | | | | | | | | | | | | | | | | | | | | | | | | | | | | |
| | 2025 | | | | | 6,161,433 | | | | | | (3,819,475) | | | | | | | | | | | (116,393) | | | | | | 3,340,162 | | | | | | (47,272) | | | | | | | | | | | (30,315) | | | | | | 5,488,140 | | | ||
| | 2024 | | | | | 2,094,477 | | | | | | (546,435) | | | | | | | | | | | (43,912) | | | | | | 506,945 | | | | | | (108,763) | | | | | | 16,299 | | | | | | (40,237) | | | | | | 1,878,374 | | | |
| | 2023 | | | | | 2,442,870 | | | | | | (807,095) | | | | | | (525,681) | | | | | | | | | | | 1,424,146 | | | | | | | | | | | 68,454 | | | | | | (324,072) | | | | | | 2,278,622 | | | ||
(a)
Reflects, for Messrs. McGuirk and Maffei, the applicable amounts reported in the Summary Compensation Table and, for the Non-PEO NEOs, the average of the applicable amounts reported in the Summary Compensation Table in each of the fiscal years indicated.
(b)
The adjustments made to the fair value of equity awards in accordance with Item 402(v) of Regulation S-K include equity awards with respect to the Company’s common stock that were issued in connection with adjustments made to outstanding equity awards with respect to shares of Liberty Media’s former Series C Liberty Braves common stock in connection with the Split-Off.
(c)
Reflects, with respect to Messrs. McGuirk and Maffei, the fair value and, with respect to the Non-PEO NEOs, the average of the fair values, as of the end of the covered fiscal year of awards granted in, and remaining outstanding and unvested (in whole or in part) as of the end of the covered fiscal years.
(d)
Reflects, with respect to Messrs. McGuirk and Maffei, the change in fair value, and with respect to the Non-PEO NEOs, the average of the fair values, as of the day awards became vested in the covered fiscal year when such awards were also granted in the covered fiscal year.
(e)
Reflects, with respect to Messrs. McGuirk and Maffei, the fair value, and with respect to the Non-PEO NEOs, the average of the fair values, as of the day awards became vested in the covered fiscal year when such awards were also granted in the covered fiscal years.
(f)
Reflects, with respect to Messrs. McGuirk and Maffei, the change in fair value, and with respect to the Non-PEO NEOs, the average of the change in fair values, of awards which failed to meet vesting conditions in the covered fiscal year when such awards were granted in a prior fiscal year.
Relationship Between Compensation Actually Paid and Cumulative Total Shareholder Return
Relationship Between Compensation Actually Paid and Net Income
Relationship Between Compensation Actually Paid and Revenue
Performance Measures
The table below contains an unranked list of the most important financial performance measures we use to link executive compensation actually paid to performance.
Key Financial Performance Measures
Revenue
Adjusted OIBDA
Revenue
Adjusted OIBDA
(7)
Represents the amount of revenue reflected in our consolidated financial statements for the covered fiscal year.