Pay Versus Performance
The table below shows for 2023, 2024 and 2025 the “total” compensation for our principal executive officer (PEO) and our other named executive officer (NEO) from the Summary Compensation Table above; the “Compensation Actually Paid” to those officers calculated using rules required by the SEC; our total shareholder return (TSR); and our net income. “Compensation Actually Paid” does not represent the value of shares received by the officers during the year, but rather is an amount calculated under Item 402(v) of the SEC’s Regulation S-K.
|
Year |
Summary Compensation Table Total for PEO ($) |
Compensation Actually Paid to PEO ($)(1) |
Average Summary Compensation Table Total for Non-PEO NEOs ($)(1) |
Average Compensation Actually Paid to Non-PEO NEOs ($)(1) |
Value of Initial Fixed $100 Investment Based on TSR ($) |
Net Income ($) |
||||||||||||||||||
|
2025 |
0 | 0 | 40,000 | 40,000 | 96.16 | 3,009,972 | ||||||||||||||||||
|
2024 |
0 | (779,048 | )(2) | 0 | (779,032 | )(2) | 132.42 | 250,224 | ||||||||||||||||
|
2023 |
0 | 94,708 | (3) | 0 | 94,705 | (3) | 136.21 | 142,961 | ||||||||||||||||
| (1) |
Mr. Stream is the only PEO, and Mr. Stepp is the only non-PEO NEO for whom compensation is reported in the table above. Neither of them received any compensation in 2023 or 2024. Mr. Stream received no compensation in 2025 and Mr. Stepp received $40,000 in salary. |
|
(2) |
As required by Item 402(v) of Regulation S-K, the amounts shown as “Compensation Actually Paid” for 2024 represent (i) the change as of the vesting date (from December 31, 2023) in fair value of the executives’ awards that vested in 2024 ($45,761 for Mr. Stream and $45,760 for Mr. Stepp), minus (ii) the fair value at the end of December 31, 2023 of the executives’ performance share awards that failed to vest in 2024, based upon the probable outcome of the performance criteria as of December 31, 2023 ($824,809 for Mr. Stream and $824,792 for Mr. Stepp). The performance shares that vested in 2024 vested on February 12, 2024, and have been valued using the closing price of the Company’s stock on that date ($13.00 per share). The restricted stock units that vested during 2024 vested on July 15, 2024, and have been valued using the closing price of the Company’s stock on that date ($13.01 per share). |
|
(3) |
The amounts shown as “Compensation Actually Paid” for 2023 represent (i) the amount of the change in the fair value as of December 31, 2023 (from December 31, 2022) of the executives’ stock awards that were outstanding and unvested as of December 31, 2023, based upon, in the case of the performance shares, the probable outcome of the performance criteria as of December 31, 2023 ($111,976 for Mr. Stream and $111,973 for Mr. Stepp) plus (ii) the amount of the change in fair value as of the vesting date (from December 31, 2022) of their stock awards that vested during 2023 ($(17,268) for Mr. Stream and $(17,268) for Mr. Stepp). The only awards that vested during 2023 were restricted stock units that vested on July 15, 2023, which was not a trading day. Under our Stock Incentive Plan, they have been valued using the average of the closing bid and asked prices of the Company’s stock on July 14, 2023 ($10.05 per share), which was the immediately preceding trading day. In 2023, our PEO and NEO received no new stock awards or cash compensation for their services. For purposes of calculating Compensation Actually Paid in 2023, the Company (i) increased the fair value of $13.00 price target performance shares as of December 31, 2023 to reflect a higher probability of vesting prior to expiry and (ii) increased the fair value of unvested restricted stock units as of December 31, 2023 to reflect the Company’s higher stock price on that date versus on December 31, 2022 ($12.96 per share versus $11.40 per share). |
Analysis of the Information Presented in the Pay Versus Performance Table
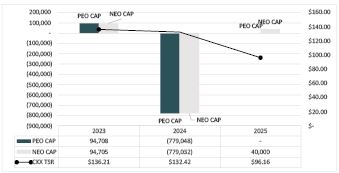
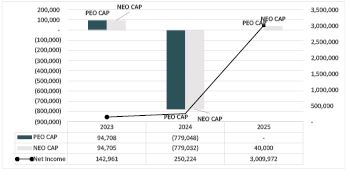
As shown in the graphs below, the “Compensation Actually Paid” to our officers is not aligned with either our three-year TSR or our Net Income for 2023, 2024 and 2025. The officers received no compensation for their services in 2023 and 2024. Mr. Stream received no compensation in 2025 and Mr. Stepp received only $40,000 in salary. The stock awards granted to the officers in 2022 were intended to align management’s compensation with shareholder value. Accordingly, 78.5% of the stock awards granted to the officers could vest only if certain share price targets were met during the performance period, and of those awards, approximately 89% were unvested and at risk as of December 31, 2023, and approximately 70% were unvested and were forfeited on July 15, 2024, when the performance period expired. The fair value as of the vesting date of share awards that actually vested during 2023 was $128,550 for each officer. The fair value as of the vesting date of share awards that vested during 2024 was $574,217 for Mr. Stream and $574,204 for Mr. Stepp.
|
Compensation Actually Paid (CAP) vs. Three-Year TSR |
Compensation Actually Paid (CAP) vs. Net Income |
 |
 |
Analysis of the Information Presented in the Pay Versus Performance Table
As shown in the graphs below, the “Compensation Actually Paid” to our officers is not aligned with either our three-year TSR or our Net Income for 2023, 2024 and 2025. The officers received no compensation for their services in 2023 and 2024. Mr. Stream received no compensation in 2025 and Mr. Stepp received only $40,000 in salary. The stock awards granted to the officers in 2022 were intended to align management’s compensation with shareholder value. Accordingly, 78.5% of the stock awards granted to the officers could vest only if certain share price targets were met during the performance period, and of those awards, approximately 89% were unvested and at risk as of December 31, 2023, and approximately 70% were unvested and were forfeited on July 15, 2024, when the performance period expired. The fair value as of the vesting date of share awards that actually vested during 2023 was $128,550 for each officer. The fair value as of the vesting date of share awards that vested during 2024 was $574,217 for Mr. Stream and $574,204 for Mr. Stepp.
|
Compensation Actually Paid (CAP) vs. Three-Year TSR |
Compensation Actually Paid (CAP) vs. Net Income |
|
|
|