Pure in Thousands
Pay Versus Performance Table
As required by Section 953(a) of the Dodd-Frank Wall Street Reform and Consumer Protection Act, and Item 402(v) of Regulation S-K, we are providing the following information about the relationship between executive compensation actually paid to our named executive officers and certain financial performance of the Company. For further information concerning the Company’s variable pay-for-performance philosophy and how the Company aligns executive compensation with the Company’s performance, refer to “Executive Compensation – Compensation Discussion and Analysis.”
|
Value of Initial Fixed $100 Investment Based On |
||||||||||||||||||||||||||||||||
|
Fiscal Year |
Summary Compensation Table Total PEO |
Compensation Actually Paid to PEO |
Average Summary Compensation Table Total for Non-PEO NEO's |
Average Compensation Actually Paid to Non-PEO NEO's |
Total Shareholder Return |
Peer Group Total Shareholder Return |
Net Income
(in millions) |
Income from Continuing Operations before Tax
(in millions) |
||||||||||||||||||||||||
|
(a) |
(b) |
(c) |
(d) |
(e) |
(f) |
(g) |
(h) |
(i) |
||||||||||||||||||||||||
|
2025 |
$ | 10,224,299 | $ | 10,509,724 | $ | 2,392,863 | $ | 2,455,274 | $ | 224.79 | $ | 207.21 | $ | 266.03 | $ | 345.86 | ||||||||||||||||
|
2024 |
$ | 10,024,142 | $ | 11,127,328 | $ | 2,738,146 | $ | 3,159,583 | $ | 219.80 | $ | 196.50 | $ | 304.97 | $ | 397.80 | ||||||||||||||||
|
2023 |
$ | 10,684,103 | $ | 17,419,075 | $ | 3,174,927 | $ | 5,041,178 | $ | 204.89 | $ | 182.41 | $ | 348.00 | $ | 462.10 | ||||||||||||||||
|
2022 |
$ | 10,318,263 | $ | 10,365,259 | $ | 2,342,196 | $ | 2,351,199 | $ | 141.30 | $ | 120.58 | $ | 391.80 | $ | 509.30 | ||||||||||||||||
|
2021 |
$ | 8,468,391 | $ | 13,689,306 | $ | 1,988,353 | $ | 3,392,607 | $ | 140.42 | $ | 114.33 | $ | 241.40 | $ | 313.60 | ||||||||||||||||
|
(1) |
The dollar amounts reflected in the columns labeled “(b)” are the amounts of total compensation reported for W.M. “Rusty” Rush for each corresponding year in the “Total” column of the applicable “Summary Compensation Table.” |
|
(2) |
The dollar amounts reported in the columns labeled “(c)” represent the amount of “compensation actually paid” (as computed in accordance with Item 402(v) of Regulation S-K and referred to as “CAP”) to W.M. “Rusty” Rush. The dollar amounts do not reflect the actual amount of compensation earned by or paid to Mr. Rush during the applicable year. In accordance with the requirements of Item 402(v) of Regulation S-K, the following adjustments were made to Mr. Rush’s total compensation for each year (as reported in the “Total” column of the applicable “Summary Compensation Table”) to determine his CAP: |
|
Fiscal Year |
Grant Date Fair Value of Equity Awards Granted During the Year |
Fair Value of Current Year Equity Awards at Year End |
Change in Value of Prior Years' Awards Unvested as of Year End |
Change in Value of Prior Years' Awards that Vested during the Year |
Total Adjustment to Equity Value Included in Compensation Actually Paid |
|||||||||||||||
|
2025 |
$ | (4,451,650 | ) | $ | 4,592,000 | $ | (8,750 | ) | $ | 153,825 | $ | 4,737,075 | ||||||||
|
2024 |
$ | (4,144,350 | ) | $ | 4,535,650 | $ | 994,174 | $ | (282,288 | ) | $ | 5,247,536 | ||||||||
|
2023 |
$ | (4,508,700 | ) | $ | 6,721,575 | $ | 4,646,935 | $ | (124,838 | ) | $ | 11,243,672 | ||||||||
|
2022 |
$ | (4,081,350 | ) | $ | 4,535,300 | $ | 15,691 | $ | (422,645 | ) | $ | 4,128,346 | ||||||||
|
2021 |
$ | (3,415,300 | ) | $ | 4,154,850 | $ | 3,485,490 | $ | 995,875 | $ | 8,636,215 | |||||||||
|
(3) |
The dollar amounts reported in column (d) represent the average of the amounts reported for the Company’s named executive officers (“NEOs”) as a group (excluding any person who served as our principal executive officer, or “PEO”) in the “Total” column of the applicable “Summary Compensation Table.” The names of each of the non-PEO NEOs included for purposes of calculating the average amounts in each applicable year are as follows: (i) for 2025, Steven L. Keller, Jason Wilder, Jody Pollard and Corey Lowe; (ii) for 2024, Jason Wilder, Steven L. Keller, Jody Pollard and Michael J. McRoberts; (iii) for 2023, Michael J. McRoberts, Steven L. Keller, Scott Anderson and Jason Wilder; (iv) for 2022, Michael J. McRoberts, Steven L. Keller, Jody Pollard and Scott Anderson; and (v) for 2021, Michael J. McRoberts, Steven L. Keller, Derrek Weaver and Scott Anderson. |
|
(4) |
The dollar amounts reported in column (e) represent the average CAP for the non-PEO NEOs as a group, as computed in accordance with Item 402(v) of Regulation S-K. The dollar amounts do not reflect the actual average amount of compensation earned by or paid to the non-PEO NEOs as a group during the applicable year. In accordance with the requirements of Item 402(v) of Regulation S-K, the following adjustments were made to the average total compensation (as reported in the “Total” column of the applicable “Summary Compensation Table”) for the non-PEO NEOs as a group for each year to determine the average CAP for such group: |
|
Fiscal Year |
Grant Date Fair Value of Equity Awards Granted During the Year |
Fair Value of Current Year Equity Awards at Year End |
Change in Value of Prior Years' Awards Unvested as of Year End |
Change in Value of Prior Years' Awards that Vested during the Year |
Total Adjustment to Equity Value Included in Compensation Actually Paid |
|||||||||||||||
|
2025 |
$ | (1,255,673 | ) | $ | 1,295,122 | $ | (11,363 | ) | $ | 37,325 | $ | 1,321,084 | ||||||||
|
2024 |
$ | (1,617,705 | ) | $ | 1,762,043 | $ | 283,189 | $ | (89,530 | ) | $ | 1,955,701 | ||||||||
|
2023 |
$ | (1,340,968 | ) | $ | 1,995,947 | $ | 1,243,340 | $ | (32,068 | ) | $ | 3,207,219 | ||||||||
|
2022 |
$ | (1,051,330 | ) | $ | 1,166,379 | $ | (1,785 | ) | $ | (104,261 | ) | $ | 1,060,334 | |||||||
|
2021 |
$ | (887,894 | ) | $ | 1,080,702 | $ | 941,408 | $ | 270,038 | $ | 2,292,148 | |||||||||
|
(5) |
The dollar amounts reported in column (f) show the cumulative total shareholder return (“TSR”) with respect to our Class A Common Stock is calculated in accordance with the requirements of Item 402(v) of Regulation S-K assuming $100 was invested at the closing price per share on December 31, 2020. |
|
(6) |
The dollar amounts reported in column (g) show the peer group cumulative TSR, as calculated in accordance with the requirements of Item 402(v) of Regulation S-K assuming a $100 investment at the closing price per share of each peer group member on December 31, 2020, with each peer group member’s TSR weighted based on its stock market capitalization at the close of trading on December 31, 2019. The peer group represented above is the peer group that we use in our Annual Report on Form 10-K for purposes of Item 201(e) of Regulation S-K. |
|
(7) |
The dollar amounts reported in column (h) represent the amount of net income reflected in the Company’s audited consolidated financial statements for the applicable year. |
|
(8) |
As described in greater detail in “Compensation Discussion and Analysis,” in making compensation decisions the Compensation and Human Capital Committee engages in a subjective assessment of the NEO’s accomplishment and contribution to the Company and does not award compensation (the amount, vesting or payment of which) that is expressly tied to pre-established financial performance measures. The Compensation and Human Capital Committee historically has reviewed and considered the Company’s income from continuing operations before taxes as part of its subjective assessment of each NEO’s performance and, in particular, as a factor in determining annual discretionary cash bonuses payable to each NEO. |
Analysis of the Information Presented in the Pay Versus Performance Table
As described in greater detail in in “Compensation Discussion and Analysis,” the Compensation and Human Capital Committee’s goal with respect to executive compensation is to: (a) provide a competitive compensation package that enables us to attract, motivate and retain talented executives; (b) reward executives when we perform well financially, while not encouraging them to take unnecessary risks that could threaten our long-term sustainability; and (c) align executives’ interests with those of our shareholders. In the furtherance of this goal, the Compensation and Human Capital Committee does not use quantitative performance measures in determining executive compensation. The Compensation and Human Capital Committee believes that basing individual performance on quantitative performance measures increases the possibility that individuals will take inappropriate risks to achieve such performance goals without appropriate consideration of the best interests of the Company and our shareholders. The Compensation and Human Capital Committee believes its approach to evaluating individual performance and contribution to the Company provides a balanced relationship between pay-for-performance and appropriate risk management, and fosters team cohesiveness.
The charts below show the relationship between the CAP of our PEO and the average CAP of our non-PEO NEOs and our TSR and net income for each of the covered years:
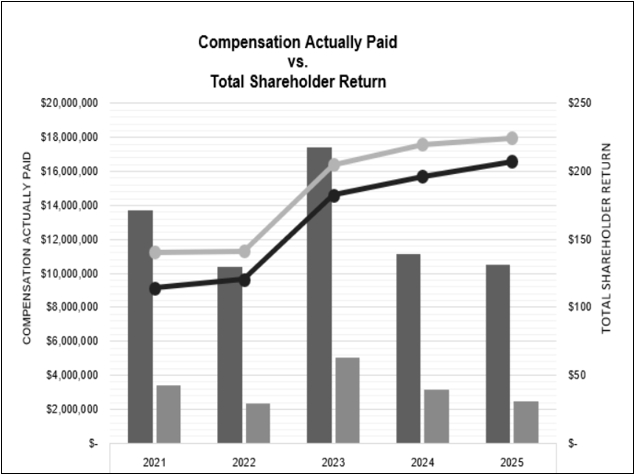
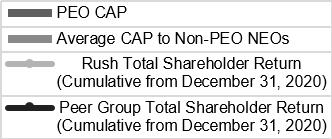
Table of Performance Measures
The following table presents the performance measures that Compensation and Human Capital Committee considers to have been the most important in its executive compensation program linking pay to performance in 2025.
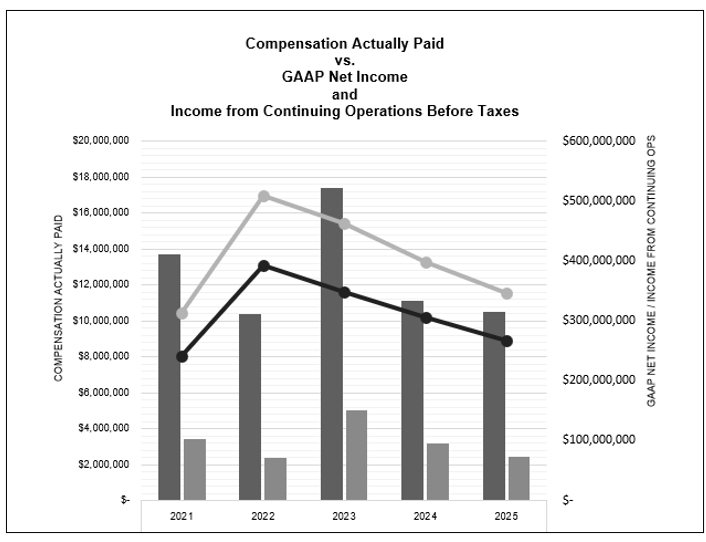
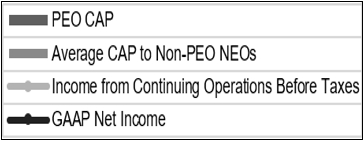
Table of Performance Measures
The following table presents the performance measures that Compensation and Human Capital Committee considers to have been the most important in its executive compensation program linking pay to performance in 2025.
|
Income from Continuing Operations before Taxes (financial) |
|
Net income (financial) |
|
Evaluations of individual performance (non-financial) |