Pay versus Performance
The information below is provided pursuant to the SEC pay versus performance disclosure requirements set forth in Item 402(v) of SEC Regulation S-K (the “Pay Versus Performance Rule”), which requires companies to disclose certain information about the relationship between performance and the compensation of named executive officers.
|
|
|
|
|
|
|
|
|
|
|
|
|
|
Value of Initial Fixed $100 |
|
|
|
|
|
|
|
|||||||||||
Fiscal |
|
Summary |
|
|
Compensation |
|
|
Average Summary |
|
|
Average |
|
|
Total |
|
|
Peer Group |
|
|
Net |
|
|
Adjusted |
|
||||||||
2025 |
|
|
17,841,460 |
|
|
|
44,114,009 |
|
|
|
1,873,666 |
|
|
|
4,392,928 |
|
|
|
340.45 |
|
|
|
123.82 |
|
|
|
189,113,000 |
|
|
|
760 |
|
2024 |
|
|
17,673,893 |
|
|
|
15,859,808 |
|
|
|
1,917,970 |
|
|
|
1,842,076 |
|
|
|
154.82 |
|
|
|
103.33 |
|
|
|
20,521,000 |
|
|
|
588 |
|
(1) The dollar amounts in column (b) represent the compensation reported for Mr. Rousseau for each corresponding year in the “Total” column of the Summary Compensation Table for the relevant years.
(2) The dollar amounts in columns (c) and (e) represent the amount of “Compensation Actually Paid” (otherwise known as CAP), as computed in accordance with SEC rules. Compensation Actually Paid does not represent cash or equity value realized or paid to our named executive officers (“NEOs”) but rather is a value calculated under applicable SEC rules. The following table details how Compensation Actually Paid is determined:
|
|
2025 |
|
|||||
|
|
Mr. Rousseau |
|
|
Average for |
|
||
Summary Compensation Table (“SCT”) Total |
|
|
17,841,460 |
|
|
|
1,873,666 |
|
Grant Date Fair Value of Stock Awards from SCT |
|
|
(6,000,015 |
) |
|
|
(512,505 |
) |
Grant Date Fair Value of Option Awards from SCT |
|
|
(5,999,997 |
) |
|
|
(512,502 |
) |
Fair Value of Equity Awards Granted in the Year and Unvested as of |
|
|
19,114,756 |
|
|
|
1,075,321 |
|
Change in Fair Value from Prior Year End of Outstanding and Unvested |
|
|
15,104,889 |
|
|
|
1,043,693 |
|
Change in Fair Value from Prior Year End of Vested Awards Granted in |
|
|
4,052,916 |
|
|
|
1,425,256 |
|
Fair Value at Vesting Date of Vested Awards Granted in Current Year |
|
|
— |
|
|
|
— |
|
Compensation Actually Paid |
|
|
44,114,009 |
|
|
|
4,392,928 |
|
(3) The dollar amounts in column (d) represent the average amounts of compensation reported for the other NEOs for each corresponding year in the “Total” column of the Summary Compensation Table for the relevant fiscal year. For 2024, the other NEOs were Jim Mattingly, Steven Reed, Bob Barnes, Mike McMaude and Lisa Nalley. For 2025, the other NEOs were Jim Mattingly, Jennifer Phipps, Bob Barnes, Lisa Nalley, Scott Greenwell and Jennifer Yowler.
(4) Our TSR in column (f) was determined based on the value of an initial fixed investment of $100, as of January 26, 2024, our registration date, including the reinvestment of any dividends.
(5) The amounts shown in this column reflect the cumulative total shareholder return for each fiscal year in the table calculated in the manner prescribed by Item 201(e) of Regulation S-K and reflects the cumulative value of $100 if such amount were invested on January 26, 2024, our registration date, in the S&P 500 Health Care Services Select Industry Index.
(6) EBITDA in column (i) represents the most important financial performance measure used to link Compensation Actually Paid to Company performance (the “Company Selected Measure” as defined in the Pay Versus Performance rules).
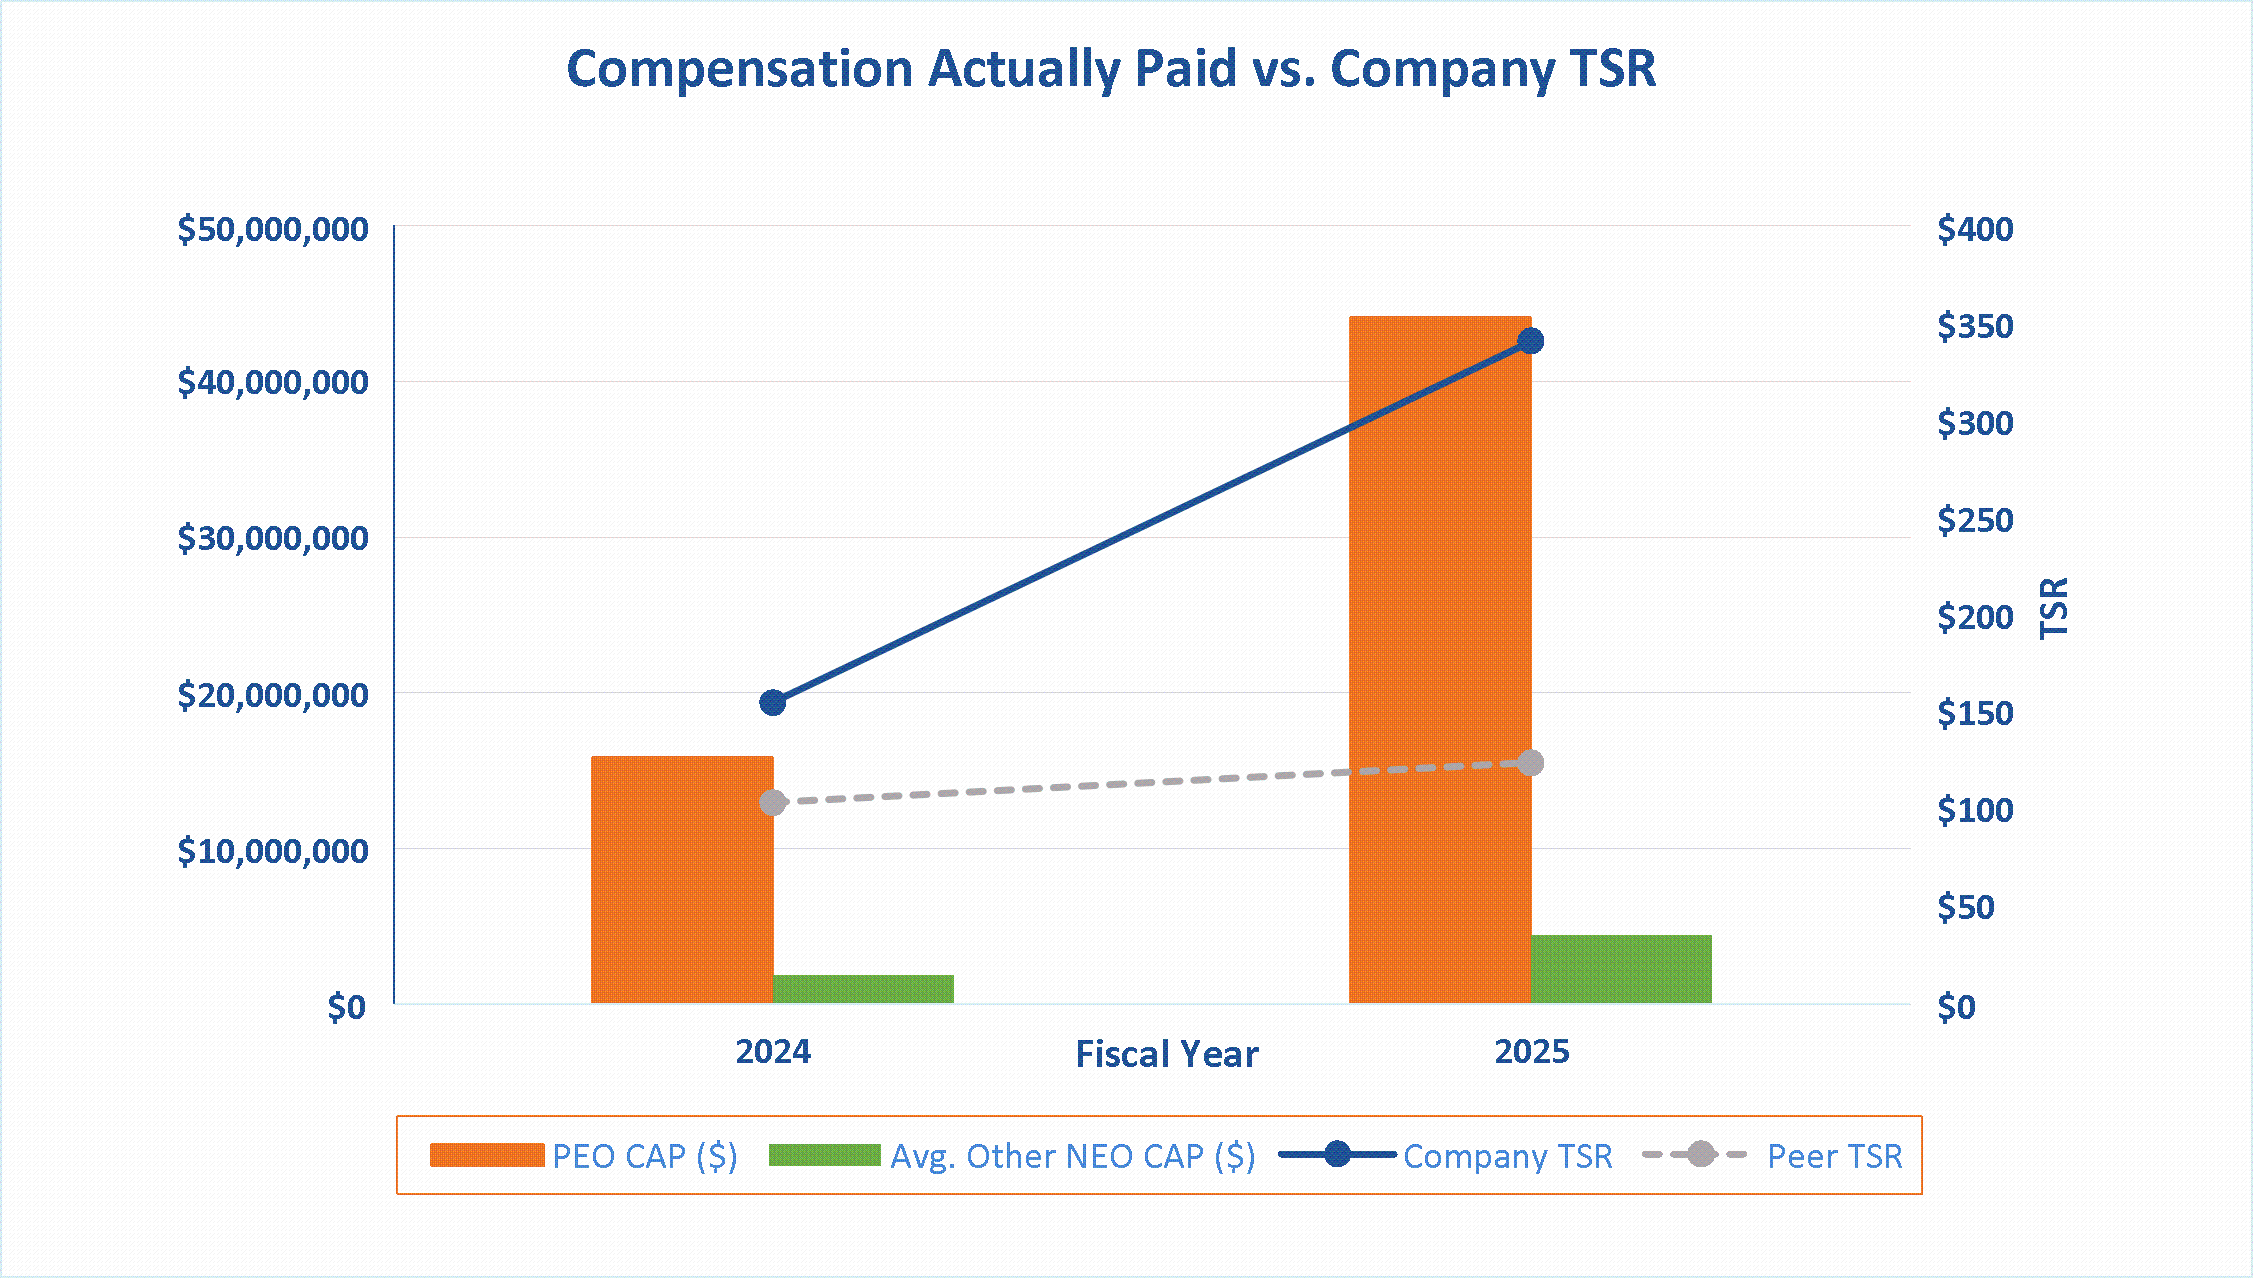
Relationship Between Compensation Actually Paid and our Total Shareholder Return
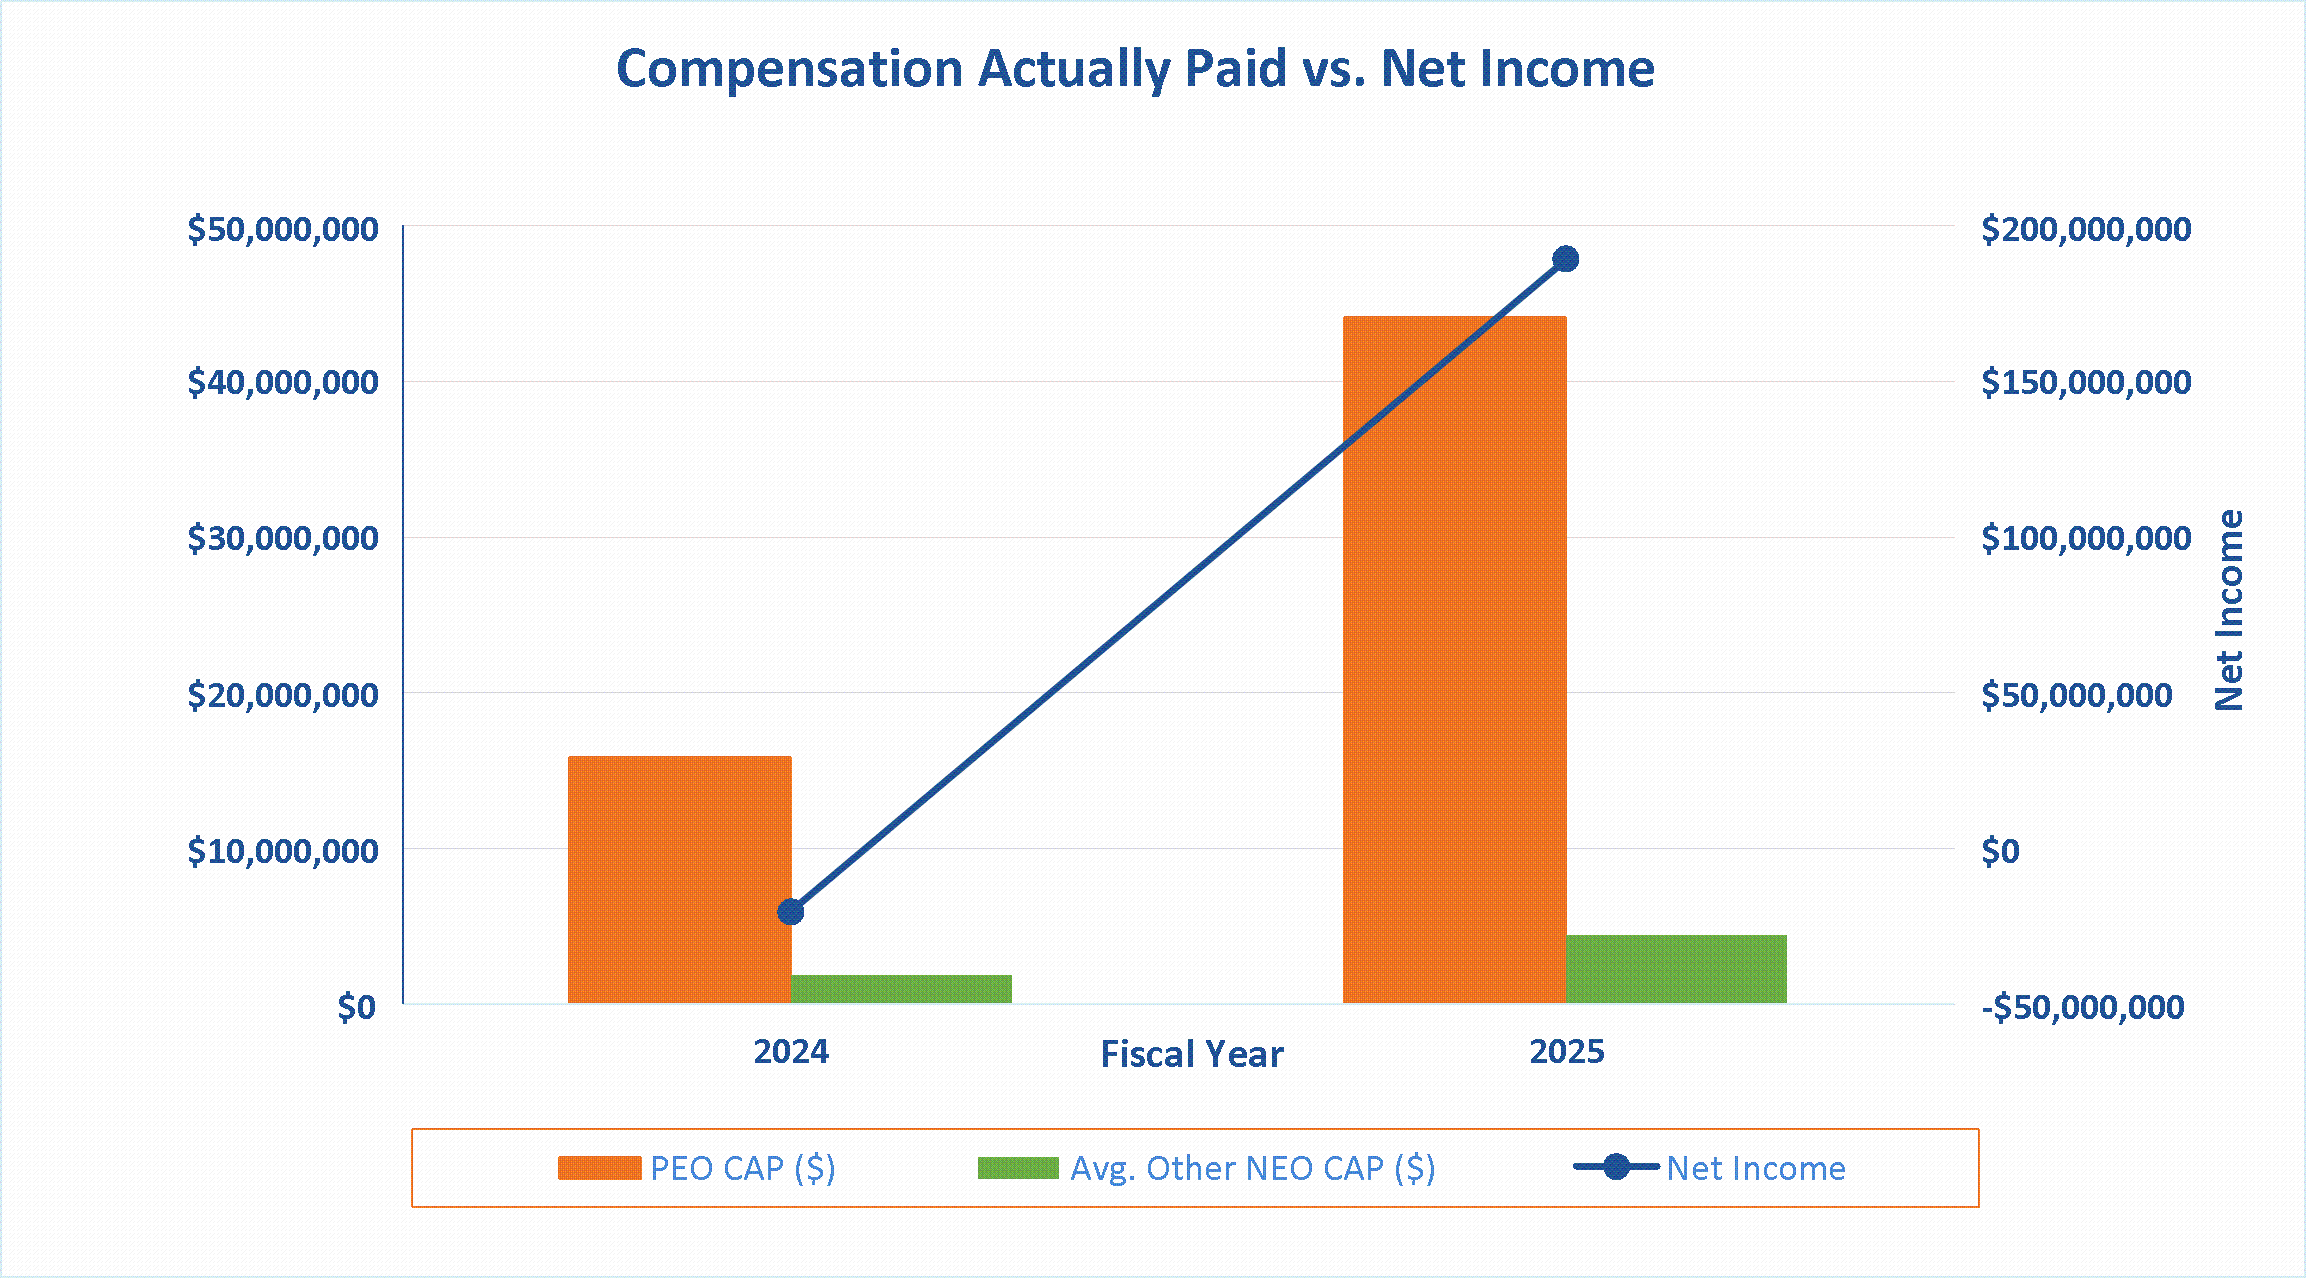
Relationship Between Compensation Actually Paid and Net Income
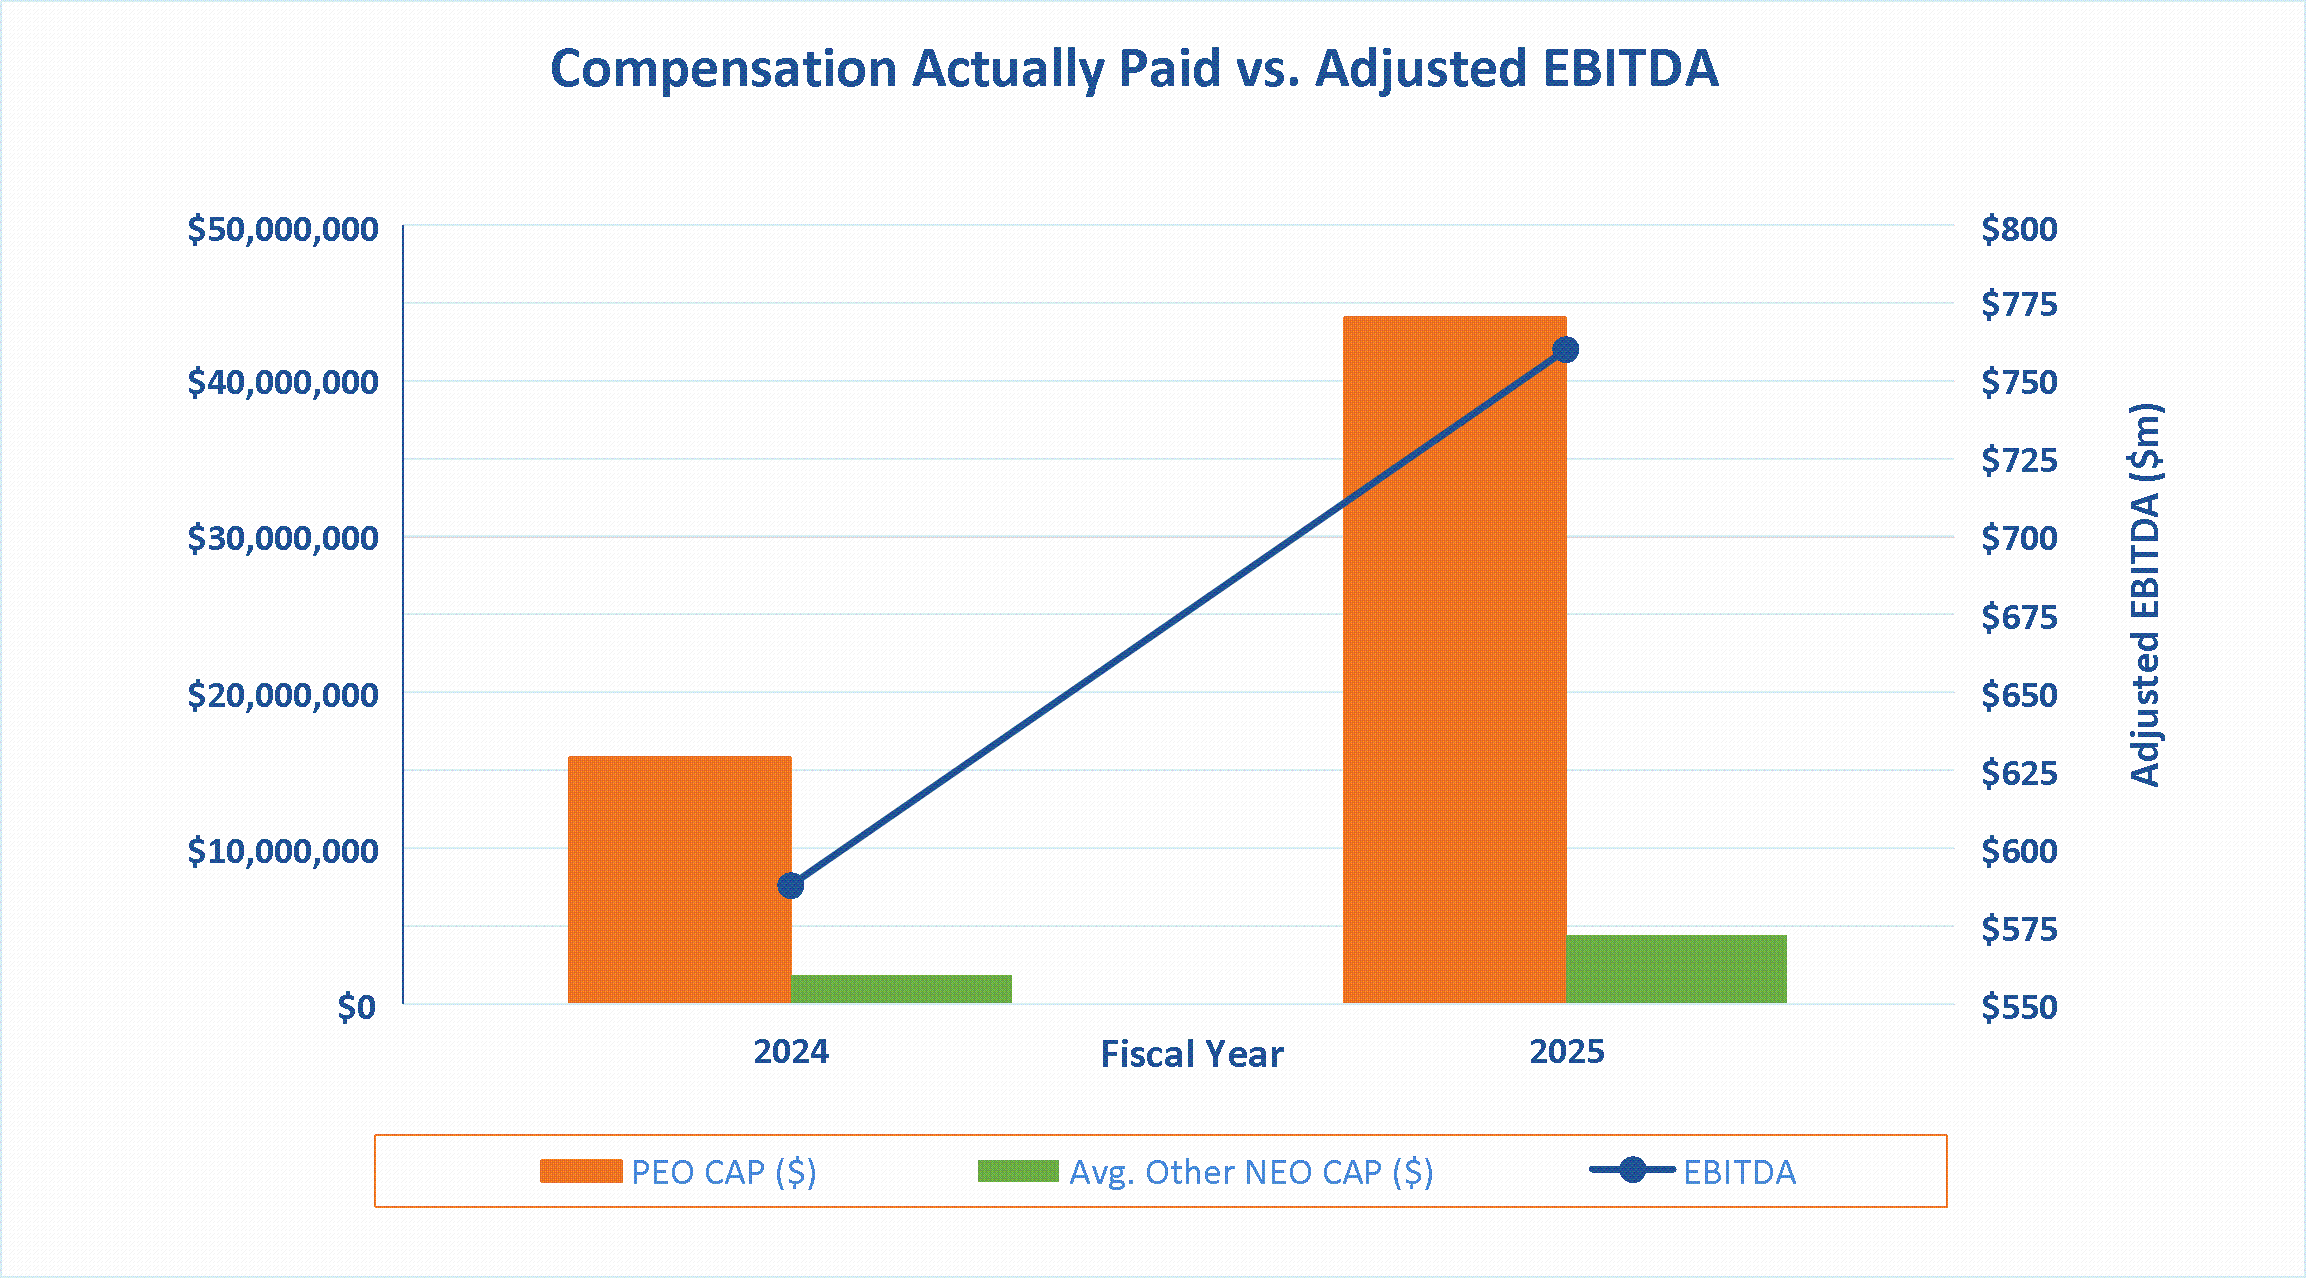
Relationship Between Compensation Actually Paid and Adjusted EBITDA
Other Relevant Financial Performance Measures
For 2025, the following list represented the most important financial performance measures we used to link Compensation Actually Paid with our financial performance:
Adjusted EBITDA |
Operating Unit EBITDA |
Net Revenue |
(3) The dollar amounts in column (d) represent the average amounts of compensation reported for the other NEOs for each corresponding year in the “Total” column of the Summary Compensation Table for the relevant fiscal year. For 2024, the other NEOs were Jim Mattingly, Steven Reed, Bob Barnes, Mike McMaude and Lisa Nalley. For 2025, the other NEOs were Jim Mattingly, Jennifer Phipps, Bob Barnes, Lisa Nalley, Scott Greenwell and Jennifer Yowler.
(2) The dollar amounts in columns (c) and (e) represent the amount of “Compensation Actually Paid” (otherwise known as CAP), as computed in accordance with SEC rules. Compensation Actually Paid does not represent cash or equity value realized or paid to our named executive officers (“NEOs”) but rather is a value calculated under applicable SEC rules. The following table details how Compensation Actually Paid is determined:
|
|
2025 |
|
|||||
|
|
Mr. Rousseau |
|
|
Average for |
|
||
Summary Compensation Table (“SCT”) Total |
|
|
17,841,460 |
|
|
|
1,873,666 |
|
Grant Date Fair Value of Stock Awards from SCT |
|
|
(6,000,015 |
) |
|
|
(512,505 |
) |
Grant Date Fair Value of Option Awards from SCT |
|
|
(5,999,997 |
) |
|
|
(512,502 |
) |
Fair Value of Equity Awards Granted in the Year and Unvested as of |
|
|
19,114,756 |
|
|
|
1,075,321 |
|
Change in Fair Value from Prior Year End of Outstanding and Unvested |
|
|
15,104,889 |
|
|
|
1,043,693 |
|
Change in Fair Value from Prior Year End of Vested Awards Granted in |
|
|
4,052,916 |
|
|
|
1,425,256 |
|
Fair Value at Vesting Date of Vested Awards Granted in Current Year |
|
|
— |
|
|
|
— |
|
Compensation Actually Paid |
|
|
44,114,009 |
|
|
|
4,392,928 |
|
Relationship Between Compensation Actually Paid and our Total Shareholder Return
Relationship Between Compensation Actually Paid and Net Income
Relationship Between Compensation Actually Paid and Adjusted EBITDA
For 2025, the following list represented the most important financial performance measures we used to link Compensation Actually Paid with our financial performance:
Adjusted EBITDA |
Operating Unit EBITDA |
Net Revenue |