Pay vs Performance Disclosure - USD ($)
Dec. 31, 2025
Dec. 31, 2024
Dec. 31, 2023
Dec. 31, 2022
Dec. 31, 2021
Dec. 31, 2020
Pay-Versus-
Performance
The information below has been prepared in accordance with the SEC’s
pay-versus-performance
disclosure rules, which include a measure called “Compensation Actually Paid” (CAP). It is important to note that CAP does not represent the actual amount of pay that has been fully earned or realized, either in the year set forth in the table or at all. For a fulsome description of our executive compensation program and the alignment of executive compensation and performance for our principal executive officer (PEO) and our
non-PEO
named executive officers (Non-PEO
NEOs), please refer to the Compensation Discussion and Analysis. 2025 PAY-VERSUS-PERFORMANCE
Average Summary Compensation Table Total for Non-PEO NEOs (A) |
Average Compensation Actually Paid to Non-PEO NEOs (A) |
Value of Initial Fixed $100 Investment Based on |
||||||||||||||||||||||||||||||||||||||
Year |
Summary Compensation Table Total for PEO (A) |
Compensation Actually Paid to PEO (A) |
Total Shareholder Return (B) |
Peer Group Total Shareholder Return (B) |
Net Income (in millions) (C) |
ABP Earnings (in millions) (D) | ||||||||||||||||||||||||||||||||||
(a) |
(b) |
(c) |
(d) |
(e) |
(f) |
(g) |
(h) |
(i) | ||||||||||||||||||||||||||||||||
2025 (E) |
$ |
4,988,761 |
$ |
2,422,945 |
$ |
1,516,939 |
$ |
1,168,875 |
$ |
163 |
$ |
159 |
$ |
866 |
$ |
880 |
||||||||||||||||||||||||
2024 (E) |
$ |
8,516,072 |
$ |
5,116,530 |
$ |
1,961,138 |
$ |
2,697,582 |
$ |
156 |
$ |
137 |
$ |
956 |
$ |
1,031 |
||||||||||||||||||||||||
2023 (E) |
$ |
4,586,867 |
$ |
3,431,169 |
$ |
1,879,380 |
$ |
1,568,847 |
$ |
129 |
$ |
111 |
$ |
812 |
$ |
813 |
||||||||||||||||||||||||
2022 (E) |
$ |
3,088,519 |
$ |
4,692,922 |
$ |
1,548,720 |
$ |
1,920,993 |
$ |
129 |
$ |
120 |
$ |
600 |
$ |
795 |
||||||||||||||||||||||||
2021 (E) |
$ |
4,472,412 |
$ |
1,933,825 |
$ |
1,628,645 |
$ |
1,049,777 |
$ |
107 |
$ |
118 |
$ |
(426 |
) |
$ |
719 |
|||||||||||||||||||||||
| (A) | The amounts reported in the “Compensation Actually Paid to PEO” and “Average Compensation Actually Paid to Non-PEO NEOs” columns do not reflect the actual compensation paid to or realized by the PEO or the Non-PEO NEOs during each applicable year. The calculation of compensation actually paid (CAP) for purposes of this table includes point-in-time Non-PEO NEO’s base salary, EICP award and certain other compensation and the 2025 Option Exercises and Stock Vested table for the value realized by each of them upon the vesting of restricted stock unit awards during 2025. |
The following adjustments were made to the amounts reported in the Total column of the Summary Compensation Table (SCT) for the applicable year (SCT Total Compensation), which are reported in columns (b) and (d), to derive the CAP reported in columns (c) and (e), respectively: |
PEO: SCT Total Compensation to CAP Reconciliation
Year |
Total Compensation Reported in SCT |
Equity Awards Reported in SCT (1) |
Adjusted Equity Awards Included in CAP (2) |
Change in Pension Value Reported in SCT (3) |
Adjusted Change in Pension Value Included in CAP (4) |
CAP | ||||||||||||||||||||||||
2025 |
$ |
4,988,761 |
$ |
(1,199,418 |
) |
$ |
542,492 |
$ |
(2,301,094 |
) |
$ |
392,204 |
$ |
2,422,945 |
||||||||||||||||
2024 |
$ |
8,516,072 |
$ |
(1,693,779 |
) |
$ |
2,473,308 |
$ |
(4,240,090 |
) |
$ |
61,019 |
$ |
5,116,530 |
||||||||||||||||
2023 |
$ |
4,586,867 |
$ |
(1,471,963 |
) |
$ |
1,452,392 |
$ |
(1,193,324 |
) |
$ |
57,197 |
$ |
3,431,169 |
||||||||||||||||
2022 |
$ |
3,088,519 |
$ |
(1,348,006 |
) |
$ |
2,883,132 |
$ |
— |
$ |
69,277 |
$ |
4,692,922 |
|||||||||||||||||
2021 |
$ |
4,472,412 |
$ |
(1,255,825 |
) |
$ |
202,289 |
$ |
(1,546,479 |
) |
$ |
61,428 |
$ |
1,933,825 |
||||||||||||||||
Non-PEO NEOs: SCT Total Compensation to CAP Reconciliation |
||||||||||||||||||||||||||||||
Year |
Average Total Compensation Reported in SCT |
Average Equity Awards Reported in SCT (1) |
Average Adjusted Equity Awards Included in CAP (2) |
Average Change in Pension Value Reported in SCT (3) |
Average Adjusted Change in Pension Value Included in CAP (4) |
Average CAP | ||||||||||||||||||||||||
2025 |
$ | 1,516,939 | $ | (608,834 | ) | $ | 319,184 | $ | (97,054 | ) | $ | 38,640 | $ | 1,168,875 | ||||||||||||||||
2024 |
$ | 1,961,138 | $ | (766,773 | ) | $ | 1,066,822 | $ | (221,314 | ) | $ | 657,709 | $ | 2,697,582 | ||||||||||||||||
2023 |
$ | 1,879,380 | $ | (706,945 | ) | $ | 614,726 | $ | (260,441 | ) | $ | 42,127 | $ | 1,568,847 | ||||||||||||||||
2022 |
$ | 1,548,720 | $ | (970,784 | ) | $ | 1,312,491 | $ | (15,449 | ) | $ | 46,015 | $ | 1,920,993 | ||||||||||||||||
2021 |
$ | 1,628,645 | $ | (538,368 | ) | $ | 129,927 | $ | (207,724 | ) | $ | 37,297 | $ | 1,049,777 | ||||||||||||||||
| (1) | The amounts in this column are equal to the amounts in the “Stock Awards” column of the SCT for the applicable year (or, for the Non-PEO NEOs, the average of such amounts), which represent the grant date fair value of Equity Awards granted in the applicable year. |
| (2) | The amounts set forth in the following tables are reflected in this column: |
PEO: Equity Award Values Included in CAP
Year |
Year-End FairValue of Current Year Equity Awards (i) |
Change in Fair Value of Prior Years’ Equity Awards Unvested at Year-End (ii) |
Fair Value of Equity Awards Granted and Vested in Same Year (iii) |
Change in Fair Value between Prior Year-End and Vest Date of Equity Awards Vested in Current Year (iv) |
Adjusted Stock and Option Award Values Included in CAP | ||||||||||||||||||||
2025 |
$ |
1,403,996 |
$ |
(808,281 |
) |
$ |
— |
$ |
(53,223 |
) |
$ |
542,492 |
|||||||||||||
2024 |
$ |
2,012,975 |
$ |
486,160 |
$ |
— |
$ |
(25,827 |
) |
$ |
2,473,308 |
||||||||||||||
2023 |
$ |
1,059,930 |
$ |
365,348 |
$ |
— |
$ |
27,114 |
$ |
1,452,392 |
|||||||||||||||
2022 |
$ |
1,845,640 |
$ |
963,676 |
$ |
— |
$ |
73,816 |
$ |
2,883,132 |
|||||||||||||||
2021 |
$ |
1,261,881 |
$ |
(1,014,052 |
) |
$ |
— |
$ |
(45,540 |
) |
$ |
202,289 |
|||||||||||||
Non-PEO
NEOs: Equity Award Values Included in CAP Year |
Average Year-End FairValue of Current Year Equity Awards (i) |
Average Change in Fair Value of Prior Years’ Equity Awards Unvested at Year-End (ii) |
Average Fair Value of Equity Awards Granted and Vested in Same Year (iii) |
Average Change in Fair Value between Prior Year-End and Vest Date of Equity Awards Vested in Current Year (iv) |
Average Adjusted Stock and Option Award Values Included in CAP | ||||||||||||||||||||
2025 |
$ |
726,063 |
$ |
(382,840 |
) |
$ |
— |
$ |
(24,039 |
) |
$ |
319,184 |
|||||||||||||
2024 |
$ |
911,061 |
$ |
170,059 |
$ |
— |
$ |
(14,298 |
) |
$ |
1,066,822 |
||||||||||||||
2023 |
$ |
522,873 |
$ |
79,475 |
$ |
— |
$ |
12,378 |
$ |
614,726 |
|||||||||||||||
2022 |
$ |
854,833 |
$ |
422,955 |
$ |
— |
$ |
34,703 |
$ |
1,312,491 |
|||||||||||||||
2021 |
$ |
540,967 |
$ |
(402,501 |
) |
$ |
— |
$ |
(8,539 |
) |
$ |
129,927 |
|||||||||||||
| (i) | the year-end fair value of any Equity Awards granted in the applicable year that were outstanding and unvested as of the end of the applicable year (or, for the Non-PEO NEOs, the average of such year-end fair values); |
| (ii) | the amount of change as of the end of the applicable year (from the end of the prior year) in the fair value of Equity Awards granted in prior years that were outstanding and unvested as of the end of the applicable year (or, for the Non-PEO NEOs, the average of such amounts of change); |
| (iii) | the fair value as of the vesting date of Equity Awards that were granted and vested in the same applicable year (or, for the Non-PEO NEOs, the average of such fair values); and |
| (iv) | the amount of change as of the vesting date (from the end of the prior year) in the fair value of Equity Awards that were granted in prior years and vested in the applicable year (or, for the Non-PEO NEOs, the average of such amounts of change). |
No Equity Awards were granted in prior years that were determined to fail to meet the applicable vesting conditions during the applicable year and no dollar value of dividends or other earnings paid on Equity Awards in the applicable year is not otherwise reflected in the fair value of such award. |
The value of Equity Awards included in CAP, as reported in columns (c) and (e), is impacted by changes in Sempra’s stock price. The year-end price of Sempra’s common stock was $88.29 in 2025, $87.72 in 2024, $74.73 in 2023, $77.27 in 2022, $66.14 in 2021 and $63.705 in 2020. |
| (3) | The amounts in this column reflect the aggregate change in the actuarial present value of accumulated benefits under all defined benefit and actuarial pension plans reported in the SCT for the applicable year. Above-market interest on nonqualified deferred compensation reported in the SCT for the applicable year are not reflected. |
| (4) | The amounts in this column reflect the actuarily determined service cost for services rendered during each applicable year under all defined benefit and actuarial pension plans. In November 2024, Sempra’s Compensation and Talent Development Committee approved adding Ms. Brown as a participant in the Supplemental Executive Retirement Plan effective January 1, 2025. The Average Adjusted Change in Pension Value included in CAP for 2024 includes the increase in prior service cost valued at $2.4 million associated with Ms. Brown’s participation in the plan. |
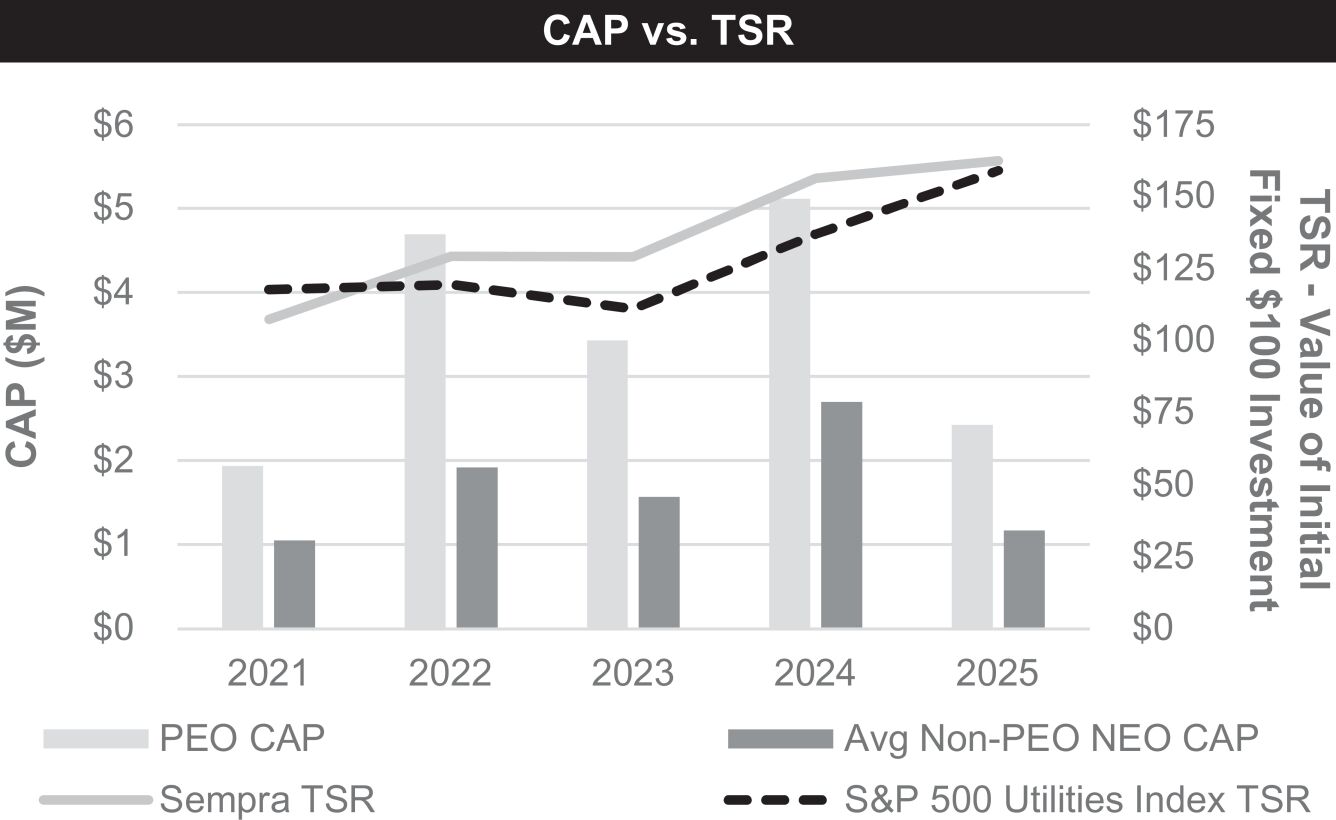
| (B) | SoCalGas does not have publicly traded common stock, and the Equity Awards granted to the PEOs and Non-PEO NEOs are all based in Sempra common stock. As a result, the TSR shown in the table is Sempra’s TSR. The cumulative TSR reflected in each of columns (f) and (g) reflects a five-year measurement period for 2025, a four-year measurement period for 2024, a three-year measurement period for 2023, a two-year measurement period for 2022 and a one-year measurement period for 2021, in each case for the period starting on December 31, 2020 and assuming the reinvestment of all dividends. Consistent with the performance graph included in the 2025 Annual Report, the peer group TSR in column (g) is calculated using the S&P 500 Utilities Index as the peer group, with the returns of each component issuer in such index weighted according to the respective issuers’ market capitalization. |
As part of our compensation program, Equity Awards were granted to our named executive officers in 2021, 2022, 2023, 2024 and 2025 that use multiple performance measures, including Sempra TSR relative to the S&P 500 Utilities Index and the S&P 500 Index. The TSR for the S&P 500 Utilities Index reflected in column (g) differs from the TSR used for our performance-based restricted stock unit awards because the TSR reflected in column (g) is based on the market-capitalization-weighted index while the TSR used for our performance-based restricted stock unit awards is based on Sempra’s TSR percentile ranking relative to the companies in the S&P 500 Utilities Index, excluding water companies, or the companies in the S&P 500 Index, in each case for the three-year performance period for such awards. For additional information about the performance measures used in our annual long-term incentive plan awards, see “Compensation Components—Long-Term Equity-Based Incentives—What were the performance goals for the 2025 performance-based restricted stock units?” in the Compensation Discussion and Analysis in this Information Statement. |
The value of Sempra’s TSR is impacted by changes in Sempra’s stock price. The year-end price of Sempra’s common stock was $88.29 in 2025, $87.72 in 2024, $74.73 in 2023, $77.27 in 2022, $66.14 in 2021 and $63.705 in 2020. |
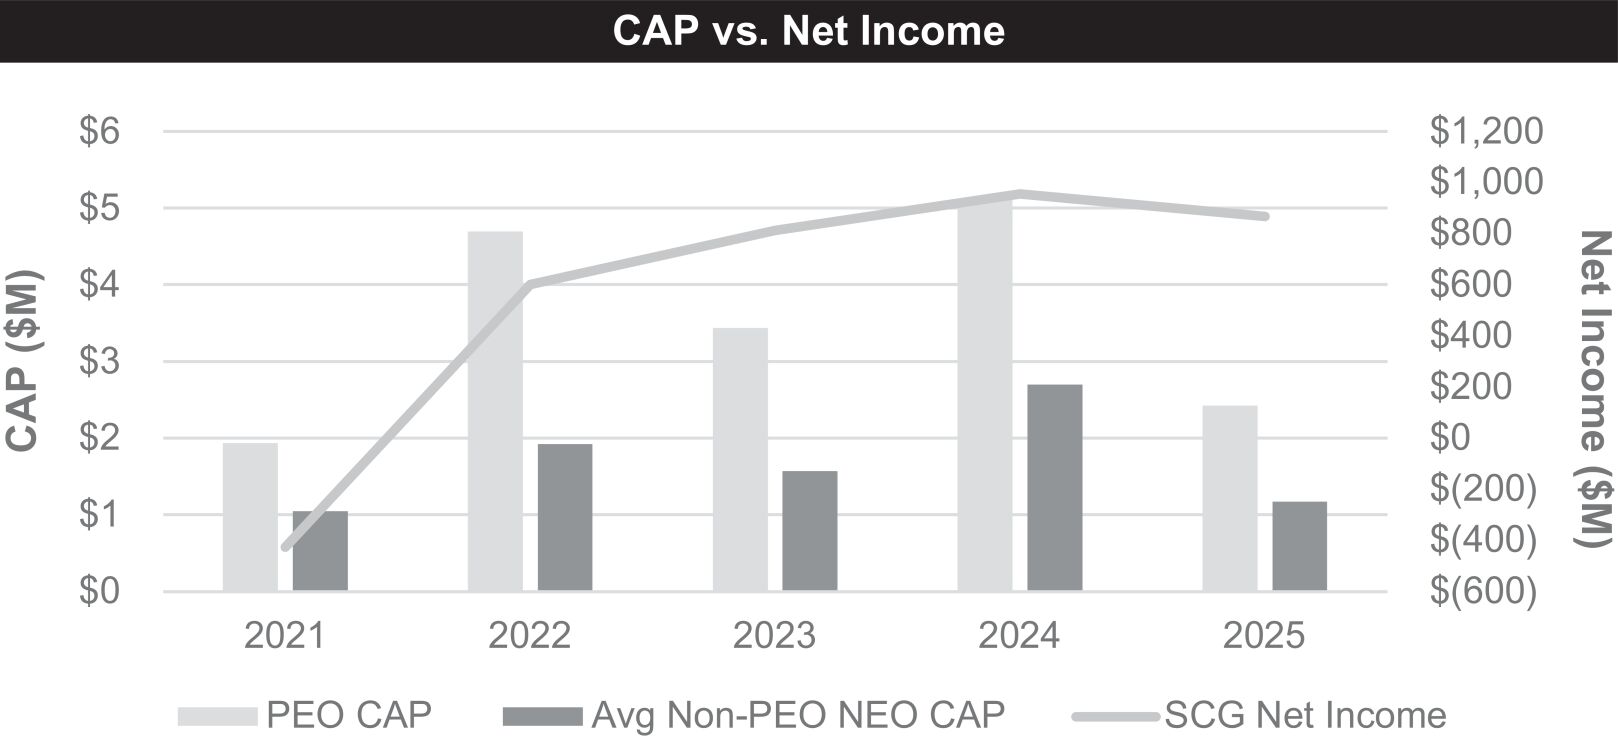
| (C) | Net income represents the amount of net income reflected in our audited financial statements for the applicable fiscal year and includes preferred stock dividends. |
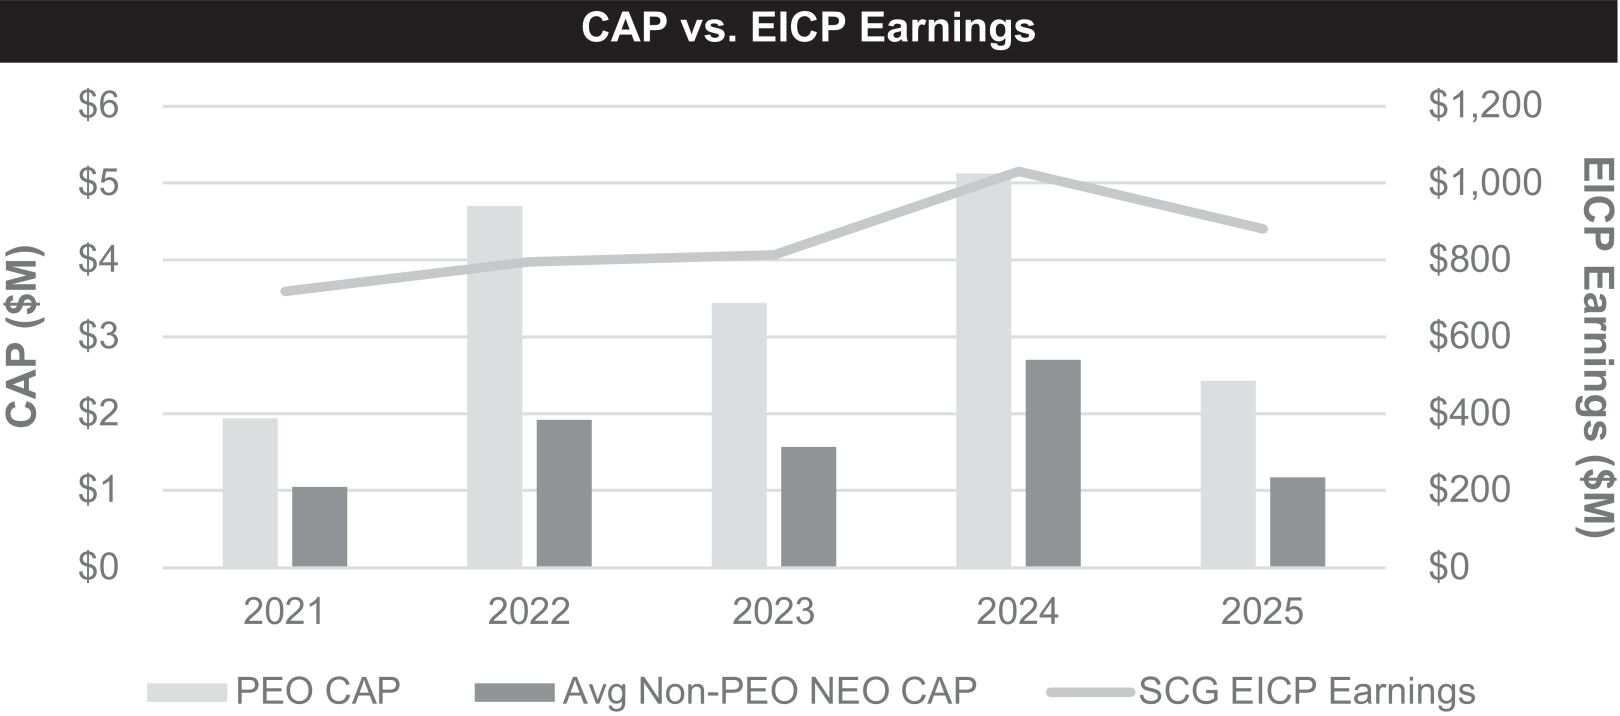
CAP, as reported in columns (c) and (e), includes cash awards under the EICP. The company financial performance measure under the plan is EICP Earnings. A description of EICP Earnings and its relationship to net income is provided below in footnote (D). |
| (D) | Although we use numerous financial and non-financial performance measures for the purpose of evaluating company performance for our executive compensation program, we have determined that EICP Earnings is the financial performance measure that, in our assessment, represents the most important performance measure (that is not otherwise required to be disclosed in this table) used to link CAP for the most recently completed fiscal year to company performance. The SoCalGas Board of Directors uses EICP Earnings, a non-GAAP financial measure, as the company financial performance measure in the EICP. The amount reported in column (i), which represents earnings used for EICP purposes (or EICP Earnings), is calculated as SoCalGas’ GAAP net income, excluding preferred stock dividends and subject to certain other predefined adjustments. EICP Earnings may be higher or lower than earnings reported in our financial statements (labeled as “earnings attributable to common shares” or “GAAP Earnings”) due to these adjustments, which are described in “Compensation Components— Performance-Based Annual Bonuses—How were the EICP earnings goals determined?” and “—What adjustments were applied to GAAP earnings to determine EICP earnings?” in the Compensation Discussion and Analysis in this Information Statement. For additional information about the performance measures used in the EICP, see “Compensation Components—Performance-Based Annual Bonuses—What were the 2025 annual bonus performance goals for the named executive officers?” and “—What were the performance results for the 2025 Executive Incentive Compensation Plan?” in the Compensation Discussion and Analysis in this Information Statement. |
| (E) | The PEO for 2021 through 2024 was Mr. Drury and the PEO for 2025 was Ms. Brown. The Non-PEO NEOs for 2021 were Mss. Brown and DeMontigny and Messrs. Cho and Walker. The Non-PEO NEOs for 2022 through 2024 were Mss. Brown and DeMontigny and Messrs. Cho and Barrett. The Non-PEO NEOs for 2025 were Mss. DeMontigny, Mijares and Smith and Messrs. Barrett and Schwecke. |
| (E) | The PEO for 2021 through 2024 was Mr. Drury and the PEO for 2025 was Ms. Brown. The Non-PEO NEOs for 2021 were Mss. Brown and DeMontigny and Messrs. Cho and Walker. The Non-PEO NEOs for 2022 through 2024 were Mss. Brown and DeMontigny and Messrs. Cho and Barrett. The Non-PEO NEOs for 2025 were Mss. DeMontigny, Mijares and Smith and Messrs. Barrett and Schwecke. |
| (B) | SoCalGas does not have publicly traded common stock, and the Equity Awards granted to the PEOs and Non-PEO NEOs are all based in Sempra common stock. As a result, the TSR shown in the table is Sempra’s TSR. The cumulative TSR reflected in each of columns (f) and (g) reflects a five-year measurement period for 2025, a four-year measurement period for 2024, a three-year measurement period for 2023, a two-year measurement period for 2022 and a one-year measurement period for 2021, in each case for the period starting on December 31, 2020 and assuming the reinvestment of all dividends. Consistent with the performance graph included in the 2025 Annual Report, the peer group TSR in column (g) is calculated using the S&P 500 Utilities Index as the peer group, with the returns of each component issuer in such index weighted according to the respective issuers’ market capitalization. |
As part of our compensation program, Equity Awards were granted to our named executive officers in 2021, 2022, 2023, 2024 and 2025 that use multiple performance measures, including Sempra TSR relative to the S&P 500 Utilities Index and the S&P 500 Index. The TSR for the S&P 500 Utilities Index reflected in column (g) differs from the TSR used for our performance-based restricted stock unit awards because the TSR reflected in column (g) is based on the market-capitalization-weighted index while the TSR used for our performance-based restricted stock unit awards is based on Sempra’s TSR percentile ranking relative to the companies in the S&P 500 Utilities Index, excluding water companies, or the companies in the S&P 500 Index, in each case for the three-year performance period for such awards. For additional information about the performance measures used in our annual long-term incentive plan awards, see “Compensation Components—Long-Term Equity-Based Incentives—What were the performance goals for the 2025 performance-based restricted stock units?” in the Compensation Discussion and Analysis in this Information Statement. |
The value of Sempra’s TSR is impacted by changes in Sempra’s stock price. The year-end price of Sempra’s common stock was $88.29 in 2025, $87.72 in 2024, $74.73 in 2023, $77.27 in 2022, $66.14 in 2021 and $63.705 in 2020. |
| (A) | The amounts reported in the “Compensation Actually Paid to PEO” and “Average Compensation Actually Paid to Non-PEO NEOs” columns do not reflect the actual compensation paid to or realized by the PEO or the Non-PEO NEOs during each applicable year. The calculation of compensation actually paid (CAP) for purposes of this table includes point-in-time Non-PEO NEO’s base salary, EICP award and certain other compensation and the 2025 Option Exercises and Stock Vested table for the value realized by each of them upon the vesting of restricted stock unit awards during 2025. |
The following adjustments were made to the amounts reported in the Total column of the Summary Compensation Table (SCT) for the applicable year (SCT Total Compensation), which are reported in columns (b) and (d), to derive the CAP reported in columns (c) and (e), respectively: |
PEO: SCT Total Compensation to CAP Reconciliation
Year |
Total Compensation Reported in SCT |
Equity Awards Reported in SCT (1) |
Adjusted Equity Awards Included in CAP (2) |
Change in Pension Value Reported in SCT (3) |
Adjusted Change in Pension Value Included in CAP (4) |
CAP | ||||||||||||||||||||||||
2025 |
$ |
4,988,761 |
$ |
(1,199,418 |
) |
$ |
542,492 |
$ |
(2,301,094 |
) |
$ |
392,204 |
$ |
2,422,945 |
||||||||||||||||
2024 |
$ |
8,516,072 |
$ |
(1,693,779 |
) |
$ |
2,473,308 |
$ |
(4,240,090 |
) |
$ |
61,019 |
$ |
5,116,530 |
||||||||||||||||
2023 |
$ |
4,586,867 |
$ |
(1,471,963 |
) |
$ |
1,452,392 |
$ |
(1,193,324 |
) |
$ |
57,197 |
$ |
3,431,169 |
||||||||||||||||
2022 |
$ |
3,088,519 |
$ |
(1,348,006 |
) |
$ |
2,883,132 |
$ |
— |
$ |
69,277 |
$ |
4,692,922 |
|||||||||||||||||
2021 |
$ |
4,472,412 |
$ |
(1,255,825 |
) |
$ |
202,289 |
$ |
(1,546,479 |
) |
$ |
61,428 |
$ |
1,933,825 |
||||||||||||||||
| (1) | The amounts in this column are equal to the amounts in the “Stock Awards” column of the SCT for the applicable year (or, for the Non-PEO NEOs, the average of such amounts), which represent the grant date fair value of Equity Awards granted in the applicable year. |
| (2) | The amounts set forth in the following tables are reflected in this column: |
PEO: Equity Award Values Included in CAP
Year |
Year-End FairValue of Current Year Equity Awards (i) |
Change in Fair Value of Prior Years’ Equity Awards Unvested at Year-End (ii) |
Fair Value of Equity Awards Granted and Vested in Same Year (iii) |
Change in Fair Value between Prior Year-End and Vest Date of Equity Awards Vested in Current Year (iv) |
Adjusted Stock and Option Award Values Included in CAP | ||||||||||||||||||||
2025 |
$ |
1,403,996 |
$ |
(808,281 |
) |
$ |
— |
$ |
(53,223 |
) |
$ |
542,492 |
|||||||||||||
2024 |
$ |
2,012,975 |
$ |
486,160 |
$ |
— |
$ |
(25,827 |
) |
$ |
2,473,308 |
||||||||||||||
2023 |
$ |
1,059,930 |
$ |
365,348 |
$ |
— |
$ |
27,114 |
$ |
1,452,392 |
|||||||||||||||
2022 |
$ |
1,845,640 |
$ |
963,676 |
$ |
— |
$ |
73,816 |
$ |
2,883,132 |
|||||||||||||||
2021 |
$ |
1,261,881 |
$ |
(1,014,052 |
) |
$ |
— |
$ |
(45,540 |
) |
$ |
202,289 |
|||||||||||||
| (i) | the year-end fair value of any Equity Awards granted in the applicable year that were outstanding and unvested as of the end of the applicable year (or, for the Non-PEO NEOs, the average of such year-end fair values); |
| (ii) | the amount of change as of the end of the applicable year (from the end of the prior year) in the fair value of Equity Awards granted in prior years that were outstanding and unvested as of the end of the applicable year (or, for the Non-PEO NEOs, the average of such amounts of change); |
| (iii) | the fair value as of the vesting date of Equity Awards that were granted and vested in the same applicable year (or, for the Non-PEO NEOs, the average of such fair values); and |
| (iv) | the amount of change as of the vesting date (from the end of the prior year) in the fair value of Equity Awards that were granted in prior years and vested in the applicable year (or, for the Non-PEO NEOs, the average of such amounts of change). |
No Equity Awards were granted in prior years that were determined to fail to meet the applicable vesting conditions during the applicable year and no dollar value of dividends or other earnings paid on Equity Awards in the applicable year is not otherwise reflected in the fair value of such award. |
The value of Equity Awards included in CAP, as reported in columns (c) and (e), is impacted by changes in Sempra’s stock price. The year-end price of Sempra’s common stock was $88.29 in 2025, $87.72 in 2024, $74.73 in 2023, $77.27 in 2022, $66.14 in 2021 and $63.705 in 2020. |
| (3) | The amounts in this column reflect the aggregate change in the actuarial present value of accumulated benefits under all defined benefit and actuarial pension plans reported in the SCT for the applicable year. Above-market interest on nonqualified deferred compensation reported in the SCT for the applicable year are not reflected. |
| (4) | The amounts in this column reflect the actuarily determined service cost for services rendered during each applicable year under all defined benefit and actuarial pension plans. In November 2024, Sempra’s Compensation and Talent Development Committee approved adding Ms. Brown as a participant in the Supplemental Executive Retirement Plan effective January 1, 2025. The Average Adjusted Change in Pension Value included in CAP for 2024 includes the increase in prior service cost valued at $2.4 million associated with Ms. Brown’s participation in the plan. |
| (A) | The amounts reported in the “Compensation Actually Paid to PEO” and “Average Compensation Actually Paid to Non-PEO NEOs” columns do not reflect the actual compensation paid to or realized by the PEO or the Non-PEO NEOs during each applicable year. The calculation of compensation actually paid (CAP) for purposes of this table includes point-in-time Non-PEO NEO’s base salary, EICP award and certain other compensation and the 2025 Option Exercises and Stock Vested table for the value realized by each of them upon the vesting of restricted stock unit awards during 2025. |
The following adjustments were made to the amounts reported in the Total column of the Summary Compensation Table (SCT) for the applicable year (SCT Total Compensation), which are reported in columns (b) and (d), to derive the CAP reported in columns (c) and (e), respectively: |
Non-PEO NEOs: SCT Total Compensation to CAP Reconciliation |
||||||||||||||||||||||||||||||
Year |
Average Total Compensation Reported in SCT |
Average Equity Awards Reported in SCT (1) |
Average Adjusted Equity Awards Included in CAP (2) |
Average Change in Pension Value Reported in SCT (3) |
Average Adjusted Change in Pension Value Included in CAP (4) |
Average CAP | ||||||||||||||||||||||||
2025 |
$ | 1,516,939 | $ | (608,834 | ) | $ | 319,184 | $ | (97,054 | ) | $ | 38,640 | $ | 1,168,875 | ||||||||||||||||
2024 |
$ | 1,961,138 | $ | (766,773 | ) | $ | 1,066,822 | $ | (221,314 | ) | $ | 657,709 | $ | 2,697,582 | ||||||||||||||||
2023 |
$ | 1,879,380 | $ | (706,945 | ) | $ | 614,726 | $ | (260,441 | ) | $ | 42,127 | $ | 1,568,847 | ||||||||||||||||
2022 |
$ | 1,548,720 | $ | (970,784 | ) | $ | 1,312,491 | $ | (15,449 | ) | $ | 46,015 | $ | 1,920,993 | ||||||||||||||||
2021 |
$ | 1,628,645 | $ | (538,368 | ) | $ | 129,927 | $ | (207,724 | ) | $ | 37,297 | $ | 1,049,777 | ||||||||||||||||
| (1) | The amounts in this column are equal to the amounts in the “Stock Awards” column of the SCT for the applicable year (or, for the Non-PEO NEOs, the average of such amounts), which represent the grant date fair value of Equity Awards granted in the applicable year. |
| (2) | The amounts set forth in the following tables are reflected in this column: |
Non-PEO
NEOs: Equity Award Values Included in CAP Year |
Average Year-End FairValue of Current Year Equity Awards (i) |
Average Change in Fair Value of Prior Years’ Equity Awards Unvested at Year-End (ii) |
Average Fair Value of Equity Awards Granted and Vested in Same Year (iii) |
Average Change in Fair Value between Prior Year-End and Vest Date of Equity Awards Vested in Current Year (iv) |
Average Adjusted Stock and Option Award Values Included in CAP | ||||||||||||||||||||
2025 |
$ |
726,063 |
$ |
(382,840 |
) |
$ |
— |
$ |
(24,039 |
) |
$ |
319,184 |
|||||||||||||
2024 |
$ |
911,061 |
$ |
170,059 |
$ |
— |
$ |
(14,298 |
) |
$ |
1,066,822 |
||||||||||||||
2023 |
$ |
522,873 |
$ |
79,475 |
$ |
— |
$ |
12,378 |
$ |
614,726 |
|||||||||||||||
2022 |
$ |
854,833 |
$ |
422,955 |
$ |
— |
$ |
34,703 |
$ |
1,312,491 |
|||||||||||||||
2021 |
$ |
540,967 |
$ |
(402,501 |
) |
$ |
— |
$ |
(8,539 |
) |
$ |
129,927 |
|||||||||||||
| (i) | the year-end fair value of any Equity Awards granted in the applicable year that were outstanding and unvested as of the end of the applicable year (or, for the Non-PEO NEOs, the average of such year-end fair values); |
| (ii) | the amount of change as of the end of the applicable year (from the end of the prior year) in the fair value of Equity Awards granted in prior years that were outstanding and unvested as of the end of the applicable year (or, for the Non-PEO NEOs, the average of such amounts of change); |
| (iii) | the fair value as of the vesting date of Equity Awards that were granted and vested in the same applicable year (or, for the Non-PEO NEOs, the average of such fair values); and |
| (iv) | the amount of change as of the vesting date (from the end of the prior year) in the fair value of Equity Awards that were granted in prior years and vested in the applicable year (or, for the Non-PEO NEOs, the average of such amounts of change). |
No Equity Awards were granted in prior years that were determined to fail to meet the applicable vesting conditions during the applicable year and no dollar value of dividends or other earnings paid on Equity Awards in the applicable year is not otherwise reflected in the fair value of such award. |
The value of Equity Awards included in CAP, as reported in columns (c) and (e), is impacted by changes in Sempra’s stock price. The year-end price of Sempra’s common stock was $88.29 in 2025, $87.72 in 2024, $74.73 in 2023, $77.27 in 2022, $66.14 in 2021 and $63.705 in 2020. |
| (3) | The amounts in this column reflect the aggregate change in the actuarial present value of accumulated benefits under all defined benefit and actuarial pension plans reported in the SCT for the applicable year. Above-market interest on nonqualified deferred compensation reported in the SCT for the applicable year are not reflected. |
| (4) | The amounts in this column reflect the actuarily determined service cost for services rendered during each applicable year under all defined benefit and actuarial pension plans. In November 2024, Sempra’s Compensation and Talent Development Committee approved adding Ms. Brown as a participant in the Supplemental Executive Retirement Plan effective January 1, 2025. The Average Adjusted Change in Pension Value included in CAP for 2024 includes the increase in prior service cost valued at $2.4 million associated with Ms. Brown’s participation in the plan. |
Important Performance Measures
As described in the Compensation Discussion and Analysis in this Information Statement, one of the key principles of our executive compensation philosophy is to align pay with short-term and long-term company performance. In our assessment, the most important performance measures used to link executive compensation actually paid to our named executive officers for the most recently completed fiscal year to the company’s performance are listed in the table below. This list includes safety measures and measures related to safety management systems and customer service and other stakeholder-focused measures, which are
non-financial
performance measures. Performance Measure |
Description | |
EICP Earnings |
See footnote (D) to the 2025 Pay-Versus-Performance table for information about the use of EICP Earnings in our 2025 executive compensation program. | |
Sempra Relative TSR vs. S&P 500 Utilities Index |
See footnote (B) to the 2025 Pay-Versus-Performance table for information about the use of Sempra’s relative TSR in our 2025 executive compensation program. | |
Sempra Relative TSR vs. S&P 500 Index |
See footnote (B) to the 2025 Pay-Versus-Performance table for information about the use of Sempra’s relative TSR in our 2025 executive compensation program. | |
Sempra EPS Growth |
Our annual long-term incentive plan awards granted in 2021, 2022, 2023, 2024 and 2025 include a performance-based restricted stock unit award linked to Sempra’s relative EPS growth. The award measures Sempra’s adjusted EPS CAGR for the relevant three-year period. The payout scale for awards granted through 2023 is based on the three-year analyst consensus estimates for the companies constituting the S&P 500 Utilities Index peers. The payout scale for awards granted in 2024 and 2025 is based on the percentile ranking of Sempra’s three-year adjusted EPS CAGR relative to the adjusted EPS CAGRs of the S&P 500 Utilities Index peers. Calculation of EPS for purposes of the applicable LTIP award cycle includes certain adjustments, as described under “Compensation Components—Long-Term Equity-Based Incentives—What were the performance goals for the 2025 performance-based restricted stock units?” in the Compensation Discussion and Analysis in this Information Statement. | |
Safety and Safety Management Systems |
The EICP includes safety measures and measures related to safety management systems as one of its performance measures. These measures are described under “Compensation Components—Performance-Based Annual Bonuses—What were the performance results for the 2025 Executive Incentive Compensation Plan?” in the Compensation Discussion and Analysis in this Information Statement. | |
Customer Service and Other Stakeholders |
The EICP includes customer service and other stakeholder-focused measures as one of its performance measures. These measures are described under “Compensation Components—Performance-Based Annual Bonuses—What were the performance results for the 2025 Executive Incentive Compensation Plan?” in the Compensation Discussion and Analysis in this Information Statement. | |
| (2) | The amounts set forth in the following tables are reflected in this column: |
PEO: Equity Award Values Included in CAP
Year |
Year-End FairValue of Current Year Equity Awards (i) |
Change in Fair Value of Prior Years’ Equity Awards Unvested at Year-End (ii) |
Fair Value of Equity Awards Granted and Vested in Same Year (iii) |
Change in Fair Value between Prior Year-End and Vest Date of Equity Awards Vested in Current Year (iv) |
Adjusted Stock and Option Award Values Included in CAP | ||||||||||||||||||||
2025 |
$ |
1,403,996 |
$ |
(808,281 |
) |
$ |
— |
$ |
(53,223 |
) |
$ |
542,492 |
|||||||||||||
2024 |
$ |
2,012,975 |
$ |
486,160 |
$ |
— |
$ |
(25,827 |
) |
$ |
2,473,308 |
||||||||||||||
2023 |
$ |
1,059,930 |
$ |
365,348 |
$ |
— |
$ |
27,114 |
$ |
1,452,392 |
|||||||||||||||
2022 |
$ |
1,845,640 |
$ |
963,676 |
$ |
— |
$ |
73,816 |
$ |
2,883,132 |
|||||||||||||||
2021 |
$ |
1,261,881 |
$ |
(1,014,052 |
) |
$ |
— |
$ |
(45,540 |
) |
$ |
202,289 |
|||||||||||||
Non-PEO
NEOs: Equity Award Values Included in CAP Year |
Average Year-End FairValue of Current Year Equity Awards (i) |
Average Change in Fair Value of Prior Years’ Equity Awards Unvested at Year-End (ii) |
Average Fair Value of Equity Awards Granted and Vested in Same Year (iii) |
Average Change in Fair Value between Prior Year-End and Vest Date of Equity Awards Vested in Current Year (iv) |
Average Adjusted Stock and Option Award Values Included in CAP | ||||||||||||||||||||
2025 |
$ |
726,063 |
$ |
(382,840 |
) |
$ |
— |
$ |
(24,039 |
) |
$ |
319,184 |
|||||||||||||
2024 |
$ |
911,061 |
$ |
170,059 |
$ |
— |
$ |
(14,298 |
) |
$ |
1,066,822 |
||||||||||||||
2023 |
$ |
522,873 |
$ |
79,475 |
$ |
— |
$ |
12,378 |
$ |
614,726 |
|||||||||||||||
2022 |
$ |
854,833 |
$ |
422,955 |
$ |
— |
$ |
34,703 |
$ |
1,312,491 |
|||||||||||||||
2021 |
$ |
540,967 |
$ |
(402,501 |
) |
$ |
— |
$ |
(8,539 |
) |
$ |
129,927 |
|||||||||||||
| (i) | the year-end fair value of any Equity Awards granted in the applicable year that were outstanding and unvested as of the end of the applicable year (or, for the Non-PEO NEOs, the average of such year-end fair values); |
| (ii) | the amount of change as of the end of the applicable year (from the end of the prior year) in the fair value of Equity Awards granted in prior years that were outstanding and unvested as of the end of the applicable year (or, for the Non-PEO NEOs, the average of such amounts of change); |
| (iii) | the fair value as of the vesting date of Equity Awards that were granted and vested in the same applicable year (or, for the Non-PEO NEOs, the average of such fair values); and |
| (iv) | the amount of change as of the vesting date (from the end of the prior year) in the fair value of Equity Awards that were granted in prior years and vested in the applicable year (or, for the Non-PEO NEOs, the average of such amounts of change). |
No Equity Awards were granted in prior years that were determined to fail to meet the applicable vesting conditions during the applicable year and no dollar value of dividends or other earnings paid on Equity Awards in the applicable year is not otherwise reflected in the fair value of such award. |
The value of Equity Awards included in CAP, as reported in columns (c) and (e), is impacted by changes in Sempra’s stock price. The year-end price of Sempra’s common stock was $88.29 in 2025, $87.72 in 2024, $74.73 in 2023, $77.27 in 2022, $66.14 in 2021 and $63.705 in 2020. |
non-financial
performance measures for the purpose of evaluating company performance for our executive compensation program, we have determined that EICP Earnings is the financial performance measure that, in our assessment, represents the most important performance measure (that is not otherwise required to be disclosed in this table) used to link CAP for the most recently completed fiscal year to company performance. The SoCalGas Board of Directors uses EICP Earnings, a non-GAAP
financial measure, as the company financial performance measure in the EICP. The amount reported in column (i), which represents earnings used for EICP purposes (or EICP Earnings), is calculated as SoCalGas’ GAAP net income, excluding preferred stock dividends and subject to certain other predefined adjustments. EICP Earnings may be higher or lower than earnings reported in our financial statements (labeled as “earnings attributable to common shares” or “GAAP Earnings”) due to these adjustments, which are described in “Compensation Components— Performance-Based Annual Bonuses—How were the EICP earnings goals determined?” and “—What adjustments were applied to GAAP earnings to determine EICP earnings?” in the Compensation Discussion and Analysis in this Information Statement. For additional information about the performance measures used in the EICP, see “Compensation Components—Performance-Based Annual Bonuses—What were the 2025 annual bonus performance goals for the named executive officers?” and “—What were the performance results for the 2025 Executive Incentive Compensation Plan?” in the Compensation Discussion and Analysis in this Information Statement.