Pay vs Performance Disclosure - USD ($)
Dec. 31, 2025
Dec. 31, 2024
Dec. 31, 2023
Dec. 31, 2022
Dec. 31, 2021
Pay versus Performance
The following table sets forth pay versus performance (“
PVP
”) information for 2021 through 2025:
Pay Versus Performance | ||||||||||||||||||||||||||||||||||||||||
Year (1) |
Summary Compensation Table Total for Principal Executive Officer (PEO) |
Compensation Actually Paid to PEO (2) |
Average Summary Compensation Table Total for Non-PEO NEOs |
Average Compensation Actually Paid to Non-PEO NEOs (2) |
Value of Initial Fixed $100 Investment Based On: |
Net Income (Loss) (in millions) (4) |
Net Cash Flow to the Holding Company (in millions) (5) | |||||||||||||||||||||||||||||||||
Total Shareholder Return |
Peer Group Total Shareholder Return (3) | |||||||||||||||||||||||||||||||||||||||
2025 |
$ |
10,461,127 |
$ |
13,490,199 |
$ |
3,316,499 |
$ |
3,974,894 |
$ |
178.95 |
$ |
201.00 |
$ |
331 |
$ |
— |
||||||||||||||||||||||||
2024 |
$ |
10,068,833 |
$ |
8,018,342 |
$ |
3,068,280 |
$ |
2,657,805 |
$ |
122.46 |
$ |
171.87 |
$ |
286 |
$ |
(100 |
) | |||||||||||||||||||||||
2023 |
$ |
10,005,985 |
$ |
11,442,022 |
$ |
3,165,429 |
$ |
3,407,317 |
$ |
134.90 |
$ |
142.87 |
$ |
(1,214) |
$ |
350 |
||||||||||||||||||||||||
2022 |
$ |
9,750,186 |
$ |
6,721,609 |
$ |
3,245,624 |
$ |
2,735,369 |
$ |
130.69 |
$ |
136.53 |
$ |
3,775 |
$ |
38 |
||||||||||||||||||||||||
2021 |
$ |
7,914,025 |
$ |
12,615,385 |
$ |
2,851,864 |
$ |
3,881,547 |
$ |
132.04 |
$ |
123.73 |
$ |
1,554 |
$ |
594 |
||||||||||||||||||||||||
(1) |
The principal executive officer (“ PEO ”) for all years shown was Mr. Steigerwalt. The non-PEO NEOs consist of the following individuals: for 2021, Mr. Spehar, Ms. Christine DeBiase (our former Executive Vice President, Chief Administrative Officer and General Counsel), Mr. Conor Murphy (our former Chief Operating Officer), and Mr. Rosenthal; for 2022, Mr. Spehar, Ms. Huss, Mr. Lambert, Mr. Rosenthal, and Mr. Murphy; for 2023, Mr. Spehar, Ms. Huss, Mr. Lambert, and Mr. Rosenthal; and, for 2024 and 2025, Mr. Spehar, Mr. Lambert, Ms. Lin, and Mr. Rosenthal. |
(2) |
Fair value or change in fair value, as applicable, of equity awards was determined as follows: (1) for RSUs, the per share closing price on the applicable year-end date or, in the case of awards that vested during the year, the per share closing price on such vesting date; (2) for PSUs without the rTSR Modifier, the same valuation methodology as RSUs, except year-end values are multiplied by the probability of achievement as of each such date; (3) for PSUs with the rTSR Modifier, the same valuation methodology as RSUs, except year-end values are multiplied by the probability of achievement as of each such date and a Monte Carlo simulation is performed that considers the Company’s projected rTSR relative to the rTSR Comparator Group, as well as other inputs; and (4) for stock options, a Black-Scholes value as of the applicable year-end or vesting date, determined based on the same methodology used to determine grant date fair value but using the per share closing stock price on the applicable revaluation date as the current market price and with an expected life set equal to the remaining life of the award (as all stock options were out-of-the-money) |
For Compensation Actually Paid (“ CAP ”) calculations that are based on year-end stock prices, the following prices were used: 2025: $64.79 (34.9% increase from prior year); 2024: $48.04 (9% reduction from prior year); 2023: $52.92 (3% increase from prior year); 2022: $51.27 (1% reduction from prior year); and 2021: $51.80 (43% increase from prior year). |
The following table sets forth the deductions from and additions to Summary Compensation Table (“SCT ”) total compensation to calculate CAP to our PEO and non-PEO NEOs during 2025 in the PVP Table: |
PEO |
Average Non-PEO |
|||||||
Total Reported in 2025 Summary Compensation Table (SCT) |
$ |
10,461,127 |
$ |
3,316,499 |
||||
Less, value of Equity Awards reported in SCT |
(6,562,473 |
) |
(1,435,820 |
) | ||||
Plus, Fair Value of Current Year Equity Awards at 12/31/25 |
5,828,720 |
1,317,140 |
||||||
Plus, Change in Value of Prior Year Equity Awards Unvested as of 12/31/25 |
2,814,536 |
582,221 |
||||||
Plus, Change in Value of Prior Year Equity Awards that Vested at 2025 |
948,289 |
194,854 |
||||||
Compensation Actually Paid for Fiscal Year 2025 |
$ |
13,490,199 |
$ |
3,974,894 |
||||
(3) |
Peer group Total Shareholder Return (“ TSR ”) reflects the S&P 500 Life & Health Insurance Index, which is the published industry index used in our 2025 Form 10-K. Each year reflects the cumulative return of $100 as if invested on December 31, 2019, including reinvestment of any dividends. |
(4) |
Effective as of January 1, 2023, the Company adopted ASU 2018-12, Financial Services-Insurance (Topic 944): Targeted Improvements to the Accounting for Long-Duration Contracts (“LDTI ”). LDTI was applied to the earliest period reported in our 2023 financial statements, making the transition date January 1, 2021. Accordingly, net income (loss) for 2021 and 2022 have been recast to reflect the adoption of LDTI. See our 2023 Form 10-K for additional information, in particular Notes 1 and 2 of the Notes to the Consolidated Financial Statements. |
(5) |
Represents net capital distributions from Brighthouse Financial’s operating companies in each fiscal year. |
(1) |
The principal executive officer (“ PEO ”) for all years shown was Mr. Steigerwalt. The non-PEO NEOs consist of the following individuals: for 2021, Mr. Spehar, Ms. Christine DeBiase (our former Executive Vice President, Chief Administrative Officer and General Counsel), Mr. Conor Murphy (our former Chief Operating Officer), and Mr. Rosenthal; for 2022, Mr. Spehar, Ms. Huss, Mr. Lambert, Mr. Rosenthal, and Mr. Murphy; for 2023, Mr. Spehar, Ms. Huss, Mr. Lambert, and Mr. Rosenthal; and, for 2024 and 2025, Mr. Spehar, Mr. Lambert, Ms. Lin, and Mr. Rosenthal. |
(3) |
Peer group Total Shareholder Return (“ TSR ”) reflects the S&P 500 Life & Health Insurance Index, which is the published industry index used in our 2025 Form 10-K. Each year reflects the cumulative return of $100 as if invested on December 31, 2019, including reinvestment of any dividends. |
(2) |
Fair value or change in fair value, as applicable, of equity awards was determined as follows: (1) for RSUs, the per share closing price on the applicable year-end date or, in the case of awards that vested during the year, the per share closing price on such vesting date; (2) for PSUs without the rTSR Modifier, the same valuation methodology as RSUs, except year-end values are multiplied by the probability of achievement as of each such date; (3) for PSUs with the rTSR Modifier, the same valuation methodology as RSUs, except year-end values are multiplied by the probability of achievement as of each such date and a Monte Carlo simulation is performed that considers the Company’s projected rTSR relative to the rTSR Comparator Group, as well as other inputs; and (4) for stock options, a Black-Scholes value as of the applicable year-end or vesting date, determined based on the same methodology used to determine grant date fair value but using the per share closing stock price on the applicable revaluation date as the current market price and with an expected life set equal to the remaining life of the award (as all stock options were out-of-the-money) |
For Compensation Actually Paid (“ CAP ”) calculations that are based on year-end stock prices, the following prices were used: 2025: $64.79 (34.9% increase from prior year); 2024: $48.04 (9% reduction from prior year); 2023: $52.92 (3% increase from prior year); 2022: $51.27 (1% reduction from prior year); and 2021: $51.80 (43% increase from prior year). |
The following table sets forth the deductions from and additions to Summary Compensation Table (“SCT ”) total compensation to calculate CAP to our PEO and non-PEO NEOs during 2025 in the PVP Table: |
PEO |
Average Non-PEO |
|||||||
Total Reported in 2025 Summary Compensation Table (SCT) |
$ |
10,461,127 |
$ |
3,316,499 |
||||
Less, value of Equity Awards reported in SCT |
(6,562,473 |
) |
(1,435,820 |
) | ||||
Plus, Fair Value of Current Year Equity Awards at 12/31/25 |
5,828,720 |
1,317,140 |
||||||
Plus, Change in Value of Prior Year Equity Awards Unvested as of 12/31/25 |
2,814,536 |
582,221 |
||||||
Plus, Change in Value of Prior Year Equity Awards that Vested at 2025 |
948,289 |
194,854 |
||||||
Compensation Actually Paid for Fiscal Year 2025 |
$ |
13,490,199 |
$ |
3,974,894 |
||||
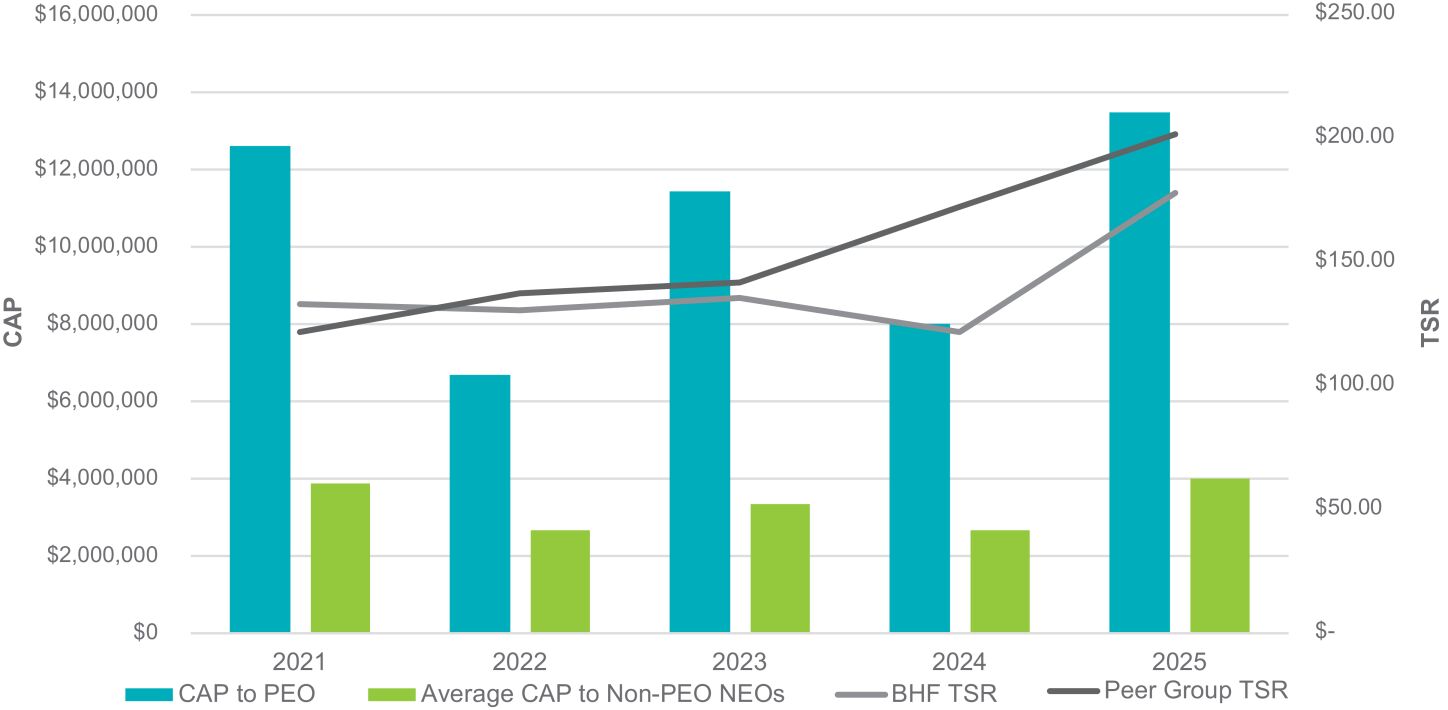
CAP vs. Company TSR and Peer Group (S&P 500 Life & Health Insurance Index) TSR | ||
There is general alignment of CAP with Company TSR, as a significant portion of our PEO’s and non-PEO NEOs’ compensation is equity-based. |
 | |
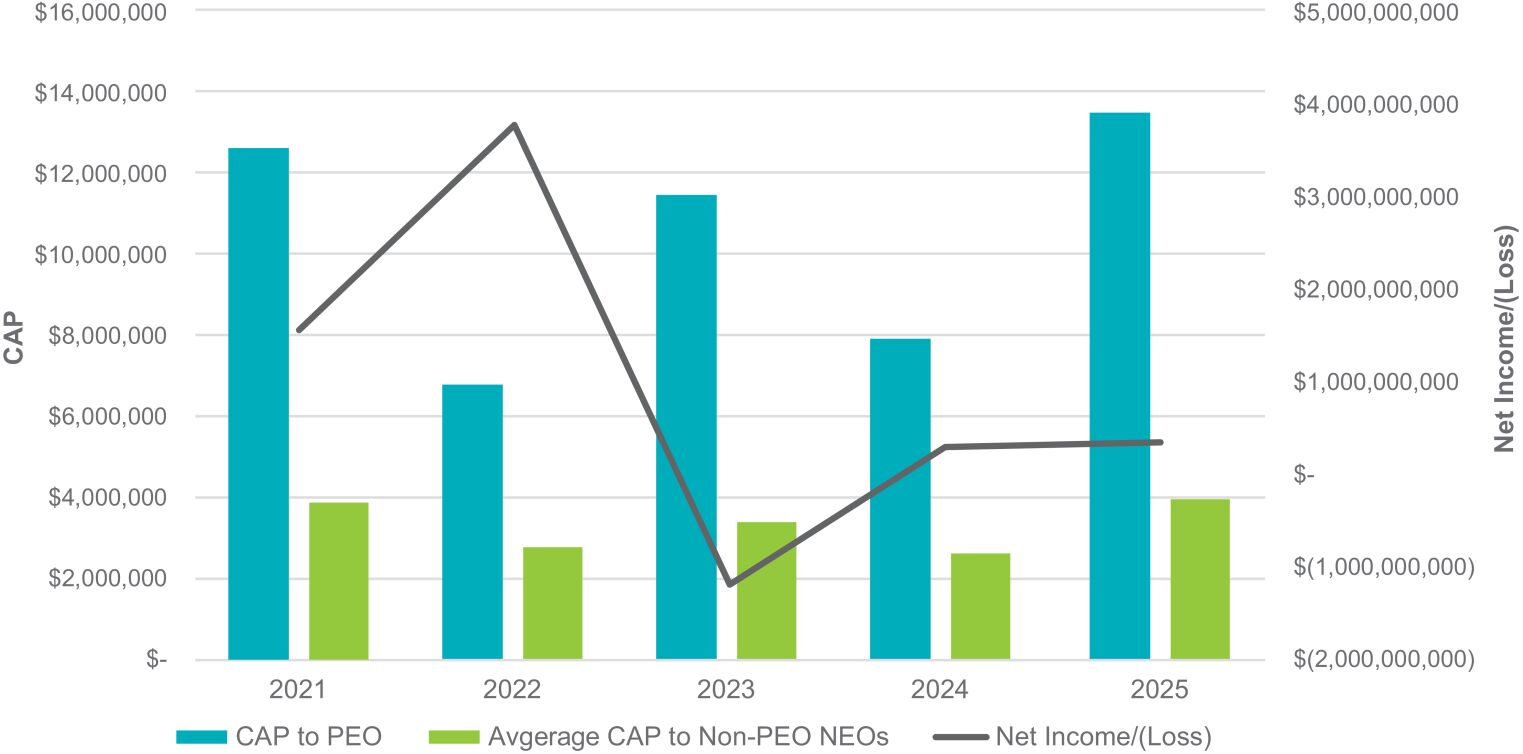
CAP vs. Net Income (Loss) | ||
The Company’s strategy is focused primarily on statutory results, and incentive compensation metrics do not include this GAAP metric. GAAP net income (loss) therefore will not necessarily align with CAP on a year-by-year |
 | |
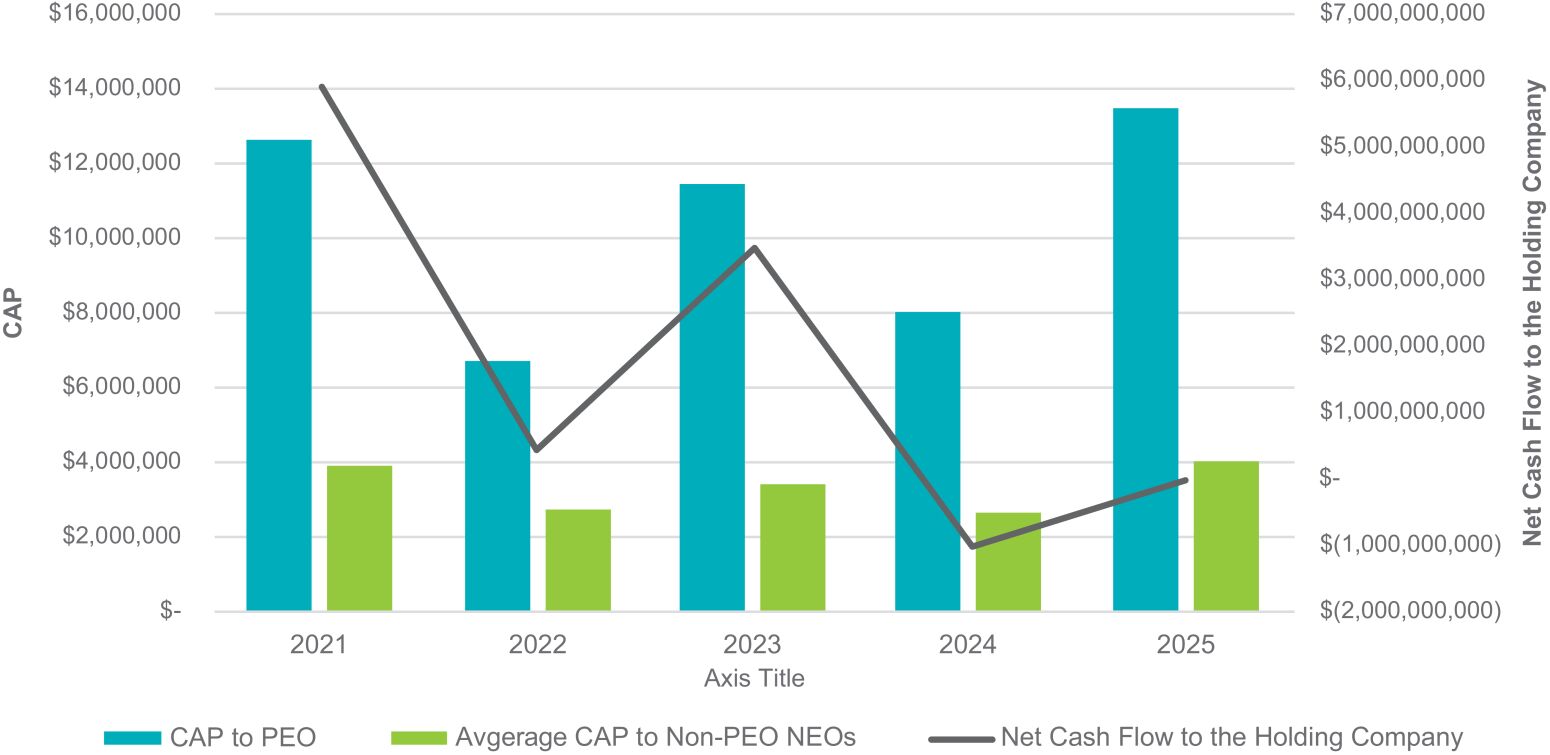
CAP vs. Net Cash Flow to the Holding Company | ||
Net Cash Flow to the Holding Company, which is one of the PSU metrics in our LTI program, is measured cumulatively over three years and therefore may not consistently align with CAP, which is measured on an annual basis. |
 | |
CAP vs. Company TSR and Peer Group (S&P 500 Life & Health Insurance Index) TSR | ||
There is general alignment of CAP with Company TSR, as a significant portion of our PEO’s and non-PEO NEOs’ compensation is equity-based. |
| |
Compensation Measures
The following performance measures reflect the Company’s most important performance measures used by the Company in 2025 to link CAP to Company performance, as further described and defined in the
Compensation Discussion and Analysis
. Corporate Expenses, Annuity Sales, Life Sales and Normalized Statutory Earnings are metrics for the 2025 STI awards, and Net Cash Flow to the Holding Company and Statutory Expense Ratio are PSU metrics in our LTI program, For more information on the 2025 STI awards, PSU Awards and actual payouts for each NEO, see “
Compensation Discussion and Analysis – Section 2 – 2025 Executive Compensation Program
.”
Most Important Performance Measures for 2025 | ||
Corporate Expenses |
Normalized Statutory Earnings | |
Annuity Sales |
Net Cash Flow to the Holding Company | |
Life Sales |
Statutory Expense Ratio | |