Pay vs Performance Disclosure - USD ($)
Dec. 31, 2025
Dec. 31, 2024
Dec. 31, 2023
Fiscal Year | Summary Compensation Table Total for PEO(1) ($) | Compensation Actually Paid to PEO(2) ($) | Average Summary Compensation Table Total for non-PEO NEOs(3) ($) | Average Compensation Actually Paid to non-PEO NEOs(4) ($) | Value of Initial Fixed $100 Investment Based On: Total Shareholder Return(5) ($) | Net Loss ($)(6) | |||||||||||||||||
(a) | (b) | (c) | (d) | (e) | (f) | (g) | |||||||||||||||||
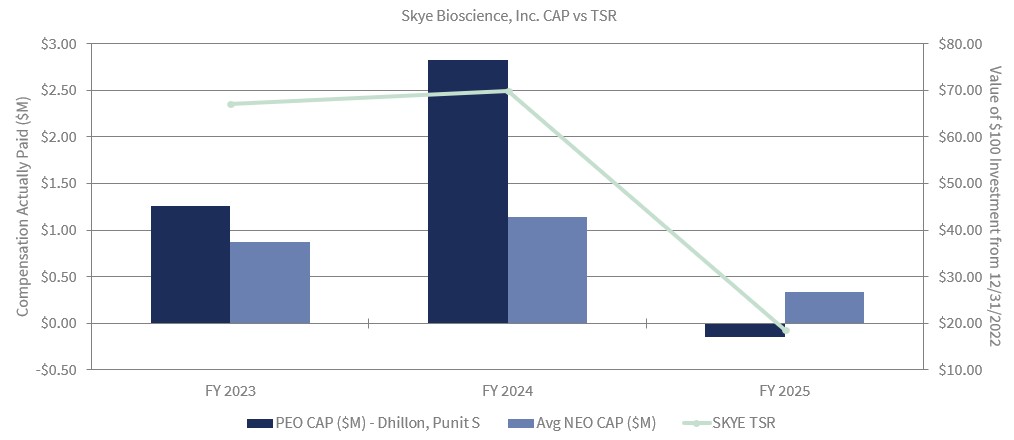
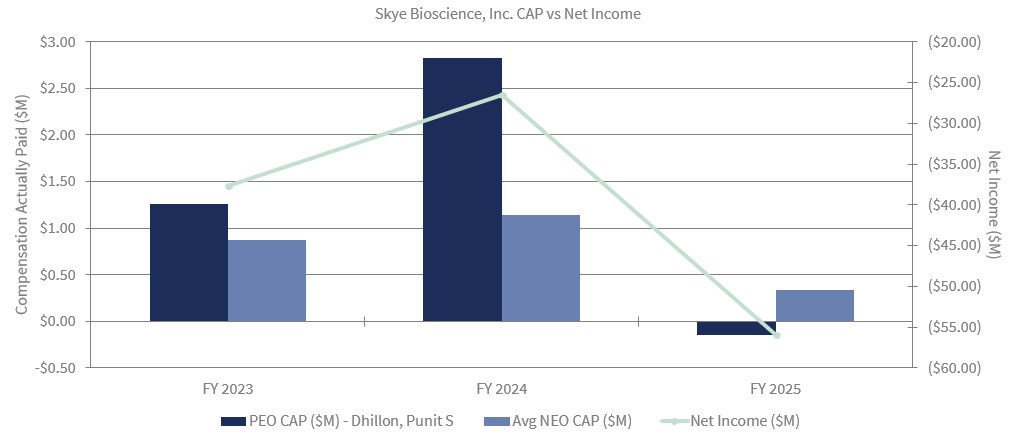
| 2025 | 1,361,831 | (148,284) | 882,264 | 339,391 | 18.51 | (55,924,814) | |||||||||||||||||
| 2024 | 6,139,625 | 2,823,424 | 2,236,997 | 1,141,803 | 69.88 | (26,567,123) | |||||||||||||||||
| 2023 | 1,807,338 | 1,254,456 | 1,270,290 | 874,797 | 67.16 | (37,644,784) | |||||||||||||||||
Fiscal Year | Reported Summary Compensation Table Total For PEO ($) | Deduction of Reported Value of Equity Awards (a) ($) | Equity Award Adjustments (b) ($) | Compensation Actually Paid to PEO ($) | |||||||||||||
| 2025 | 1,361,831 | (532,231) | (977,884) | (148,284) | |||||||||||||
| 2024 | 6,139,625 | (5,345,100) | 2,028,899 | 2,823,424 | |||||||||||||
| 2023 | 1,807,338 | (1,087,338) | 534,456 | 1,254,456 | |||||||||||||
a.The grant date fair value of equity awards represents the total of the amounts reported in the “Stock Awards” and “Option Awards” columns in the Summary Compensation Table for the applicable year.
b.The equity award adjustments for each applicable year include the addition (or subtraction, as applicable) of the following: (i) the year-end fair value of any equity awards granted in the applicable year that are outstanding and unvested as of the end of the year; (ii) the amount of change as of the end of the applicable year (from the end of the prior fiscal year) in fair value of any awards granted in prior years that are outstanding and unvested as of the end of the applicable year; (iii) for awards that are granted and vest in same applicable year, the fair value as of the vesting date; and (iv) for awards granted in prior years that vest in the applicable year, the amount equal to the change as of the vesting date (from the end of the prior fiscal year) in fair value. The valuation assumptions used to calculate fair values did not materially differ from those disclosed at the time of grant. The amounts deducted or added in calculating the equity award adjustments are as follows:
Fiscal Year | Year End Fair Value of Equity Awards Granted During the Fiscal Year ($) (i) | Year over Year Change in Fair Value of Outstanding and Unvested Equity Awards ($) (ii) | Fair Value as of Vesting Date of Equity Awards Granted and Vested in the Year ($) (iii) | Year over Year Change in Fair Value of Equity Awards Granted in Prior Years that Vested in the Year ($) (iv) | Total Equity Award Adjustments ($) | |||||||||||||||
| 2025 | 72,078 | (1,091,734) | 89,138 | (47,366) | (977,884) | |||||||||||||||
| 2024 | 1,229,022 | 152,978 | 155,374 | 491,525 | 2,028,899 | |||||||||||||||
| 2023 | 554,219 | (35,861) | 4,811 | 11,287 | 534,456 | |||||||||||||||
Fiscal Year | Average of Reported Summary Compensation Table Total For Non-PEO NEOs ($) | Deduction of Average of Reported Value of Equity Awards ($) | Equity Award Adjustments (a) ($) | Average Compensation Actually Paid to Non-PEO NEOs ($) | |||||||||||||
| 2025 | 882,264 | (319,339) | (223,534) | 339,391 | |||||||||||||
| 2024 | 2,236,997 | (1,710,384) | 615,190 | 1,141,803 | |||||||||||||
| 2023 | 1,270,290 | (794,290) | 398,797 | 874,797 | |||||||||||||
a.The amounts deducted or added in calculating the total equity award adjustments are as follows:
Fiscal Year | Year End Fair Value of Equity Awards Granted During the Fiscal Year ($) (i) | Year over Year Change in Fair Value of Outstanding and Unvested Equity Awards ($) (ii) | Fair Value as of Vesting Date of Equity Awards Granted and Vested in the Year ($) (iii) | Year over Year Change in Fair Value of Equity Awards Granted in Prior Years that Vested in the Year ($) (iv) | Total Equity Award Adjustments ($) | |||||||||||||||
| 2025 | 43,246 | (306,328) | 53,483 | (13,935) | (223,534) | |||||||||||||||
| 2024 | 247,205 | 69,279 | 50,379 | 248,327 | 615,190 | |||||||||||||||
| 2023 | 412,110 | (15,672) | 7,144 | (4,785) | 398,797 | |||||||||||||||
The graph below sets forth the relationship between the amount of Compensation Actually Paid to our PEO, the average amount of Compensation Actually Paid to our Non-PEO NEO, and the Company’s cumulative TSR over the three most recently completed fiscal years.
The graph below sets forth the amount of Compensation Actually Paid to our PEO, the amount of Compensation Actually Paid to our Non-PEO NEO, and our net income during the three most recently completed fiscal years.
As required by Section 953(a) of the Dodd-Frank Wall Street Reform and Consumer Protection Act, and Item 402(v) of Regulation S-K (the “Pay Versus Performance Rule”), we are providing the following information about the relationship between executive compensation actually paid for our principal executive officer (“PEO”) and Non-PEO named executive officers (“NEOs”) and certain financial performance of the Company for the fiscal years listed below.
The dollar amounts reported in column (d) represent (i) for 2025 the average of the amounts of total compensation reported for Ms. Arsenault and Mr. Diep in the “Total” column of the Summary Compensation Table and (ii) for 2024, the amounts of total compensation reported for Ms. Arsenault for 2022 and 2023 in the “Total” column of the applicable year’s Summary Compensation Table. Cumulative total shareholder return (“TSR”) is calculated by dividing the sum of the cumulative amount of dividends for the measurement period, assuming dividend reinvestment, and the difference between the Company’s share price at the end and the beginning of the measurement period by the Company’s share price at the beginning of the measurement period.The dollar amounts reported represent the amount of net income (loss) reflected in the Company’s audited financial statements for the applicable year.All information provided above under the “Pay Versus Performance” heading will not be deemed to be incorporated by reference into any filing of the Company under the Securities Act of 1933, as amended, whether made before or after the date hereof and irrespective of any general incorporation language in any such filing, except to the extent the Company specifically incorporates such information by reference.