Pay vs Performance Disclosure - USD ($)
Dec. 31, 2025
Dec. 31, 2024
Dec. 31, 2023
PAY VERSUS PERFORMANCE
As required by Section 953(a) of the Dodd-Frank Wall Street Reform and Consumer Protection Act and Item 402(v) of Regulation S-K, we are providing information about the relationship between executive compensation actually paid to our professional employer organization (“PEO”) and the other NEOs (as calculated in accordance with Item 402(v) of Regulation S-K) and certain financial performance measures. We are a smaller reporting company and therefore permitted to omit certain pay versus performance disclosure, such as the company selected measure. For additional information on our compensation programs and philosophy and how we design our compensation programs to align pay with performance, see the section titled “Executive Compensation.”
Year | Summary compensation table total for PEO | Compensation actually paid to PEO (4) | Average summary compensation table total for non-PEO NEOs | Average compensation actually paid to non-PEO NEOs (4) | Value of initial fixed $100 investment based on Total stockholder return (5) | Net Loss (in millions) | ||||||||||||||
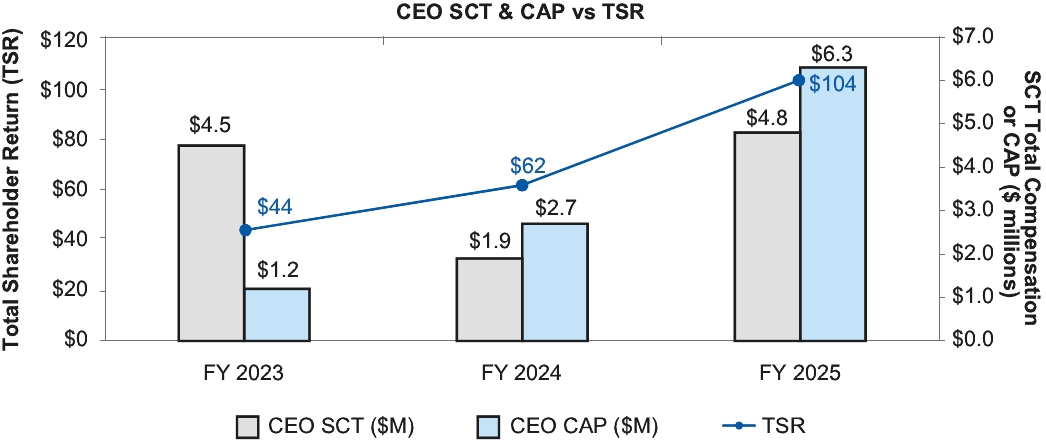
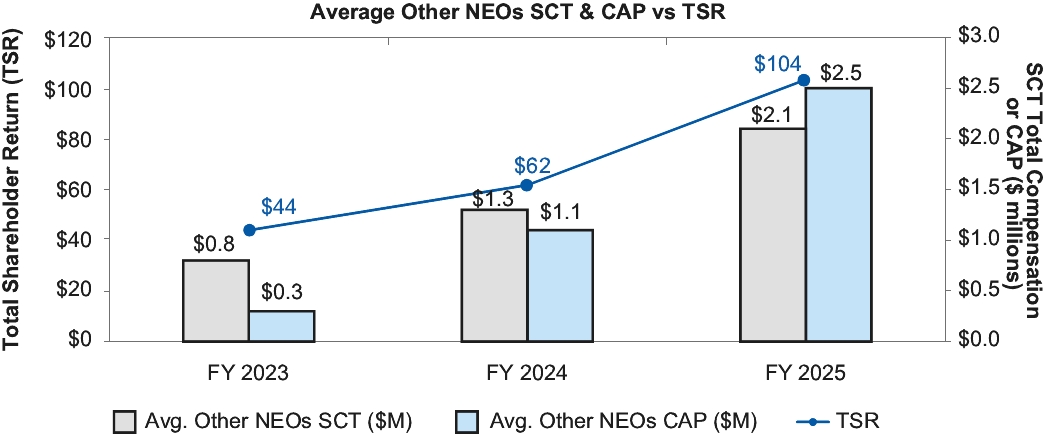
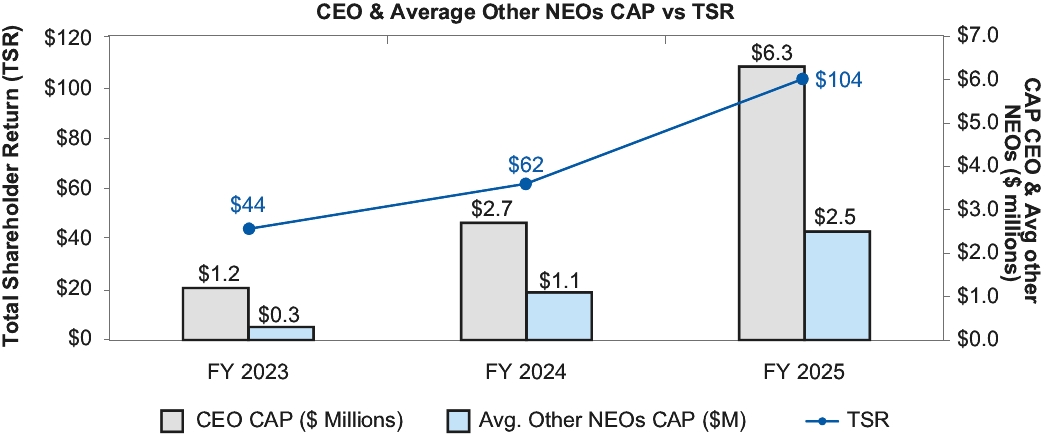
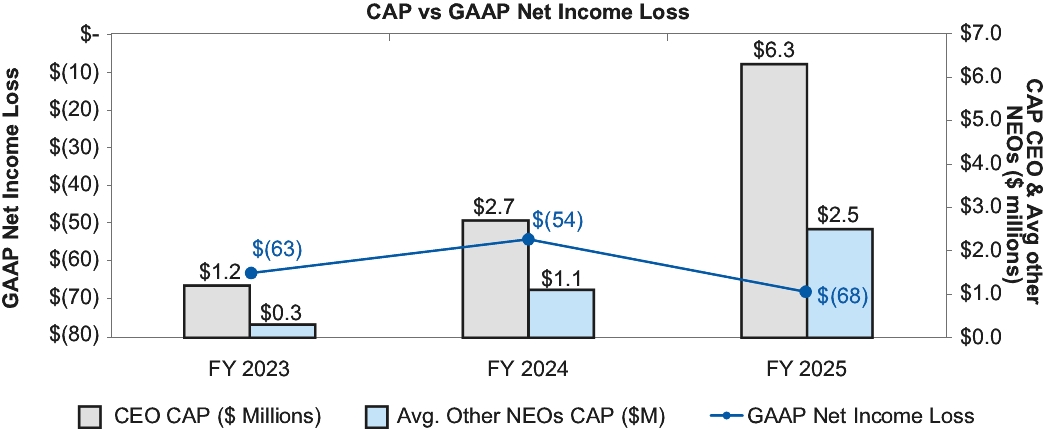
2025 (1) | $4,841,822 | $6,290,858 | $2,072,213 | $2,485,717 | $104 | $(68) | ||||||||||||||
2024 (2) | $1,941,539 | $2,715,041 | $1,298,285 | $1,062,265 | $62 | $(54) | ||||||||||||||
2023 (3) | $4,535,231 | $1,165,844 | $778,356 | $333,623 | $44 | $(63) | ||||||||||||||
(1) 2025 PEO is Dr. Shankar Musunuri; non-PEO NEOs are Dr. Arun Upadhyay, Dr. Huma Qamar and Ramesh Ramachandran
(2) 2024 PEO is Dr. Shankar Musunuri; non-PEO NEOs are Dr. Arun Upadhyay and Dr. Huma Qamar
(3) 2023 PEO is Dr. Shankar Musunuri; non-PEO NEOs are Dr. Arun Upadhyay, Michael Breininger, Quan Vu, and Jessica Crespo
(4) For fiscal year 2025, the “compensation actually paid to the PEO” and the “average compensation actually paid to the non-PEO NEOs” reflect each of the following adjustments made to the total compensation amounts reported in the Summary Compensation Table for fiscal years 2025, 2024 and 2023 computed in accordance with Item 402(v) of Regulation S-K.
(5) Shareholder return provides the value of common stock as of December 31, 2025, December 31, 2024 and December 31, 2023 assuming $100 was invested in our common stock after the market closed on December 31, 2022.
2025 | 2024 | 2023 | ||||||||||||||||||
CEO | Average Other NEOs | CEO | Average Other NEOs | CEO | Average Other NEOs | |||||||||||||||
Summary Compensation Table Total | $4,841,822 | $2,072,213 | $1,941,539 | $1,298,285 | $4,535,231 | $778,356 | ||||||||||||||
Less Stock Award and Option Value Reported in Summary Compensation Table for the Covered Year | $3,580,316 | $1,454,632 | $790,241 | $672,101 | $3,670,985 | $357,818 | ||||||||||||||
Plus (Less) Fair value of Equity Awards Granted During Fiscal Year that are Outstanding and Unvested at End of Year | $4,270,360 | $1,734,336 | $933,006 | $360,780 | $1,610,172 | $0 | ||||||||||||||
Plus (Less) Fair value of Equity Awards Granted in Any Prior Fiscal Year that are Outstanding and Unvested at End of Year | $624,720 | $121,577 | $487,728 | $53,738 | $(1,033,297) | $(11,247) | ||||||||||||||
Plus Fair Value at Vesting Date of Awards Granted and Vested During the Fiscal Year | $0 | $0 | $0 | $0 | $0 | $0 | ||||||||||||||
Plus (Less) Change in Fair Value of Equity Awards granted in Prior Years that Vested During the Fiscal Year | $134,271 | $12,223 | $143,010 | $21,562 | $(275,277) | $(73) | ||||||||||||||
Less Fair Value of Equity Awards Granted in Prior Year that were Forfeited During the Fiscal Year | $0 | $0 | $0 | $0 | $0 | $(75,595) | ||||||||||||||
Plus Value of Dividends or Other Earnings Paid on Stock or Option Awards not Otherwise Reflected in Fair Value or Total Compensation | $0 | $0 | $0 | $0 | $0 | $0 | ||||||||||||||
Compensation Actually Paid | $6,290,858 | $2,485,717 | $2,715,041 | $1,062,265 | $1,165,844 | $333,623 | ||||||||||||||
(1) 2025 PEO is Dr. Shankar Musunuri; non-PEO NEOs are Dr. Arun Upadhyay, Dr. Huma Qamar and Ramesh Ramachandran
(2) 2024 PEO is Dr. Shankar Musunuri; non-PEO NEOs are Dr. Arun Upadhyay and Dr. Huma Qamar
(3) 2023 PEO is Dr. Shankar Musunuri; non-PEO NEOs are Dr. Arun Upadhyay, Michael Breininger, Quan Vu, and Jessica Crespo
(4) For fiscal year 2025, the “compensation actually paid to the PEO” and the “average compensation actually paid to the non-PEO NEOs” reflect each of the following adjustments made to the total compensation amounts reported in the Summary Compensation Table for fiscal years 2025, 2024 and 2023 computed in accordance with Item 402(v) of Regulation S-K.
2025 | 2024 | 2023 | ||||||||||||||||||
CEO | Average Other NEOs | CEO | Average Other NEOs | CEO | Average Other NEOs | |||||||||||||||
Summary Compensation Table Total | $4,841,822 | $2,072,213 | $1,941,539 | $1,298,285 | $4,535,231 | $778,356 | ||||||||||||||
Less Stock Award and Option Value Reported in Summary Compensation Table for the Covered Year | $3,580,316 | $1,454,632 | $790,241 | $672,101 | $3,670,985 | $357,818 | ||||||||||||||
Plus (Less) Fair value of Equity Awards Granted During Fiscal Year that are Outstanding and Unvested at End of Year | $4,270,360 | $1,734,336 | $933,006 | $360,780 | $1,610,172 | $0 | ||||||||||||||
Plus (Less) Fair value of Equity Awards Granted in Any Prior Fiscal Year that are Outstanding and Unvested at End of Year | $624,720 | $121,577 | $487,728 | $53,738 | $(1,033,297) | $(11,247) | ||||||||||||||
Plus Fair Value at Vesting Date of Awards Granted and Vested During the Fiscal Year | $0 | $0 | $0 | $0 | $0 | $0 | ||||||||||||||
Plus (Less) Change in Fair Value of Equity Awards granted in Prior Years that Vested During the Fiscal Year | $134,271 | $12,223 | $143,010 | $21,562 | $(275,277) | $(73) | ||||||||||||||
Less Fair Value of Equity Awards Granted in Prior Year that were Forfeited During the Fiscal Year | $0 | $0 | $0 | $0 | $0 | $(75,595) | ||||||||||||||
Plus Value of Dividends or Other Earnings Paid on Stock or Option Awards not Otherwise Reflected in Fair Value or Total Compensation | $0 | $0 | $0 | $0 | $0 | $0 | ||||||||||||||
Compensation Actually Paid | $6,290,858 | $2,485,717 | $2,715,041 | $1,062,265 | $1,165,844 | $333,623 | ||||||||||||||
(4) For fiscal year 2025, the “compensation actually paid to the PEO” and the “average compensation actually paid to the non-PEO NEOs” reflect each of the following adjustments made to the total compensation amounts reported in the Summary Compensation Table for fiscal years 2025, 2024 and 2023 computed in accordance with Item 402(v) of Regulation S-K.
2025 | 2024 | 2023 | ||||||||||||||||||
CEO | Average Other NEOs | CEO | Average Other NEOs | CEO | Average Other NEOs | |||||||||||||||
Summary Compensation Table Total | $4,841,822 | $2,072,213 | $1,941,539 | $1,298,285 | $4,535,231 | $778,356 | ||||||||||||||
Less Stock Award and Option Value Reported in Summary Compensation Table for the Covered Year | $3,580,316 | $1,454,632 | $790,241 | $672,101 | $3,670,985 | $357,818 | ||||||||||||||
Plus (Less) Fair value of Equity Awards Granted During Fiscal Year that are Outstanding and Unvested at End of Year | $4,270,360 | $1,734,336 | $933,006 | $360,780 | $1,610,172 | $0 | ||||||||||||||
Plus (Less) Fair value of Equity Awards Granted in Any Prior Fiscal Year that are Outstanding and Unvested at End of Year | $624,720 | $121,577 | $487,728 | $53,738 | $(1,033,297) | $(11,247) | ||||||||||||||
Plus Fair Value at Vesting Date of Awards Granted and Vested During the Fiscal Year | $0 | $0 | $0 | $0 | $0 | $0 | ||||||||||||||
Plus (Less) Change in Fair Value of Equity Awards granted in Prior Years that Vested During the Fiscal Year | $134,271 | $12,223 | $143,010 | $21,562 | $(275,277) | $(73) | ||||||||||||||
Less Fair Value of Equity Awards Granted in Prior Year that were Forfeited During the Fiscal Year | $0 | $0 | $0 | $0 | $0 | $(75,595) | ||||||||||||||
Plus Value of Dividends or Other Earnings Paid on Stock or Option Awards not Otherwise Reflected in Fair Value or Total Compensation | $0 | $0 | $0 | $0 | $0 | $0 | ||||||||||||||
Compensation Actually Paid | $6,290,858 | $2,485,717 | $2,715,041 | $1,062,265 | $1,165,844 | $333,623 | ||||||||||||||