Pay Versus Performance Disclosure
As required by Section 952(a) of the Dodd-Frank Wall Street Reform and Consumer Protection Act and Item 402(v) of Regulation S-K, we are providing the following information about the relationship between executive compensation actually paid and our financial performance for each of the last three completed fiscal years. In determining the “compensation actually paid” to our NEOs, we are required to make various adjustments to amounts that have been previously reported in the Summary Compensation Table in previous years, as the SEC’s valuation methods for this disclosure differ from those required in the Summary Compensation Table. For our NEOs other than our principal executive officer (the “PEO”), compensation is reported as an average.
Year |
|
Summary Compensation Table Total for PEO(1) |
|
|
Compensation Actually Paid to PEO(2) |
|
|
Average Summary |
|
|
Average Compensation |
|
|
Value of Initial Fixed $100 Investment Based On Total Stockholder Return(5) |
|
|
Net Loss |
|
||||||
2025 |
|
$ |
1,756,864 |
|
|
$ |
1,338,062 |
|
|
$ |
735,616 |
|
|
$ |
567,228 |
|
|
$ |
63.90 |
|
|
$ |
11,998 |
|
2024 |
|
$ |
1,408,237 |
|
|
$ |
1,606,990 |
|
|
$ |
424,596 |
|
|
$ |
474,782 |
|
|
$ |
102.44 |
|
|
$ |
11,050 |
|
2023 |
|
$ |
1,388,309 |
|
|
$ |
1,146,211 |
|
|
$ |
846,677 |
|
|
$ |
701,141 |
|
|
$ |
73.17 |
|
|
$ |
8,572 |
|
Description of Amount |
2025 |
|
2024 |
|
2023 |
|
|||
Summary Compensation Table - Total Compensation |
$ |
1,756,864 |
|
$ |
1,408,237 |
|
$ |
1,388,309 |
|
- Grant Date Fair Value of Option Awards and Stock Awards Granted in Fiscal Year |
$ |
(749,798 |
) |
$ |
(401,471 |
) |
$ |
(481,050 |
) |
+ Fair Value at Fiscal Year-End of Outstanding and Unvested Option Awards and Stock Awards Granted in Fiscal Year |
$ |
269,465 |
|
$ |
595,407 |
|
$ |
171,028 |
|
+ Fair Value at Vesting of Option Awards and Stock Awards Granted in Fiscal Year That Vested During Fiscal Year |
$ |
61,044 |
|
$ |
— |
|
$ |
— |
|
+ Change in Fair Value as of Vesting Date of Option Awards and Stock Awards Granted in Prior Fiscal Years For Which Applicable Vesting Conditions Were Satisfied During Fiscal Year |
$ |
487 |
|
$ |
4,817 |
|
$ |
67,924 |
|
Compensation Actually Paid |
$ |
1,338,062 |
|
$ |
1,606,990 |
|
$ |
1,146,211 |
|
The dollar amounts reported in this column represent the average of the amounts reported for the non-PEO NEOs in the “Total” column of the Summary Compensation Table in the applicable fiscal year.
Description of Amount |
2025 |
|
2024 |
|
2023 |
|
|||
Summary Compensation Table - Total Compensation |
$ |
735,616 |
|
$ |
424,596 |
|
$ |
846,677 |
|
- Grant Date Fair Value of Option Awards and Stock Awards Granted in Fiscal Year |
$ |
(305,021 |
) |
$ |
(100,368 |
) |
$ |
(276,604 |
) |
+ Fair Value at Fiscal Year-End of Outstanding and Unvested Option Awards and Stock Awards Granted in Fiscal Year |
$ |
105,928 |
|
$ |
148,852 |
|
$ |
98,341 |
|
+ Fair Value at Vesting of Option Awards and Stock Awards Granted in Fiscal Year That Vested During Fiscal Year |
$ |
30,522 |
|
$ |
— |
|
$ |
— |
|
+ Change in Fair Value as of Vesting Date of Option Awards and Stock Awards Granted in Prior Fiscal Years For Which Applicable Vesting Conditions Were Satisfied During Fiscal Year |
$ |
183 |
|
$ |
1,702 |
|
$ |
32,727 |
|
Compensation Actually Paid |
$ |
567,228 |
|
$ |
474,782 |
|
$ |
701,141 |
|
Description of Amount |
2025 |
|
2024 |
|
2023 |
|
|||
Summary Compensation Table - Total Compensation |
$ |
1,756,864 |
|
$ |
1,408,237 |
|
$ |
1,388,309 |
|
- Grant Date Fair Value of Option Awards and Stock Awards Granted in Fiscal Year |
$ |
(749,798 |
) |
$ |
(401,471 |
) |
$ |
(481,050 |
) |
+ Fair Value at Fiscal Year-End of Outstanding and Unvested Option Awards and Stock Awards Granted in Fiscal Year |
$ |
269,465 |
|
$ |
595,407 |
|
$ |
171,028 |
|
+ Fair Value at Vesting of Option Awards and Stock Awards Granted in Fiscal Year That Vested During Fiscal Year |
$ |
61,044 |
|
$ |
— |
|
$ |
— |
|
+ Change in Fair Value as of Vesting Date of Option Awards and Stock Awards Granted in Prior Fiscal Years For Which Applicable Vesting Conditions Were Satisfied During Fiscal Year |
$ |
487 |
|
$ |
4,817 |
|
$ |
67,924 |
|
Compensation Actually Paid |
$ |
1,338,062 |
|
$ |
1,606,990 |
|
$ |
1,146,211 |
|
The dollar amounts reported in this column represent the average of the amounts reported for the non-PEO NEOs in the “Total” column of the Summary Compensation Table in the applicable fiscal year.
Description of Amount |
2025 |
|
2024 |
|
2023 |
|
|||
Summary Compensation Table - Total Compensation |
$ |
735,616 |
|
$ |
424,596 |
|
$ |
846,677 |
|
- Grant Date Fair Value of Option Awards and Stock Awards Granted in Fiscal Year |
$ |
(305,021 |
) |
$ |
(100,368 |
) |
$ |
(276,604 |
) |
+ Fair Value at Fiscal Year-End of Outstanding and Unvested Option Awards and Stock Awards Granted in Fiscal Year |
$ |
105,928 |
|
$ |
148,852 |
|
$ |
98,341 |
|
+ Fair Value at Vesting of Option Awards and Stock Awards Granted in Fiscal Year That Vested During Fiscal Year |
$ |
30,522 |
|
$ |
— |
|
$ |
— |
|
+ Change in Fair Value as of Vesting Date of Option Awards and Stock Awards Granted in Prior Fiscal Years For Which Applicable Vesting Conditions Were Satisfied During Fiscal Year |
$ |
183 |
|
$ |
1,702 |
|
$ |
32,727 |
|
Compensation Actually Paid |
$ |
567,228 |
|
$ |
474,782 |
|
$ |
701,141 |
|
Compensation Actually Paid and Total Stockholder Return
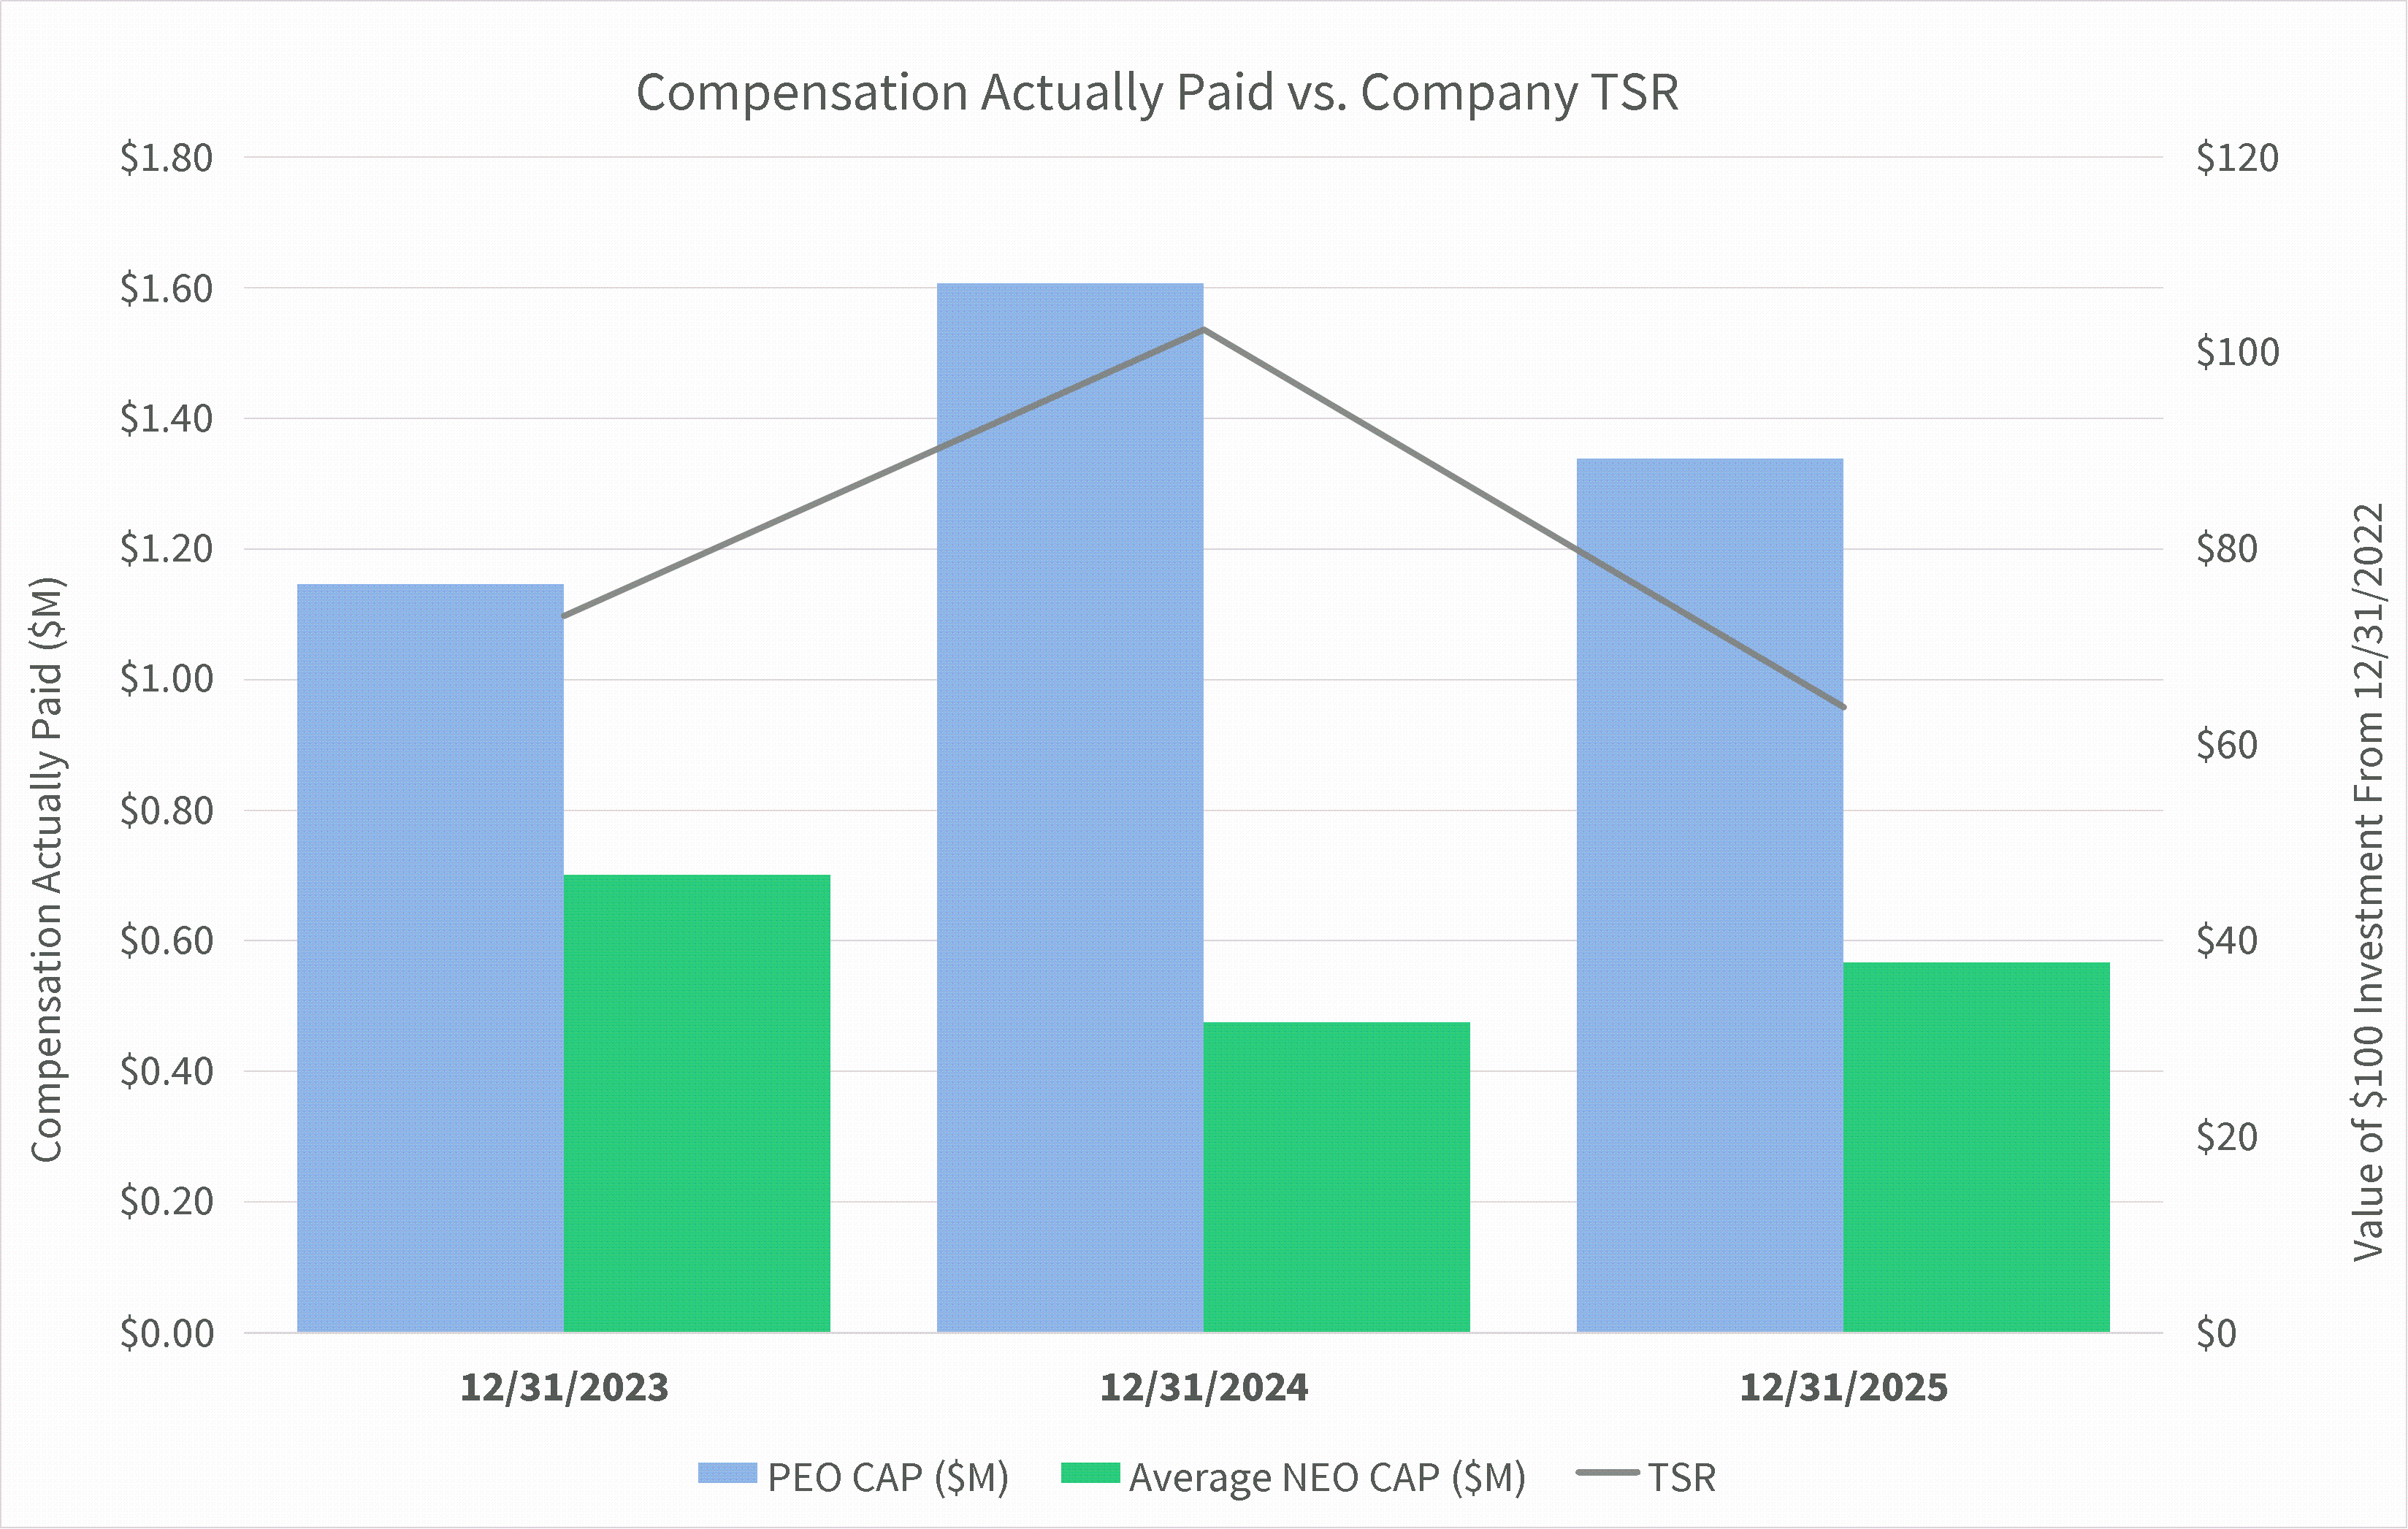
The following graph reflects the relationship between the PEO and average non-PEO NEO compensation "actually paid" (“CAP”) versus the Company's cumulative Total Shareholder Return (“TSR”), assuming an initial fixed investment of $100, for the fiscal years ended December 31, 2025, 2024, and 2023.
Compensation Actually Paid and Net Loss
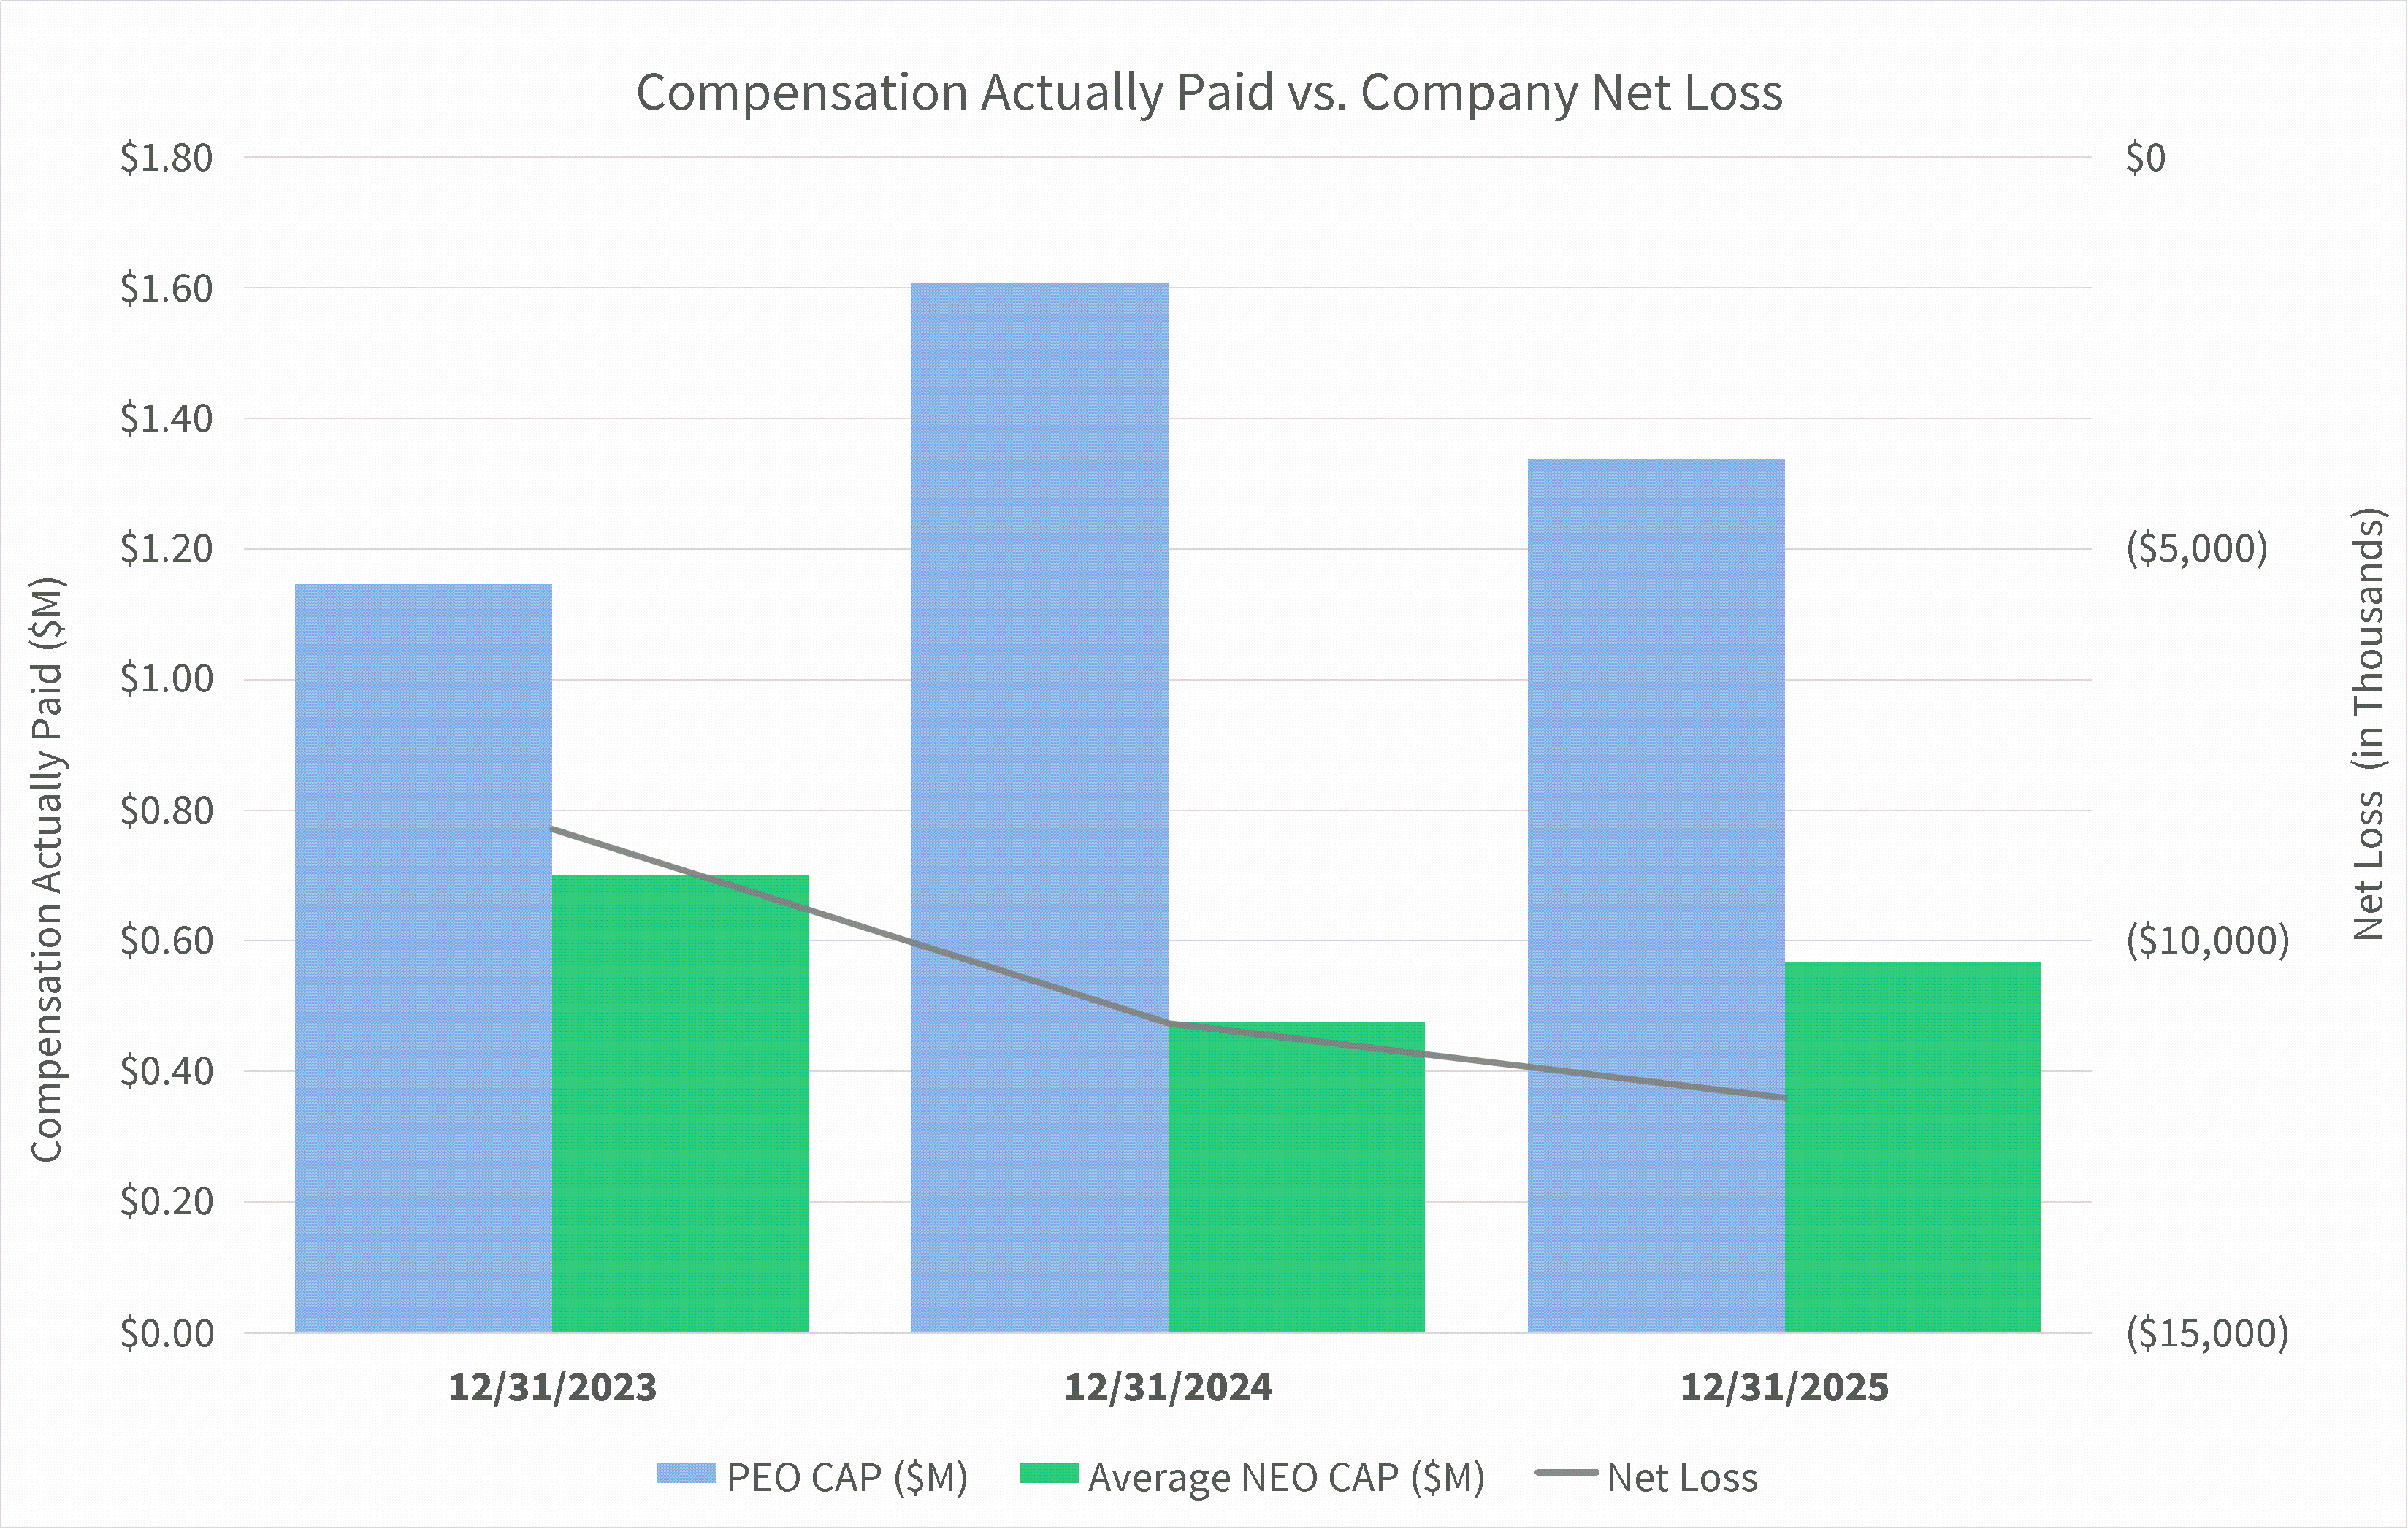
The following graph reflects the relationship between the PEO and average non-PEO NEO CAP and the Company’s net loss for the fiscal years ended December 31, 2025, 2024, and 2023.