Pay Versus Performance
As required by Section 953(a) of the Dodd-Frank Wall Street Reform and Consumer Protection Act, and Item 402(v) of Regulation S-K, we are providing the following information about the relationship between executive compensation actually paid (CAP), as defined under Item 402(v), and certain financial performance measures of the Company. For further information concerning the Company’s variable pay-for-performance philosophy and how the Company aligns executive compensation with the Company’s performance, refer to “Executive Compensation – Compensation Discussion & Analysis.”
Pay Versus Performance Table
| Compensation Actually Paid to PEO(2) | Average Summary Compensation Table Total for Non-PEO NEOs(3) | Average Compensation Actually Paid to Non-PEO NEOs(2) | Value of Initial Fixed $100 Investment Based On: | |||||||||||||||||||||||||||||
| Year | Summary Compensation Table Total for PEO(1) | Total Stockholder Return(4) | Peer Group Total Stockholder Return(4) | Net Income (millions) | Gross Bookings (millions)(5) | |||||||||||||||||||||||||||
| 2025 | $ | 35,595,826 | $ | 66,651,137 | $ | 15,453,649 | $ | 24,947,935 | $ | 160.22 | $ | 258.38 | $ | 10,053 | $ | 193,454 | ||||||||||||||||
| 2024 | $ | 39,408,629 | $ | 74,251,272 | $ | 9,873,647 | $ | 11,581,188 | $ | 118.27 | $ | 208.30 | $ | 9,856 | $ | 162,773 | ||||||||||||||||
| 2023 | $ | 24,248,209 | $ | 109,669,788 | $ | 10,391,600 | $ | 31,757,380 | $ | 120.73 | $ | 152.48 | $ | 1,887 | $ | 137,865 | ||||||||||||||||
| 2022 | $ | 24,276,977 | ($ | 8,946,037) | $ | 9,583,840 | ($ | 295,737) | $ | 48.49 | $ | 96.60 | ($ | 9,141) | $ | 115,395 | ||||||||||||||||
| 2021 | $ | 19,937,818 | $ | 4,212,154 | $ | 8,227,049 | $ | 3,380,603 | $ | 82.22 | $ | 134.53 | ($ | 496) | $ | 90,415 | ||||||||||||||||
| (1) | Total compensation reported for Mr. Khosrowshahi for each corresponding year in the “Total” column of the Summary Compensation Table. Refer to “Executive Compensation – Executive Compensation Tables – Summary Compensation Table.” |
| PEO ($) | Average Non-PEO NEO ($) | |||||||
| Reported Summary Compensation Table | $ | 35,595,826 | $ | 15,453,649 | ||||
| Reported Grant Date Value of Equity Awards | ($ | 31,119,287) | ($ | 12,817,910) | ||||
| Year-End Fair Value of Equity Awards Granted During the Year | $ | 27,986,653 | $ | 11,100,614 | ||||
| Change in Fair Value as of Year-End for Unvested Equity Awards Granted in Prior Years | $ | 26,036,095 | $ | 6,690,638 | ||||
| Fair Value as of Vesting Date of Equity Awards Granted and Vested in the Year | — | $ | 1,209,805 | |||||
| Change in Fair Value as of Vest Date for Equity Awards Granted in Prior Years that Vested in the Year | $ | 8,151,849 | $ | 3,311,138 | ||||
| Compensation Actually Paid to PEO | $ | 66,651,137 | $ | 24,947,935 | ||||
| The assumptions used in calculating the fair value of the equity awards did not differ in any material respect from the assumptions used to calculate the grant date fair value of the awards as reported in the Summary Compensation Table, except that the fair value calculations of (i) the unvested stock options used an estimated term between 1.0 years and 4.2 years in 2025, as compared to an estimated term of 4.8 years used to calculate the grant date fair value of such awards, and (ii) the PRSUs assumed payout multipliers at current expectations, which range from 0% to 150% across different grant years and metrics, in each case as compared to the grant date fair value calculations which assumed a payout at target. |
| PEO ($) | Average Non-PEO NEO ($) | |||||||
| Reported Summary Compensation Table | $ | 35,595,826 | $ | 15,453,649 | ||||
| Reported Grant Date Value of Equity Awards | ($ | 31,119,287) | ($ | 12,817,910) | ||||
| Year-End Fair Value of Equity Awards Granted During the Year | $ | 27,986,653 | $ | 11,100,614 | ||||
| Change in Fair Value as of Year-End for Unvested Equity Awards Granted in Prior Years | $ | 26,036,095 | $ | 6,690,638 | ||||
| Fair Value as of Vesting Date of Equity Awards Granted and Vested in the Year | — | $ | 1,209,805 | |||||
| Change in Fair Value as of Vest Date for Equity Awards Granted in Prior Years that Vested in the Year | $ | 8,151,849 | $ | 3,311,138 | ||||
| Compensation Actually Paid to PEO | $ | 66,651,137 | $ | 24,947,935 | ||||
| The assumptions used in calculating the fair value of the equity awards did not differ in any material respect from the assumptions used to calculate the grant date fair value of the awards as reported in the Summary Compensation Table, except that the fair value calculations of (i) the unvested stock options used an estimated term between 1.0 years and 4.2 years in 2025, as compared to an estimated term of 4.8 years used to calculate the grant date fair value of such awards, and (ii) the PRSUs assumed payout multipliers at current expectations, which range from 0% to 150% across different grant years and metrics, in each case as compared to the grant date fair value calculations which assumed a payout at target. |
CAP Versus TSR and Peer TSR
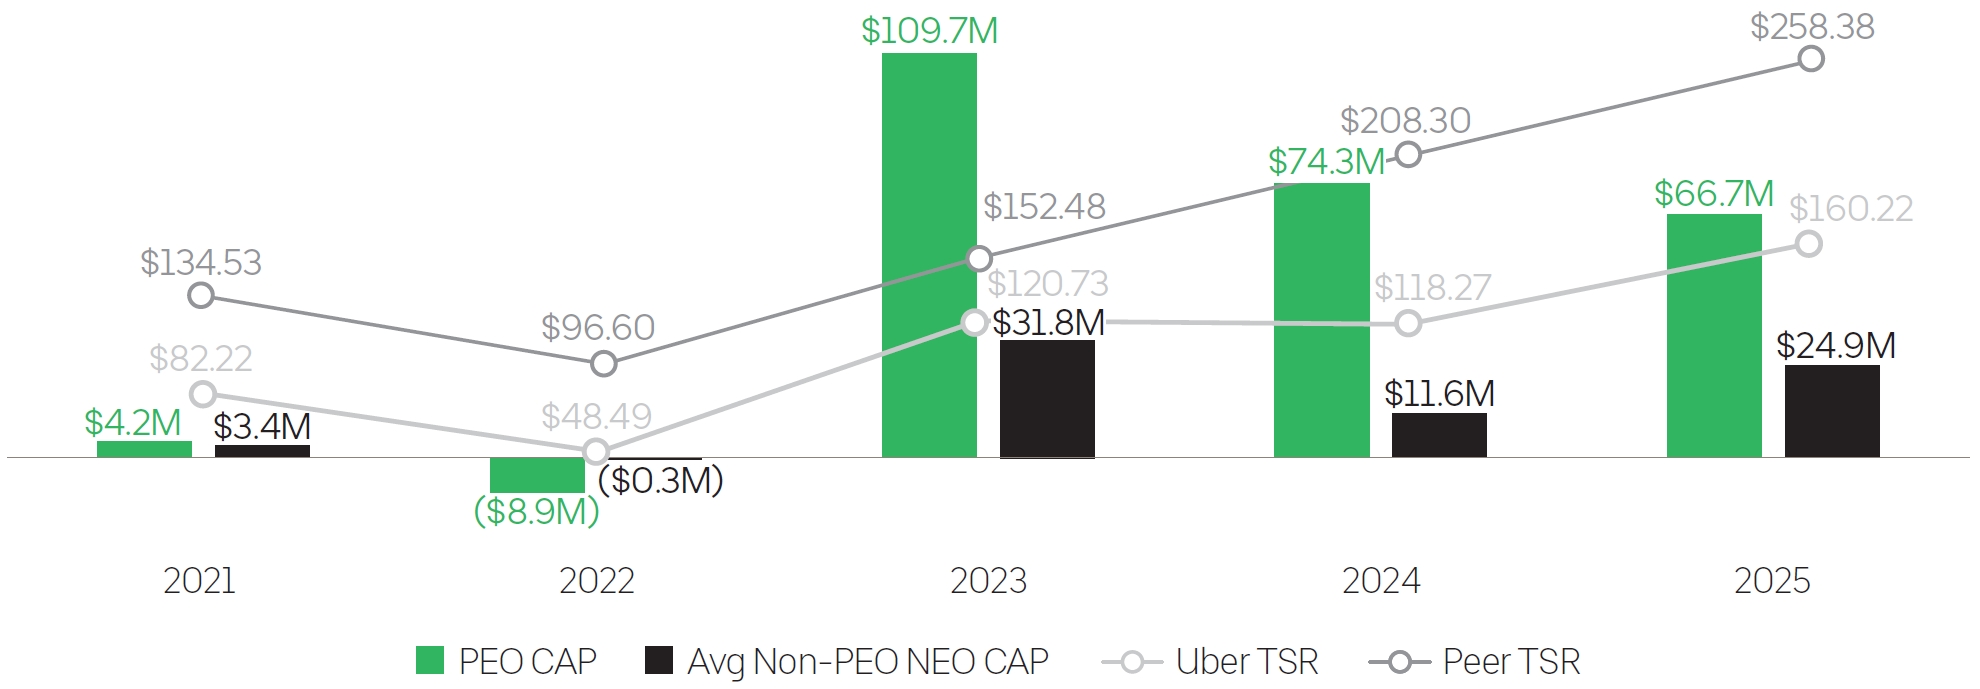
The graph below compares CAP, as computed in accordance with Item 402(v) of Regulation S-K, to Uber’s cumulative TSR and the TSR of its peer group, the S&P 500 IT, over the past five years.
CAP Versus Net Income
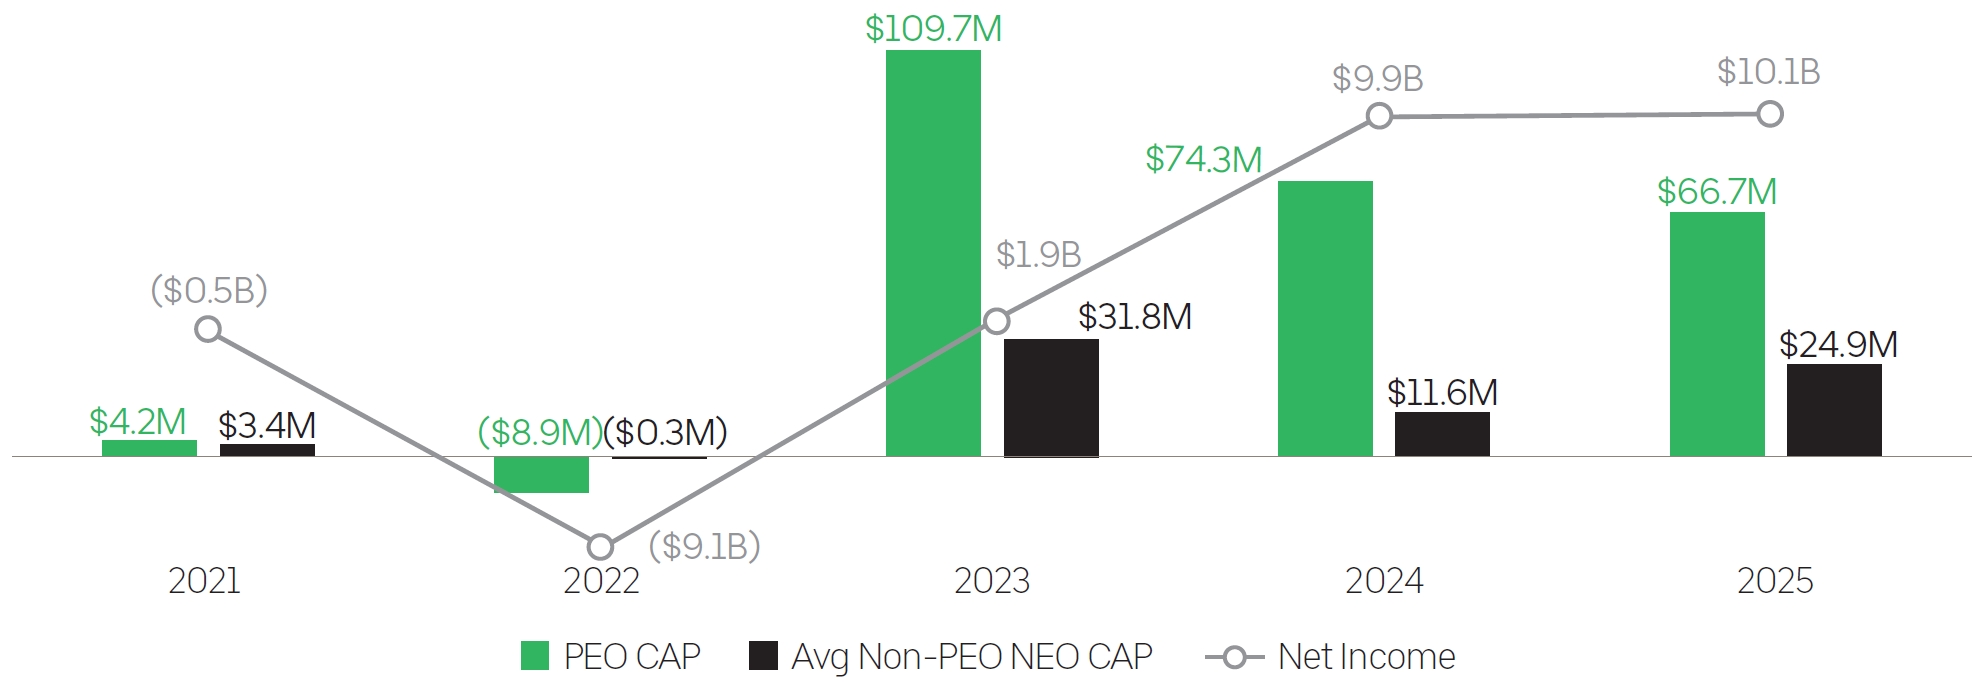
The graph below compares CAP, as computed in accordance with Item 402(v) of Regulation S-K, to Uber’s reported Net Income in each respective year.
CAP Versus Gross Bookings
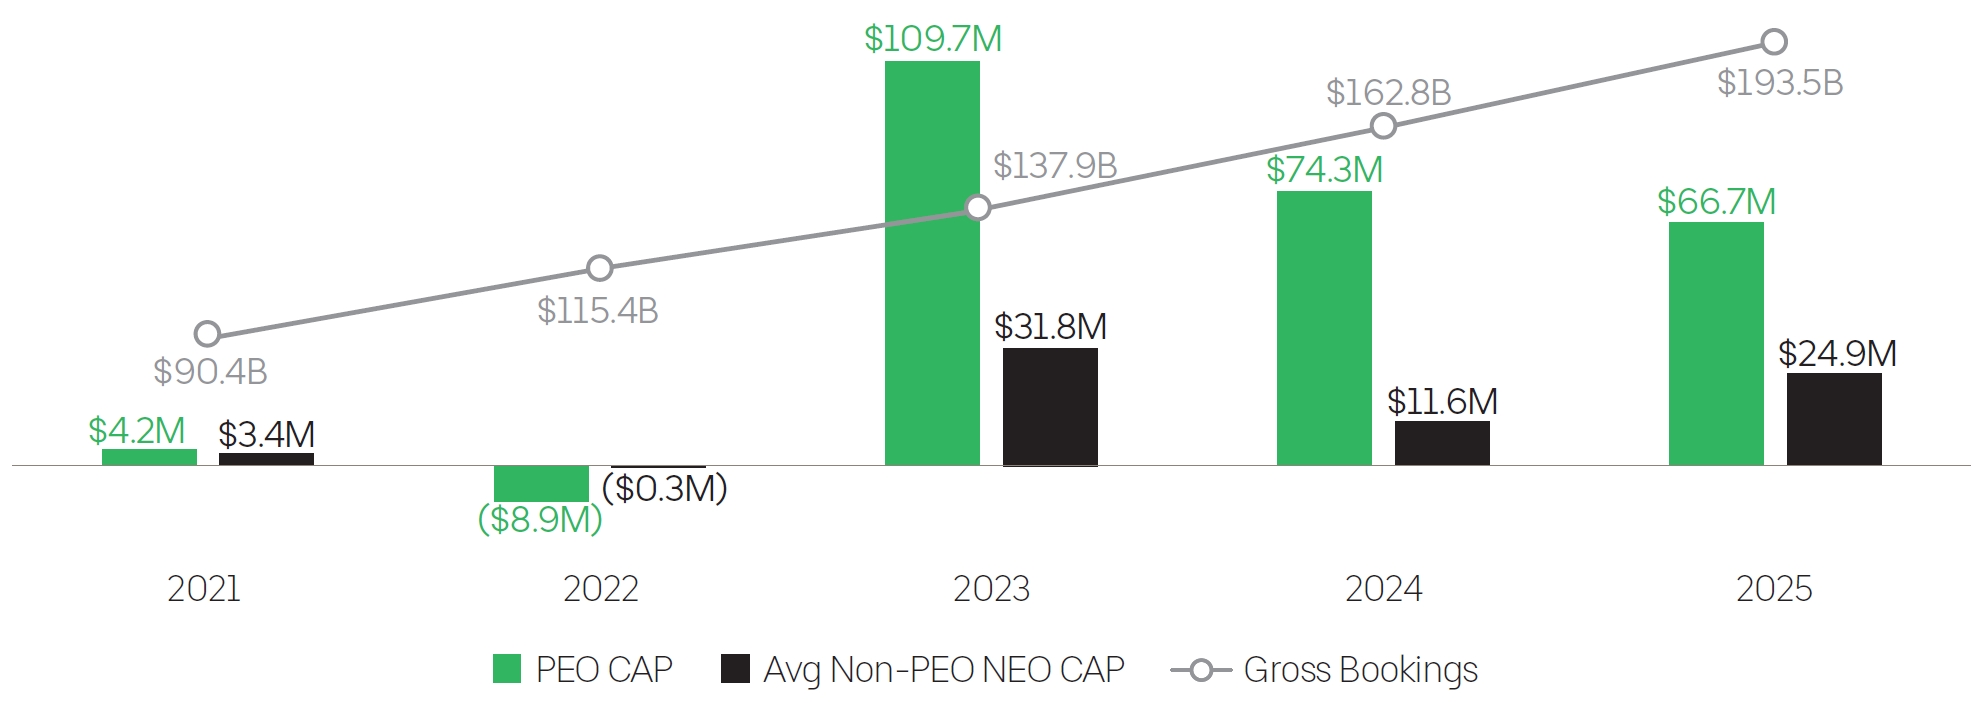
The graph below compares CAP, as computed in accordance with Item 402(v) of Regulation S-K, to Uber’s reported Gross Bookings in each respective year.
| Most Important Measures to Determine FY25 CAP |
Gross Bookings Adjusted EBITDA Adjusted EBITDA less SBC TSR Safety Autonomous Vehicles |