Pay vs Performance Disclosure - USD ($)
Dec. 31, 2025
Dec. 31, 2024
Dec. 31, 2023
Dec. 31, 2022
Dec. 31, 2021
Pay Versus Performance Table
As required by Item 402(v) of Regulation S-K, we are providing the following information regarding the relationship between executive compensation and our financial performance for each of the last four completed fiscal years. The table below summarizes compensation values both previously reported in our Summary Compensation Table, as well as the adjusted values required in this section for the applicable years. Note that for our Named Executive Officers (each an “NEO”) other than our principal executive officer (the “PEO”), compensation is reported as an average.
| Year | | | Summary Compensation Table Total for First PEO(1) | | | Summary Compensation Table Total for Second PEO(1) | | | Compensation Actually Paid to First PEO(1) | | | Compensation Actually Paid to Second PEO(1) | | | Average Summary Compensation Table Total for Non-PEO NEOs(1) | | | Average Compensation Actually Paid to Non-PEO NEOs(1)(2) | | | Value of Initial Fixed $100 Investment Based On: | | | Net Income (Loss) (in thousands) | | | Adjusted EBITDA (in thousands) | | |||||||||||||||||||||||||||||||||
| | Total Shareholder Return | | | Peer Group Total Shareholder Return(3) | | ||||||||||||||||||||||||||||||||||||||||||||||||||||||||
| 2025 | | | | | N/A | | | | | | 7,231,722 | | | | | | N/A | | | | | | 7,493,935 | | | | | | 3,557,991 | | | | | | 3,115,588 | | | | | | 81.20 | | | | | | 193.88 | | | | | | 50,481 | | | | | | 353,024 | | |
| 2024 | | | | | N/A | | | | | | 6,962,497 | | | | | | N/A | | | | | | 1,775,784 | | | | | | 2,309,945 | | | | | | 960,713 | | | | | | 75.85 | | | | | | 183.09 | | | | | | 51,918 | | | | | | 347,403 | | |
| 2023 | | | | | N/A | | | | | | 7,132,091 | | | | | | N/A | | | | | | 1,904,420 | | | | | | 2,322,168 | | | | | | 1,158,681 | | | | | | 96.84 | | | | | | 193.65 | | | | | | (23,360) | | | | | | 248,880 | | |
| 2022 | | | | | N/A | | | | | | 2,548,319 | | | | | | N/A | | | | | | 1,886,664 | | | | | | 915,480 | | | | | | 899,231 | | | | | | 110.28 | | | | | | 181.52 | | | | | | (20,145) | | | | | | 206,233 | | |
| 2021 | | | | | 7,234,574 | | | | | | 8,123,233 | | | | | | 8,207,367 | | | | | | 16,199,112 | | | | | | 2,713,792 | | | | | | 3,627,261 | | | | | | 87.29 | | | | | | 112.04 | | | | | | (131,891) | | | | | | 125,940 | | |
(1)
The PEO and the non-PEO NEOs for each year are as follows:
(i)
2025: Mr. Jardon, Second PEO; Messrs. Fanning, Maiworm, Geddes, McAlister, Russell, NEOs
(ii)
2024, 2023 and 2022: Mr. Jardon, Second PEO; Messrs. Fanning, Geddes, McAlister, Russell, NEOs
(iii)
2021: Mr. Kearney, First PEO; Mr. Jardon, Second PEO; Messrs. Fanning, Geddes, McAlister, Russell and Symington and Ms. Cougle, NEOs
(2)
To calculate Compensation Actually Paid (“CAP”), the following amounts were deducted from and added to Summary Compensation Table (“SCT”) total compensation:
First PEO (Kearney) SCT Total to CAP Reconciliation
| Year | | | Salary | | | Bonus and Non-Equity Incentive Compensation | | | Other Compensation | | | SCT Total | | | Deductions from SCT Total | | | Additions to SCT Total | | | CAP | | |||||||||||||||||||||
| | | | | | | | | | (i) | | | | | | | | | | | | | | | (ii) | | | (iii) | | | | | | | | |||||||||
| 2025 | | | | | N/A | | | | | | N/A | | | | | | N/A | | | | | | N/A | | | | | | N/A | | | | | | N/A | | | | | | N/A | | |
| 2024 | | | | | N/A | | | | | | N/A | | | | | | N/A | | | | | | N/A | | | | | | N/A | | | | | | N/A | | | | | | N/A | | |
| 2023 | | | | | N/A | | | | | | N/A | | | | | | N/A | | | | | | N/A | | | | | | N/A | | | | | | N/A | | | | | | N/A | | |
| 2022 | | | | | N/A | | | | | | N/A | | | | | | N/A | | | | | | N/A | | | | | | N/A | | | | | | N/A | | | | | | N/A | | |
| 2021 | | | | | 471,765 | | | | | | | | | | | 3,643,750 | | | | | | 7,234,574 | | | | | | (3,119,059) | | | | | | 4,091,852 | | | | | | 8,207,367 | | | |
Second PEO (Jardon) SCT Total to CAP Reconciliation
| Year | | | Salary | | | Bonus and Non-Equity Incentive Compensation | | | Other Compensation | | | SCT Total | | | Deductions from SCT Total | | | Additions to SCT Total | | | CAP | | |||||||||||||||||||||
| | | | | | | | | | (i) | | | | | | | | | | | | | | | (ii) | | | (iii) | | | ||||||||||||||
| 2025 | | | | | 1,000,000 | | | | | | 1,461,250 | | | | | | 26,000 | | | | | | 7,231,722 | | | | | | (4,744,472) | | | | | | 5,006,685 | | | | | | 7,493,935 | | |
| 2024 | | | | | 1,000,000 | | | | | | 690,625 | | | | | | 25,800 | | | | | | 6,962,497 | | | | | | (5,246,072) | | | | | | 59,359 | | | | | | 1,775,784 | | |
| 2023 | | | | | 1,000,000 | | | | | | 937,500 | | | | | | 25,200 | | | | | | 7,132,091 | | | | | | (5,169,391) | | | | | | (58,280) | | | | | | 1,904,420 | | |
| 2022 | | | | | 1,000,000 | | | | | | 1,117,500 | | | | | | 430,819 | | | | | | 2,548,319 | | | | | | | | | | | (661,655) | | | | | | 1,886,664 | | | |
| 2021 | | | | | 1,149,618 | | | | | | 1,008,900 | | | | | | 12,000 | | | | | | 8,123,233 | | | | | | (5,952,714) | | | | | | 14,028,593 | | | | | | 16,199,112 | | |
Average Non-PEO NEOs SCT Total to CAP Reconciliation
| Year | | | Salary | | | Bonus and Non-Equity Incentive Compensation | | | Other Compensation | | | SCT Total | | | Deductions from SCT Total | | | Additions to SCT Total | | | CAP | | |||||||||||||||||||||
| | | | | | | | | | (i) | | | | | | | | | | | | | | | (ii) | | | (iii) | | | | | | | | |||||||||
| 2025 | | | | | 378,056 | | | | | | 499,038 | | | | | | 212,334 | | | | | | 3,557,991 | | | | | | (2,468,563) | | | | | | 2,026,159 | | | | | | 3,115,588 | | |
| 2024 | | | | | 456,288 | | | | | | 252,099 | | | | | | 129,933 | | | | | | 2,309,945 | | | | | | (1,471,625) | | | | | | 122,393 | | | | | | 960,713 | | |
| 2023 | | | | | 447,099 | | | | | | 335,324 | | | | | | 110,165 | | | | | | 2,322,168 | | | | | | (1,429,580) | | | | | | 266,093 | | | | | | 1,158,681 | | |
| 2022 | | | | | 445,328 | | | | | | 398,123 | | | | | | 72,029 | | | | | | 915,480 | | | | | | | | | | | (16,248) | | | | | | 899,231 | | | |
| 2021 | | | | | 406,922 | | | | | | 242,138 | | | | | | 634,634 | | | | | | 2,713,792 | | | | | | (1,430,265) | | | | | | 2,343,734 | | | | | | 3,627,261 | | |
(i)
Reflects “all other compensation” reported in the SCT for each year shown.
(ii)
Represents the grant date fair value of equity-based awards granted each year. We did not report a change in pension value for any of the years reflected in this table; therefore, a deduction from SCT total related to pension value is not needed.
(iii)
Reflects the value of equity calculated in accordance with the SEC methodology for determining CAP for each year shown. The equity component of CAP for fiscal year 2025 is further detailed in the supplemental table below.
Supplemental
Equity Component of CAP for FY 2025:
| Equity Type | | | Fair Value of Current Year Equity Awards at 12/31/2025 | | | Change in Value of Prior Years’ Awards Unvested at 12/31/2025 | | | Change in Value of Prior Years’ Awards That Vested in FY 2025 | | | Fair Value of Prior Years’ Awards Forfeited in FY 2025 | | | Equity Value Included in CAP | | |||||||||||||||
| Second PEO (Jardon) | | | | | 4,720,056 | | | | | | 212,068 | | | | | | 74,560 | | | | | | | | | | | 5,006,685 | | | |
| Average Non-PEO NEOs | | | | | 1,960,400 | | | | | | 47,557 | | | | | | 18,202 | | | | | | | | | | | 2,026,159 | | | |
(3)
The peer group used for total shareholder return is SPDR S&P Oil & Gas Equipment & Services ETF (XES).
(1)
The PEO and the non-PEO NEOs for each year are as follows:
(i)
2025: Mr. Jardon, Second PEO; Messrs. Fanning, Maiworm, Geddes, McAlister, Russell, NEOs
(ii)
2024, 2023 and 2022: Mr. Jardon, Second PEO; Messrs. Fanning, Geddes, McAlister, Russell, NEOs
(iii)
2021: Mr. Kearney, First PEO; Mr. Jardon, Second PEO; Messrs. Fanning, Geddes, McAlister, Russell and Symington and Ms. Cougle, NEOs
(3)
The peer group used for total shareholder return is SPDR S&P Oil & Gas Equipment & Services ETF (XES).
(2)
To calculate Compensation Actually Paid (“CAP”), the following amounts were deducted from and added to Summary Compensation Table (“SCT”) total compensation:
First PEO (Kearney) SCT Total to CAP Reconciliation
| Year | | | Salary | | | Bonus and Non-Equity Incentive Compensation | | | Other Compensation | | | SCT Total | | | Deductions from SCT Total | | | Additions to SCT Total | | | CAP | | |||||||||||||||||||||
| | | | | | | | | | (i) | | | | | | | | | | | | | | | (ii) | | | (iii) | | | | | | | | |||||||||
| 2025 | | | | | N/A | | | | | | N/A | | | | | | N/A | | | | | | N/A | | | | | | N/A | | | | | | N/A | | | | | | N/A | | |
| 2024 | | | | | N/A | | | | | | N/A | | | | | | N/A | | | | | | N/A | | | | | | N/A | | | | | | N/A | | | | | | N/A | | |
| 2023 | | | | | N/A | | | | | | N/A | | | | | | N/A | | | | | | N/A | | | | | | N/A | | | | | | N/A | | | | | | N/A | | |
| 2022 | | | | | N/A | | | | | | N/A | | | | | | N/A | | | | | | N/A | | | | | | N/A | | | | | | N/A | | | | | | N/A | | |
| 2021 | | | | | 471,765 | | | | | | | | | | | 3,643,750 | | | | | | 7,234,574 | | | | | | (3,119,059) | | | | | | 4,091,852 | | | | | | 8,207,367 | | | |
Second PEO (Jardon) SCT Total to CAP Reconciliation
| Year | | | Salary | | | Bonus and Non-Equity Incentive Compensation | | | Other Compensation | | | SCT Total | | | Deductions from SCT Total | | | Additions to SCT Total | | | CAP | | |||||||||||||||||||||
| | | | | | | | | | (i) | | | | | | | | | | | | | | | (ii) | | | (iii) | | | ||||||||||||||
| 2025 | | | | | 1,000,000 | | | | | | 1,461,250 | | | | | | 26,000 | | | | | | 7,231,722 | | | | | | (4,744,472) | | | | | | 5,006,685 | | | | | | 7,493,935 | | |
| 2024 | | | | | 1,000,000 | | | | | | 690,625 | | | | | | 25,800 | | | | | | 6,962,497 | | | | | | (5,246,072) | | | | | | 59,359 | | | | | | 1,775,784 | | |
| 2023 | | | | | 1,000,000 | | | | | | 937,500 | | | | | | 25,200 | | | | | | 7,132,091 | | | | | | (5,169,391) | | | | | | (58,280) | | | | | | 1,904,420 | | |
| 2022 | | | | | 1,000,000 | | | | | | 1,117,500 | | | | | | 430,819 | | | | | | 2,548,319 | | | | | | | | | | | (661,655) | | | | | | 1,886,664 | | | |
| 2021 | | | | | 1,149,618 | | | | | | 1,008,900 | | | | | | 12,000 | | | | | | 8,123,233 | | | | | | (5,952,714) | | | | | | 14,028,593 | | | | | | 16,199,112 | | |
(i)
Reflects “all other compensation” reported in the SCT for each year shown.
(ii)
Represents the grant date fair value of equity-based awards granted each year. We did not report a change in pension value for any of the years reflected in this table; therefore, a deduction from SCT total related to pension value is not needed.
(iii)
Reflects the value of equity calculated in accordance with the SEC methodology for determining CAP for each year shown. The equity component of CAP for fiscal year 2025 is further detailed in the supplemental table below.
Supplemental
Equity Component of CAP for FY 2025:
| Equity Type | | | Fair Value of Current Year Equity Awards at 12/31/2025 | | | Change in Value of Prior Years’ Awards Unvested at 12/31/2025 | | | Change in Value of Prior Years’ Awards That Vested in FY 2025 | | | Fair Value of Prior Years’ Awards Forfeited in FY 2025 | | | Equity Value Included in CAP | | |||||||||||||||
| Second PEO (Jardon) | | | | | 4,720,056 | | | | | | 212,068 | | | | | | 74,560 | | | | | | | | | | | 5,006,685 | | | |
| Average Non-PEO NEOs | | | | | 1,960,400 | | | | | | 47,557 | | | | | | 18,202 | | | | | | | | | | | 2,026,159 | | | |
(2)
To calculate Compensation Actually Paid (“CAP”), the following amounts were deducted from and added to Summary Compensation Table (“SCT”) total compensation:
Average Non-PEO NEOs SCT Total to CAP Reconciliation
| Year | | | Salary | | | Bonus and Non-Equity Incentive Compensation | | | Other Compensation | | | SCT Total | | | Deductions from SCT Total | | | Additions to SCT Total | | | CAP | | |||||||||||||||||||||
| | | | | | | | | | (i) | | | | | | | | | | | | | | | (ii) | | | (iii) | | | | | | | | |||||||||
| 2025 | | | | | 378,056 | | | | | | 499,038 | | | | | | 212,334 | | | | | | 3,557,991 | | | | | | (2,468,563) | | | | | | 2,026,159 | | | | | | 3,115,588 | | |
| 2024 | | | | | 456,288 | | | | | | 252,099 | | | | | | 129,933 | | | | | | 2,309,945 | | | | | | (1,471,625) | | | | | | 122,393 | | | | | | 960,713 | | |
| 2023 | | | | | 447,099 | | | | | | 335,324 | | | | | | 110,165 | | | | | | 2,322,168 | | | | | | (1,429,580) | | | | | | 266,093 | | | | | | 1,158,681 | | |
| 2022 | | | | | 445,328 | | | | | | 398,123 | | | | | | 72,029 | | | | | | 915,480 | | | | | | | | | | | (16,248) | | | | | | 899,231 | | | |
| 2021 | | | | | 406,922 | | | | | | 242,138 | | | | | | 634,634 | | | | | | 2,713,792 | | | | | | (1,430,265) | | | | | | 2,343,734 | | | | | | 3,627,261 | | |
(i)
Reflects “all other compensation” reported in the SCT for each year shown.
(ii)
Represents the grant date fair value of equity-based awards granted each year. We did not report a change in pension value for any of the years reflected in this table; therefore, a deduction from SCT total related to pension value is not needed.
(iii)
Reflects the value of equity calculated in accordance with the SEC methodology for determining CAP for each year shown. The equity component of CAP for fiscal year 2025 is further detailed in the supplemental table below.
Supplemental
Equity Component of CAP for FY 2025:
| Equity Type | | | Fair Value of Current Year Equity Awards at 12/31/2025 | | | Change in Value of Prior Years’ Awards Unvested at 12/31/2025 | | | Change in Value of Prior Years’ Awards That Vested in FY 2025 | | | Fair Value of Prior Years’ Awards Forfeited in FY 2025 | | | Equity Value Included in CAP | | |||||||||||||||
| Second PEO (Jardon) | | | | | 4,720,056 | | | | | | 212,068 | | | | | | 74,560 | | | | | | | | | | | 5,006,685 | | | |
| Average Non-PEO NEOs | | | | | 1,960,400 | | | | | | 47,557 | | | | | | 18,202 | | | | | | | | | | | 2,026,159 | | | |
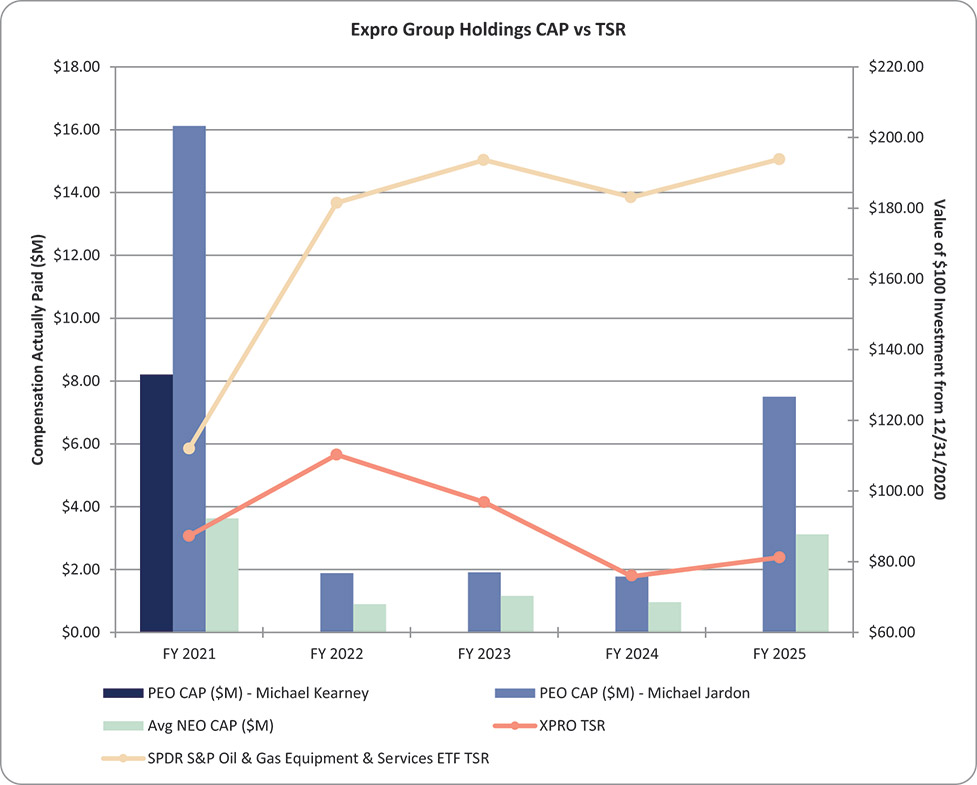
Compensation Actually Paid Versus TSR ($)
| | | | 12/31/21 | | | 12/31/22 | | | 12/31/23 | | | 12/31/24 | | | 12/31/25 | | |||||||||||||||
| Compensation Actually Paid to First PEO | | | | | 8,207,367 | | | | | | | | | | | | | | | | | | | | | | | ||||
| Compensation Actually Paid to Second PEO | | | | | 16,199,112 | | | | | | 1,886,664 | | | | | | 1,904,420 | | | | | | 1,775,784 | | | | | | 7,493,935 | | |
| Average Compensation Actually Paid to Non-PEO NEOs | | | | | 3,627,261 | | | | | | 899,231 | | | | | | 1,158,681 | | | | | | 960,713 | | | | | | 3,115,588 | | |
| TSR | | | | | 87.29 | | | | | | 110.28 | | | | | | 96.84 | | | | | | 75.85 | | | | | | 81.20 | | |
| Peer Group TSR | | | | | 112.04 | | | | | | 181.52 | | | | | | 193.65 | | | | | | 183.09 | | | | | | 193.88 | | |
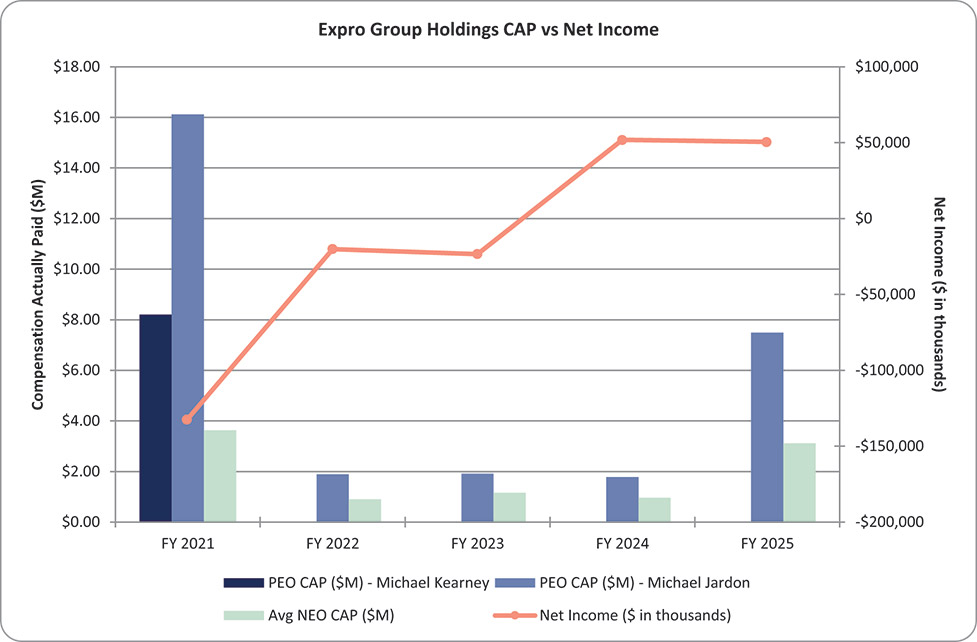
Compensation Actually Paid Versus Net Income (Loss) ($)
| | | | 12/31/21 | | | 12/31/22 | | | 12/31/23 | | | 12/31/24 | | | 12/31/25 | | |||||||||||||||
| Compensation Actually Paid to First PEO | | | | | 8,207,367 | | | | | | | | | | | | | | | | | | | | | | | ||||
| Compensation Actually Paid to Second PEO | | | | | 16,199,112 | | | | | | 1,886,664 | | | | | | 1,904,420 | | | | | | 1,775,784 | | | | | | 7,493,935 | | |
| Average Compensation Actually Paid to Non-PEO NEOs | | | | | 3,627,261 | | | | | | 899,231 | | | | | | 1,158,681 | | | | | | 960,713 | | | | | | 3,115,588 | | |
| Net Income (Loss) | | | | | (131,891) | | | | | | (20,145) | | | | | | (23,360) | | | | | | 51,918 | | | | | | 50,481 | | |
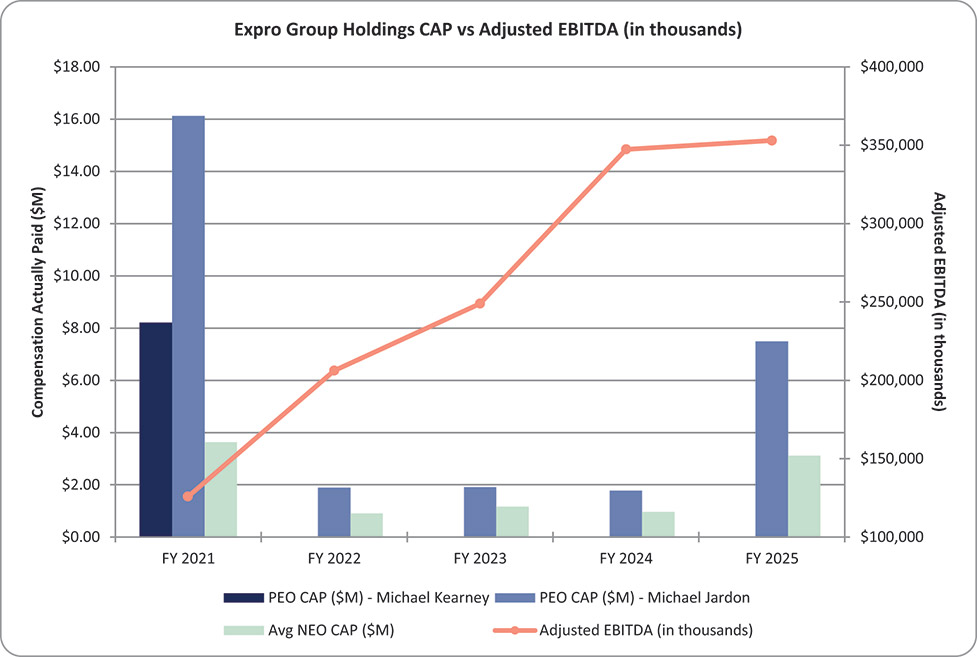
Compensation Actually Paid Versus Adjusted EBITDA ($)
| | | | 12/31/21 | | | 12/31/22 | | | 12/31/23 | | | 12/31/24 | | | 12/31/25 | | |||||||||||||||
| Compensation Actually Paid to First PEO | | | | | 8,207,367 | | | | | | | | | | | | | | | | | | | | | | | ||||
| Compensation Actually Paid to Second PEO | | | | | 16,199,112 | | | | | | 1,886,664 | | | | | | 1,904,420 | | | | | | 1,775,784 | | | | | | 7,493,935 | | |
| Average Compensation Actually Paid to Non-PEO NEOs | | | | | 3,627,261 | | | | | | 899,231 | | | | | | 1,158,681 | | | | | | 960,713 | | | | | | 3,115,588 | | |
| Adjusted EBITDA | | | | | 125,940 | | | | | | 206,233 | | | | | | 248,880 | | | | | | 347,403 | | | | | | 353,024 | | |
Compensation Actually Paid Versus TSR ($)
| | | | 12/31/21 | | | 12/31/22 | | | 12/31/23 | | | 12/31/24 | | | 12/31/25 | | |||||||||||||||
| Compensation Actually Paid to First PEO | | | | | 8,207,367 | | | | | | | | | | | | | | | | | | | | | | | ||||
| Compensation Actually Paid to Second PEO | | | | | 16,199,112 | | | | | | 1,886,664 | | | | | | 1,904,420 | | | | | | 1,775,784 | | | | | | 7,493,935 | | |
| Average Compensation Actually Paid to Non-PEO NEOs | | | | | 3,627,261 | | | | | | 899,231 | | | | | | 1,158,681 | | | | | | 960,713 | | | | | | 3,115,588 | | |
| TSR | | | | | 87.29 | | | | | | 110.28 | | | | | | 96.84 | | | | | | 75.85 | | | | | | 81.20 | | |
| Peer Group TSR | | | | | 112.04 | | | | | | 181.52 | | | | | | 193.65 | | | | | | 183.09 | | | | | | 193.88 | | |
Narrative Disclosure to Pay Versus Performance Table
For the fiscal year ending December 31, 2025, the Company used Total Stockholder Return (TSR) to link PRSU equity grants to performance. In addition, the Company used two financial performance measures to link compensation actually paid to its NEOs to company performance under its annual cash incentive program, Adjusted EBITDA and Free Cash Flow. In addition to these financial performance measures, the Company also used Total Recordable Case Frequency and ESG as non-financial performance measures
under its annual cash incentive program. For a description of the Company’s PRSU grants, see page 25 and for a description of the Company’s annual cash incentive program, see page 23.
•
Important Performance Measures for 2025
•
TSR
•
Adjusted EBITDA
•
Free Cash Flow
•
Total Recordable Case Frequency
•
ESG