N-4
May 01, 2026
USD ($)
yr
Year
CONTRACTS
Dec. 31, 2025
Dec. 31, 2024
Dec. 31, 2023
Dec. 31, 2022
Dec. 31, 2021
Dec. 31, 2020
Dec. 31, 2019
Dec. 31, 2018
Dec. 31, 2017
Dec. 31, 2016
FEES, EXPENSES, AND ADJUSTMENTS |
||||||||||||||||||||||||||||
Are There Charges or Adjustments for Early Withdrawals? |
Yes. There is a Segment Interim Value adjustment for amounts removed from a Segment of the SIO before Segment maturity and because the end-of-term downside protection provided by a Segment Buffer does not apply to the Segment Interim Value, it is theoretically possible that you could lose up to 100% of your investment and previously credited interest in certain extreme scenarios. For example, if you allocate $100,000 to a Segment with a 3-year Segment Duration and later withdraw the entire amount before the 3 years have elapsed, you could lose up to $100,000 of your investment. This loss may be greater if you also have to pay a withdrawal charge, and/or if you have to pay taxes or tax penalties. We use the Segment Interim Values for your Segments of the SIO if you have an Interim Value Transaction. If amounts are removed from a fixed maturity option before the maturity date, there will be a market value adjustment which could greatly reduce the value in your fixed maturity option theoretically by up to 100% in extreme situations. For example, if you allocate $100,000 to a fixed maturity option and later withdraw the entire amount before the maturity date, you could lose up to $100,000 of your investment. This loss may be greater if you also have to pay a withdrawal charge, taxes and tax penalties. A market value adjustment will apply to withdrawals, transfers, surrender of your contract, or when we make deductions for charges from a fixed maturity option before the maturity date . For additional information about the charges for surrenders and early withdrawals see “Withdrawal charge” in “Charges under the contracts” under “Charges, expenses, and adjustments” in this prospectus. |
|||||||||||||||||||||||||||
Are There Transaction Charges? |
Yes. For additional information about transaction charges see “Charges under the contracts” in “Charges, expenses, and adjustments” in this prospectus. |
|||||||||||||||||||||||||||
Are There Ongoing Fees and Expenses? |
Yes. each year each year There is an implicit ongoing fee associated with Segments because the amount you can earn on a Segment is limited by us by the Segment’s Performance Cap Rate. The Performance Cap Rate may cause your returns under the Segment to be lower than the Index’s returns. In return for accepting this limit on Index gains, you receive some protection from Index losses through the Segment Buffer. The implicit ongoing fee from the Performance Cap Rate is not reflected in the tables below. |
|||||||||||||||||||||||||||
Annual Fee |
Minimum |
Maximum |
||||||||||||||||||||||||||
Base Contracts (1) |
0.50% |
2.00% |
||||||||||||||||||||||||||
Portfolio Company fees and expenses (2) |
0.54% |
3.04% |
||||||||||||||||||||||||||
(1) Expressed as an annual percent of daily net assets in the variable investment options. (2) Expressed as an annual percentage of daily net assets in the Portfolio. This range is for the year ended December 31, 2025 and could change from year to year. |
||||||||||||||||||||||||||||
Because your contract is customizable, the choices you make affect how much you will pay. To help you understand the cost of owning your contract, the following table shows the lowest and highest cost you could pay each year which could add withdrawal charges, interim value adjustments and market value adjustments that substantially increase costs. |
||||||||||||||||||
Lowest Annual Cost $1,737 |
Highest Annual Cost $4,038 |
|||||||||||||||||
Assumes: • Investment of $100,000 • 5% annual appreciation • Least expensive combination of contract and Portfolio fees and expenses • No optional benefits • No sales charges • No additional contributions, transfers, loans or withdrawals • No contract adjustments |
Assumes: • Investment of $100,000 • 5% annual appreciation • Most expensive combination of contract (Series 400), optional benefits and Portfolio fees and expenses • No sales charges • No additional contributions, transfers, loans or withdrawals • No contract adjustments |
|||||||||||||||||
For additional information about ongoing fees and expenses see “Fee table” in this prospectus. | ||||||||||||||||||
Yes.
There is a Segment Interim Value adjustment for amounts removed from a Segment of the SIO before Segment maturity and because the end-of-term downside protection provided by a Segment Buffer does not apply to the Segment Interim Value, it is theoretically possible that you could lose up to 100% of your investment and previously credited interest in certain extreme scenarios. For example, if you allocate $100,000 to a Segment with a 3-year Segment Duration and later withdraw the entire amount before the 3 years have elapsed, you could lose up to $100,000 of your investment. This loss may be greater if you also have to pay a withdrawal charge, and/or if you have to pay taxes or tax penalties. We use the Segment Interim Values for your Segments of the SIO if you have an Interim Value Transaction.
If amounts are removed from a fixed maturity option before the maturity date, there will be a market value adjustment which could greatly reduce the value in your fixed maturity option theoretically by up to 100% in extreme situations. For example, if you allocate $100,000 to a fixed maturity option and later withdraw the entire amount before the maturity date, you could lose up to $100,000 of your investment. This loss may be greater if you also have to pay a withdrawal charge, taxes and tax penalties. A market value adjustment will apply to withdrawals, transfers, surrender of your contract, or when we make deductions for charges from a fixed maturity option before the maturity date
.
For additional information about the charges for surrenders and early withdrawals see “Withdrawal charge” in “Charges under the contracts” under “Charges, expenses, and adjustments” in this prospectus.
Yes.
For additional information about transaction charges see “Charges under the contracts” in “Charges, expenses, and adjustments” in this prospectus.
Are There Ongoing Fees and Expenses? |
Yes. each year each year There is an implicit ongoing fee associated with Segments because the amount you can earn on a Segment is limited by us by the Segment’s Performance Cap Rate. The Performance Cap Rate may cause your returns under the Segment to be lower than the Index’s returns. In return for accepting this limit on Index gains, you receive some protection from Index losses through the Segment Buffer. The implicit ongoing fee from the Performance Cap Rate is not reflected in the tables below. |
|||||||||||||||||||||||||||
Annual Fee |
Minimum |
Maximum |
||||||||||||||||||||||||||
Base Contracts (1) |
0.50% |
2.00% |
||||||||||||||||||||||||||
Portfolio Company fees and expenses (2) |
0.54% |
3.04% |
||||||||||||||||||||||||||
(1) Expressed as an annual percent of daily net assets in the variable investment options. (2) Expressed as an annual percentage of daily net assets in the Portfolio. This range is for the year ended December 31, 2025 and could change from year to year. |
||||||||||||||||||||||||||||
Because your contract is customizable, the choices you make affect how much you will pay. To help you understand the cost of owning your contract, the following table shows the lowest and highest cost you could pay each year which could add withdrawal charges, interim value adjustments and market value adjustments that substantially increase costs. |
||||||||||||||||||
Lowest Annual Cost $1,737 |
Highest Annual Cost $4,038 |
|||||||||||||||||
Assumes: • Investment of $100,000 • 5% annual appreciation • Least expensive combination of contract and Portfolio fees and expenses • No optional benefits • No sales charges • No additional contributions, transfers, loans or withdrawals • No contract adjustments |
Assumes: • Investment of $100,000 • 5% annual appreciation • Most expensive combination of contract (Series 400), optional benefits and Portfolio fees and expenses • No sales charges • No additional contributions, transfers, loans or withdrawals • No contract adjustments |
|||||||||||||||||
For additional information about ongoing fees and expenses see “Fee table” in this prospectus. | ||||||||||||||||||
Assumes:
•
Investment of $100,000
•
5% annual appreciation
•
Least expensive combination of contract and Portfolio fees and expenses
•
No optional benefits
•
No sales charges
•
No additional contributions, transfers, loans or withdrawals
•
No contract adjustments
Assumes:
•
Investment of $100,000
•
5% annual appreciation
•
Most expensive combination of contract (Series 400), optional benefits and Portfolio fees and expenses
•
No sales charges
•
No additional contributions, transfers, loans or withdrawals
•
No contract adjustments
RISKS | ||||||||||||||
Is There a Risk of Loss from Poor Performance? |
Yes. The return on the Segments of the SIO may be negative and there is a risk of substantial loss of your principal and previously credited interest due to negative index performance because you agree to absorb all losses to the extent they exceed the Segment Buffer. You could lose as much as 80% (for Segments with a -20% Segment Buffer) to 90% (for Segments with a -10% Segment Buffer) of your principal and previously credited interest due to negative index performance at Segment maturity, depending on the Segment Buffer applicable to the Segment in which you invest. We may change the Indices and/or Segment Options in the future but we will always offer a Segment Option with a Segment Buffer that protects the first 10% of loss. In the future, we may offer other Segment Options that do not provide any downside protection which would mean there is a risk of loss of the entire amount invested. For additional information about the risk of loss see “Principal risks of investing in the contract” in this prospectus. |
|||||||||||||
Is this a Short-Term Investment? |
No. ® For additional information about the investment profile of the contract see “Fee table” in this prospectus. |
|||||||||||||
What Are the Risks Associated with the Investment Options? |
An investment in the contract is subject to the risk of poor investment performance and can vary depending on the performance of the investment options available under the contract, (e.g., the Portfolios) or Segment of the SIO. Each investment option, including the guaranteed interest option and fixed maturity options, has its own unique risks. You should review the investment options before making an investment decision. For investments in a Segment of the SIO, the Performance Cap Rate will limit positive Index performance (e.g., limited upside). For example, if the Index Performance Rate is 10% and the Performance Cap Rate is 7%, we will credit 7% on the Segment Maturity Date assuming there are no fees or charges assessed. This may result in you earning less than the Index Return. The Segment Buffer will limit negative returns (e.g., limited protection in the case of market decline). The Segment Buffer is the maximum amount of negative interest we will assume and we will credit any negative interest in excess of the Segment Buffer which means you bear all loss that exceeds the Segment Buffer. For example, if the Index Performance Rate is -25% and the Segment Buffer is -10%, we will credit -15% on the Segment Maturity Date assuming there are no fees or charges assessed. Each Index is a “price return index,” not a “total return index,” and therefore does not reflect dividends paid on the securities composing the Index. This will reduce the Index return and will cause the Index to underperform a direct investment in the securities composing the Index. For additional information about the risks associated with investment options see “Fixed investment options”, “Guaranteed interest option” and “Portfolios of the Trusts” in “Purchasing the contract” in the prospectus, as well as, “Risks associated with the variable investment options”, “Risks associated with the Structured Investment Option,” and “Risks associated with the fixed maturity options” in “Principal Risks of investing in the contract.” See also Appendix: “Investment options available under the contract” in this prospectus. |
|||||||||||||
What Are the Risks Related to the Insurance Company? |
An investment in the contract is subject to the risks related to the Company. The Company is solely responsible to the contract owner for the contract’s account value and the optional benefits. The general obligations, including the guaranteed interest option, fixed maturity options, SIO, and any optional benefits under the contract are supported by our general account and are subject to our claims paying ability. An owner should look solely to our financial strength for our claims-paying ability. More information about the Company, including our financial strength ratings, may be obtained at www.equitable.com/about-us/financial-strength-ratings. For additional information about insurance company risks see “About the general account” in “More information” in this prospectus. |
|||||||||||||
®
Yes.
There are limits on contributions and transfers into and out of the guaranteed interest option, and restrictions or limitations with the DCA programs. See “Allocating your contributions” in “Purchasing the contract” and “Transferring your account value” in “Transferring your money among investment options” in this prospectus for more information.
For more information see “About the Separate Account” in “More information” in this prospectus.
We determine the Performance Cap Rate for each SIO Segment on the Segment Start Date. You will not know the rate in advance. Prior to the Segment Start Date, you may elect a Performance Cap Threshold. The threshold represents the minimum Performance Cap Rate you find acceptable for a particular Segment. If we declare a cap that is lower than the threshold you specify, you will not be invested in that Segment and your account value will remain in that Segment Holding Account until the next available Segment for which your threshold is met or you provide us with alternative instructions.
You cannot transfer out of an SIO Segment prior to its maturity to another investment option. You can only make withdrawals out of a Segment or surrender your EQUI-VEST
®
contract. The amount you would receive would be calculated using the formula for the Segment Interim Value.We may not offer new SIO Segments. Therefore, a Segment may not be available for you to transfer your Segment Maturity Value into after the Segment Maturity Date. We have the right to substitute an alternative index prior to Segment Maturity if the publication of the Index is discontinued or at our sole discretion we determine that our use of the Index should be discontinued or if the calculation of the Index is substantially changed. If we substitute an index for an existing Segment, we would not change the Segment Buffer or Performance Cap Rate. We would attempt to choose a substitute index that has a similar investment objective and risk profile to the replaced index.
We will not accept allocations to a fixed maturity option if on the date the contribution or transfer is to be applied the rate to maturity is 3%. This means that at points in time there may be no fixed maturity options available. You can allocate your contributions to one or more of these fixed maturity options. However, you may not allocate more than one contribution to any one fixed maturity option.
Contributions and transfers into and out of the guaranteed interest option are limited.
If you elect to pay the advisory fee from your account value, then these deductions will, among other things, reduce the account value and may be subject to federal and state income taxes and a 10% federal penalty tax.
For additional information about restrictions on investment options, see “Portfolios of the Trusts”, “Structured Investment Options”, “Guaranteed Interest Option” and “Fixed maturity options” in “Purchasing the contract” and “Transferring your money among investment options” in this prospectus.
Yes.
The standard and optional death benefits offered with the contract are available only at contract purchase. Withdrawals could significantly reduce or terminate the death benefit.
Not all employer plans will offer loans. Loans are subject to restrictions under federal tax rules and ERISA. Automated transfer programs, including dollar cost averaging and asset rebalancing, are not available if you elect Semester Strategies for Series 100 and Series 200 TSA and EDC contracts only.
For additional information about the optional benefits see “How you can purchase and contribute to your contract” in “Purchasing the Contract” and “Benefits available under the contract” in this prospectus.
You should consult with a tax professional to determine the tax implications of an investment in, and payments received under, the contract. There is no additional tax benefit to you if the contract is purchased through a tax-qualified plan or individual retirement account (IRA). Withdrawals will be subject to ordinary income tax and may be subject to tax penalties. Generally, you are not taxed until you make a withdrawal from the contract.
For more information, see “Tax information” in this prospectus.
Some financial professionals may receive compensation for selling the contract to you, both in the form of commissions or in the form of contribution-based compensation. Financial professionals may also receive additional compensation for enhanced marketing opportunities and other services (commonly referred to as “marketing allowances”). This conflict of interest may influence the financial professional to recommend this contract over another investment.
For additional information about compensation to financial professionals see “Distribution of the contracts” in “More information” in this prospectus.
Some financial professionals may have a financial incentive to offer a new contract in place of the one you already own. You should only exchange your contract if you determine, after comparing the features, fees, and risks of both contracts, as well as any fees or penalties to terminate your existing contract, that it is preferable to purchase the new contract rather than continue to own your existing contract.
For additional information about exchanges see “Charge for third-party transfer or exchange” in ”Charges, expenses, and adjustments” in this prospectus.
Fee table
The following tables describe the fees, expenses, and adjustments that you will pay when buying, owning, and surrendering, or making withdrawals from an investment option or from the contract. Please refer to your contract specifications page for information about the specific fees you will pay
each year
based on the investment options you have elected.
The first table describes fees and expenses that you will pay at the time that you buy the contract, surrender the contract, make certain withdrawals from an investment option or from the contract, or transfer account value between investment options.
Charges designed to approximate certain taxes that may be imposed on us, such as premium taxes in your state, may also apply.
Transaction Expenses | ||
| Sales Load Imposed on Purchases (as a percentage of purchase payments) | None | |
| Withdrawal Charge (as a percentage of contributions withdrawn) (1) |
6.00% | |
| Net Loan Interest Charge (2) (Applicable to TSA, governmental employer EDC and Corporate Trusted contracts only) |
2.00% | |
| Transfer Fee | None | |
| Third Party Transfer or Exchange Fee (3) |
$65 | |
| Special Service Charges (4) |
$90 | |
| (1) | The charge percentage is deducted upon a withdrawal of amounts in excess of the 10% free withdrawal amount. Important exceptions and limitations may eliminate or reduce this charge. For a complete description of withdrawal charges, please see “Withdrawal Charge” in “Charges, expenses, and adjustments” in this prospectus. For certain contracts issued in New York, a different maximum withdrawal charge may apply. See Appendix: “State contract availability and/or variations of certain features and benefits” in the prospectus for more information. |
| (2) | In no event will the net loan interest charge exceed 2.00%. We charge interest on loans under your contract but also credit you interest on your loan reserve account. Our net loan interest charge is determined by the excess between the interest rate we charge over the interest rate we credit. See “Loans under TSA, governmental employer EDC and Corporate Trusteed contracts” under “Accessing your money” in the prospectus for more information on how the loan interest is calculated and for restrictions that may apply. |
| (3) | This charge will never exceed 2% of the amount disbursed or transferred. |
| (4) | Unless you specify otherwise, this charge will be deducted from the amount you request. Special service charges include (1) express mail charge; and (2) wire transfer charge. The current maximum charge for each service is $90. We may discontinue these services at any time. |
The next table describes the adjustments, in addition to any transaction expenses, that apply if all or a portion of the account value is removed from an investment option or from the contract before the expiration of a specified period.
Adjustments |
||||
SIO Segment Maximum Potential Loss Due to Segment Interim Value adjustment (as a percentage of Account value invested in the Segment on the Segment Start Date) (1) |
100% (2) | |||
Fixed Maturity Option Maximum Potential Loss Due to Market Value Adjustment (as a percentage of Account value withdrawn from the Fixed Maturity Option) (3) |
100% | |||
(1) |
We use the Segment Interim Values for your Segments of the SIO if you have an Interim Value Transaction. The actual amount of the Segment Interim Value calculation is determined by a formula that depends on, among other things, the Segment Buffer and how the Index has performed since the Segment Start Date. The maximum loss would occur if there is a total distribution for a Segment at a time when the Index price has declined to zero. If you surrender or cancel your variable annuity contract, die, transfer or make a withdrawal from a Segment before the Segment Maturity Date, the Segment Buffer will not necessarily apply to the extent it would on the Segment Maturity Date, and any upside performance will be limited to a percentage lower than the Performance Cap Rate. See “Structured Investment Option” under “Purchasing the contract” for more information. |
| (2) | Because the end-of-term downside protection provided by a Segment Buffer does not apply to the Segment Interim Value, it is theoretically possible that you could lose up to 100% of your investment and previously credited interest in certain extreme scenarios. |
| (3) | A market value adjustment will apply to withdrawals, transfers, surrender of your contract, or when we make deductions for charges from a fixed maturity option before the maturity date. The actual amount of the Market Value Adjustment is determined by a formula that depends on, among other things, the difference between the rate to maturity that applies to the amount being withdrawn and the rate to maturity in effect at that time for new allocations to that same fixed maturity option, and the length of time remaining until the maturity date. It is theoretically possible that you could lose up to 100% of your investment and previously credited interest in certain extreme scenarios. In general, the maximum loss would occur if there is a total distribution for a fixed maturity option a significant time prior to the maturity date and interest rates have risen dramatically from the time that you originally allocate an amount to the fixed maturity option to the time that you take the withdrawal. See “Fixed maturity options” under “Purchasing the contract” for more information. |
The next table describes the fees and expenses that you will pay
each year
during the time that you own the contract (not including Portfolio fees and expenses).
Annual Contract Expenses |
||
| Annual Administrative Charge (1) |
$65 | |
| Base Contract Expenses (2) (as a percentage of daily net assets in the variable investment options): |
2.00% |
| (1) | The annual administrative charge is deducted from your account value on each contract date anniversary. The current charge is $30. If the contract is surrendered or annuitized or a death benefit is paid on any date other than the contract date anniversary, we will deduct a pro rata portion of the administrative charge for that year. For series 300 and 400 contracts, during the first two contract years this charge, if it applies, is equal to the lesser of $30 or 2% of your account value, plus any amounts previously withdrawn during the contract year. Thereafter, the charge is $30 for each contract year. For series 100 and 200 contracts, the charge is equal to the lesser of $30 or 2% of your account value, plus any prior withdrawals during the contract year. We may discontinue these services at any time. |
| (2) | The current Base Contract Expenses for Series 100 and 200 are: 1.40% for EQ/Common Stock and EQ/Money Market Options and 1.34% for all other investment options. For Series 300 the current charge is 1.34%. For Series 400 the current charge is 1.34%. |
In addition to the fees described above, we limit the amount you can earn on a Segment of the SIO. This means your returns may be lower than the Index’s returns. In return for accepting this limit on Index gains, you will receive some protection from Index losses.
The next item shows the minimum and maximum total operating expenses charged by the underlying Portfolios that you may pay periodically during the time that you own the contract. Expenses shown may change over time and may be higher or lower in the future. A complete list of Portfolios available under the contract, including their annual expenses, may be found at the back of this document. See “Appendix: Investment options available under the contract.”
Annual Portfolio Expenses |
Minimum |
Maximum | ||
Annual Portfolio Expenses prior to Expense Limitation Arrangement (expenses that are deducted from Portfolio assets including management fees, 12b-1 fees, service fees, and other expenses)* |
0.54% |
3.04% | ||
* |
“Annual Portfolio Expenses” may be based, in part, on estimated amounts of such expenses. The expenses listed are for the year ended December 31, 2025. |
16
Examples
These Examples are intended to help you compare the cost of investing in the variable investment options with the cost of investing in other annuity contracts that offer variable investment options. The costs include transaction expenses, annual contract expenses, and annual Portfolio expenses.
These Examples assume all account value is allocated to the variable investment options. The examples do not reflect interim value adjustments or market value adjustments. Your costs could differ from those shown below if you invest in Segments of the SIO or the fixed maturity options.
These Examples assume that you invest $100,000 in the variable investment options for the time periods indicated. The Examples also assume that your investment has a 5% return
each year
and assumes the most expensive combination of annual Portfolio expenses.
Although your actual costs may be higher or lower, based on these assumptions, your costs would be:
EQUI-VEST
®
series 100 and 200 contracts — For TSA, University TSA, SEP, SARSEP, EDC and Annuitant-Owned
HR-10
contracts: If you surrender your contract or annuitize (under a non-life option) at the end of the applicable time period |
If you do not surrender your contract | |||||||||||||
1 year |
3 years |
5 years |
10 years |
1 year |
3 years |
5 years |
10 years | |||||||
$10,170 |
$19,744 |
$29,365 |
$50,856 |
$4,757 |
$14,304 |
$23,899 |
$48,090 | |||||||
EQUI-VEST series 200 Trusteed contracts
If you surrender your contract or annuitize (under a non-life option) at the end of the applicabletime period |
If you do not surrender your contract | |||||||||||||
1 year |
3 years |
5 years |
10 years |
1 year |
3 years |
5 years |
10 years | |||||||
$10,170 |
$19,744 |
$29,365 |
$48,090 |
$4,757 |
$14,304 |
$23,899 |
$48,090 | |||||||
EQUI-VEST
®
series 300 contracts
If you surrender your contract or annuitize (under a non-life option) at the end of the applicabletime period |
If you do not surrender your contract | |||||||||||||
1 year |
3 years |
5 years |
10 years |
1 year |
3 years |
5 years |
10 years | |||||||
$10,031 |
$19,346 |
$28,734 |
$46,913 |
$4,610 |
$13,883 |
$23,228 |
$46,913 | |||||||
EQUI-VEST
®
series 400 contracts
If you surrender your contract or annuitize (under a non-life option) at the end of the applicabletime period |
If you do not surrender your contract | |||||||||||||
1 year |
3 years |
5 years |
10 years |
1 year |
3 years |
5 years |
10 years | |||||||
$10,676 |
$21,183 |
$31,628 |
$52,230 |
$5,292 |
$15,830 |
$26,306 |
$52,230 | |||||||
Transaction Expenses | ||
| Sales Load Imposed on Purchases (as a percentage of purchase payments) | None | |
| Withdrawal Charge (as a percentage of contributions withdrawn) (1) |
6.00% | |
| Net Loan Interest Charge (2) (Applicable to TSA, governmental employer EDC and Corporate Trusted contracts only) |
2.00% | |
| Transfer Fee | None | |
| Third Party Transfer or Exchange Fee (3) |
$65 | |
| Special Service Charges (4) |
$90 | |
| (1) | The charge percentage is deducted upon a withdrawal of amounts in excess of the 10% free withdrawal amount. Important exceptions and limitations may eliminate or reduce this charge. For a complete description of withdrawal charges, please see “Withdrawal Charge” in “Charges, expenses, and adjustments” in this prospectus. For certain contracts issued in New York, a different maximum withdrawal charge may apply. See Appendix: “State contract availability and/or variations of certain features and benefits” in the prospectus for more information. |
| (2) | In no event will the net loan interest charge exceed 2.00%. We charge interest on loans under your contract but also credit you interest on your loan reserve account. Our net loan interest charge is determined by the excess between the interest rate we charge over the interest rate we credit. See “Loans under TSA, governmental employer EDC and Corporate Trusteed contracts” under “Accessing your money” in the prospectus for more information on how the loan interest is calculated and for restrictions that may apply. |
| (3) | This charge will never exceed 2% of the amount disbursed or transferred. |
| (4) | Unless you specify otherwise, this charge will be deducted from the amount you request. Special service charges include (1) express mail charge; and (2) wire transfer charge. The current maximum charge for each service is $90. We may discontinue these services at any time. |
Adjustments |
||||
SIO Segment Maximum Potential Loss Due to Segment Interim Value adjustment (as a percentage of Account value invested in the Segment on the Segment Start Date) (1) |
100% (2) | |||
Fixed Maturity Option Maximum Potential Loss Due to Market Value Adjustment (as a percentage of Account value withdrawn from the Fixed Maturity Option) (3) |
100% | |||
(1) |
We use the Segment Interim Values for your Segments of the SIO if you have an Interim Value Transaction. The actual amount of the Segment Interim Value calculation is determined by a formula that depends on, among other things, the Segment Buffer and how the Index has performed since the Segment Start Date. The maximum loss would occur if there is a total distribution for a Segment at a time when the Index price has declined to zero. If you surrender or cancel your variable annuity contract, die, transfer or make a withdrawal from a Segment before the Segment Maturity Date, the Segment Buffer will not necessarily apply to the extent it would on the Segment Maturity Date, and any upside performance will be limited to a percentage lower than the Performance Cap Rate. See “Structured Investment Option” under “Purchasing the contract” for more information. |
| (2) | Because the end-of-term downside protection provided by a Segment Buffer does not apply to the Segment Interim Value, it is theoretically possible that you could lose up to 100% of your investment and previously credited interest in certain extreme scenarios. |
| (3) | A market value adjustment will apply to withdrawals, transfers, surrender of your contract, or when we make deductions for charges from a fixed maturity option before the maturity date. The actual amount of the Market Value Adjustment is determined by a formula that depends on, among other things, the difference between the rate to maturity that applies to the amount being withdrawn and the rate to maturity in effect at that time for new allocations to that same fixed maturity option, and the length of time remaining until the maturity date. It is theoretically possible that you could lose up to 100% of your investment and previously credited interest in certain extreme scenarios. In general, the maximum loss would occur if there is a total distribution for a fixed maturity option a significant time prior to the maturity date and interest rates have risen dramatically from the time that you originally allocate an amount to the fixed maturity option to the time that you take the withdrawal. See “Fixed maturity options” under “Purchasing the contract” for more information. |
The next table describes the fees and expenses that you will pay
each year
during the time that you own the contract (not including Portfolio fees and expenses).
Annual Contract Expenses |
||
| Annual Administrative Charge (1) |
$65 | |
| Base Contract Expenses (2) (as a percentage of daily net assets in the variable investment options): |
2.00% |
| (1) | The annual administrative charge is deducted from your account value on each contract date anniversary. The current charge is $30. If the contract is surrendered or annuitized or a death benefit is paid on any date other than the contract date anniversary, we will deduct a pro rata portion of the administrative charge for that year. For series 300 and 400 contracts, during the first two contract years this charge, if it applies, is equal to the lesser of $30 or 2% of your account value, plus any amounts previously withdrawn during the contract year. Thereafter, the charge is $30 for each contract year. For series 100 and 200 contracts, the charge is equal to the lesser of $30 or 2% of your account value, plus any prior withdrawals during the contract year. We may discontinue these services at any time. |
| (2) | The current Base Contract Expenses for Series 100 and 200 are: 1.40% for EQ/Common Stock and EQ/Money Market Options and 1.34% for all other investment options. For Series 300 the current charge is 1.34%. For Series 400 the current charge is 1.34%. |
The next item shows the minimum and maximum total operating expenses charged by the underlying Portfolios that you may pay periodically during the time that you own the contract. Expenses shown may change over time and may be higher or lower in the future. A complete list of Portfolios available under the contract, including their annual expenses, may be found at the back of this document. See “Appendix: Investment options available under the contract.”
Annual Portfolio Expenses |
Minimum |
Maximum | ||
Annual Portfolio Expenses prior to Expense Limitation Arrangement (expenses that are deducted from Portfolio assets including management fees, 12b-1 fees, service fees, and other expenses)* |
0.54% |
3.04% | ||
* |
“Annual Portfolio Expenses” may be based, in part, on estimated amounts of such expenses. The expenses listed are for the year ended December 31, 2025. |
Examples
These Examples are intended to help you compare the cost of investing in the variable investment options with the cost of investing in other annuity contracts that offer variable investment options. The costs include transaction expenses, annual contract expenses, and annual Portfolio expenses.
These Examples assume all account value is allocated to the variable investment options. The examples do not reflect interim value adjustments or market value adjustments. Your costs could differ from those shown below if you invest in Segments of the SIO or the fixed maturity options.
These Examples assume that you invest $100,000 in the variable investment options for the time periods indicated. The Examples also assume that your investment has a 5% return
each year
and assumes the most expensive combination of annual Portfolio expenses.
Although your actual costs may be higher or lower, based on these assumptions, your costs would be:
EQUI-VEST
®
series 100 and 200 contracts — For TSA, University TSA, SEP, SARSEP, EDC and Annuitant-Owned
HR-10
contracts: If you surrender your contract or annuitize (under a non-life option) at the end of the applicable time period |
If you do not surrender your contract | |||||||||||||
1 year |
3 years |
5 years |
10 years |
1 year |
3 years |
5 years |
10 years | |||||||
$10,170 |
$19,744 |
$29,365 |
$50,856 |
$4,757 |
$14,304 |
$23,899 |
$48,090 | |||||||
EQUI-VEST series 200 Trusteed contracts
If you surrender your contract or annuitize (under a non-life option) at the end of the applicabletime period |
If you do not surrender your contract | |||||||||||||
1 year |
3 years |
5 years |
10 years |
1 year |
3 years |
5 years |
10 years | |||||||
$10,170 |
$19,744 |
$29,365 |
$48,090 |
$4,757 |
$14,304 |
$23,899 |
$48,090 | |||||||
EQUI-VEST
®
series 300 contracts
If you surrender your contract or annuitize (under a non-life option) at the end of the applicabletime period |
If you do not surrender your contract | |||||||||||||
1 year |
3 years |
5 years |
10 years |
1 year |
3 years |
5 years |
10 years | |||||||
$10,031 |
$19,346 |
$28,734 |
$46,913 |
$4,610 |
$13,883 |
$23,228 |
$46,913 | |||||||
EQUI-VEST
®
series 400 contracts
If you surrender your contract or annuitize (under a non-life option) at the end of the applicabletime period |
If you do not surrender your contract | |||||||||||||
1 year |
3 years |
5 years |
10 years |
1 year |
3 years |
5 years |
10 years | |||||||
$10,676 |
$21,183 |
$31,628 |
$52,230 |
$5,292 |
$15,830 |
$26,306 |
$52,230 | |||||||
3.
Principal risks of investing in the contract This section discusses certain risks associated with purchasing a contract. The level of risk you bear and your potential investment performance will differ depending on the investments you choose.
Risks associated with variable investment options
You take all the investment risk for amounts allocated to one or more of the subaccounts, which invest in Portfolios. If the subaccounts you select increase in value, then your account value goes up; if they decrease in value, your account value goes down. How much your account value goes up or down depends on the performance of the Portfolios in which your subaccounts invest. We do not guarantee the investment results of any Portfolio. An investment in the contract is subject to the risk of poor investment performance, and the value of your investment can vary depending on the performance of the selected Portfolio(s), each of which has its own unique risks. You should review the Portfolios before making an investment decision.
Risks associated with the Structured Investment Option (SIO)
An investor is not invested in the Index or in the securities tracked by the Index. There are unique risks regarding the SIO.
Limiting Negative Returns (Segment Risk of Loss)
• |
There is a risk of a substantial loss of your principal and previously credited interest despite limits on negative index returns because you agree to absorb all losses from the portion of any negative Index Performance Rate that exceeds the Segment Buffer for any Segment at maturity. Currently, the only levels of protection are the -10% or the -20% Segment Buffers at maturity. You could lose as much as 80% (for Segments with a -20% Segment Buffer) to 90% (for Segments with a -10% Segment Buffer) of your principal and previously credited interest due to negative index performance on the Segment Maturity Date. We may change the indices and/or Segment Options in the future, but we will always offer a Segment Option with a Segment Buffer that protects the first 10% of loss. In the future, we may offer other Segment Options that do not provide any downside protection which would mean there is a risk of loss of the entire amount invested. |
Limiting Positive Returns (Performance Cap Rates)
| • | Your Segment Rate of Return for a Segment is limited by its Performance Cap Rate, if applicable, which could cause your Segment Rate of Return to be lower than it would otherwise be if you invested in a mutual fund or exchange-traded fund designed to track the performance of the Index. |
• |
We declare a Performance Cap Rate for each Segment, which is the highest Segment Rate of Return that can be credited on the Segment Maturity Date for that Segment. The Performance Cap, if applicable, Rate may limit your participation in any increases in the underlying Index associated with a Segment. Our minimum Performance Cap Rates for 1, 3, and 5-year Segments are 4%, 12%, and 20%, respectively. See Appendix: “State contract availability and/or variations of certain features and benefits” for more information on state variations. We will not open a Segment with a Performance Cap Rate below the applicable minimum Performance Cap Rate. In some cases, we may decide not to declare a Performance Cap Rate for a Segment, in which case there is no maximum Segment Rate of Return for that Segment. |
• |
The Performance Cap Rate is determined on the Segment Start Date. You will not know the rate in advance. Prior to the Segment Start Date, you may elect a Performance Cap Threshold. The threshold represents the minimum Performance Cap Rate you find acceptable for a particular Segment. If we declare a cap that is lower than the threshold you specify, you will not be invested in that Segment and your account value will remain in that Segment Holding Account until the next available Segment for which your threshold is met or you provide us with alternative instructions. You risk having amounts remain in Segment Holding Accounts for lengthy periods of time rather than being invested in Segments. If you do not specify a threshold, you risk the possibility that the Performance Cap Rate established will have a lower cap than you would find acceptable. We will not open a Segment if the Performance Cap Rate for 1, 3, and 5-year Segments would be less than 4%, 12%, and 20%, respectively. See Appendix: “State contract availability and/or variations of certain features and benefits” for more information on state variations. The Performance Cap Rate is a rate of return from the Segment Start Date to the Segment Maturity Date. |
Risks Related to Withdrawals (Segment Interim Value)
| • | There is a risk of loss of principal and previously credited interest in the case of a withdrawal (including an automatic or systematic withdrawal or a required minimum distribution), annuitization, death, surrender, contract cancellation, or transfer prior to a Segment Maturity Date due to charges and adjustments imposed on those distributions, and this may occur even if index performance has been positive. |
| • | The method we use in calculating your Segment Interim Value may result in an amount lower than your Segment Investment, even if the Index has experienced positive investment performance since the Segment Start Date. Also, this amount may be less than the |
amount you would receive had you held the investment until maturity. Because the end-of-term downside protection provided by a Segment Buffer does not apply to the Segment Interim Value, it is theoretically possible that you could lose up to 100% of your investment and previously credited interest in certain extreme scenarios. This loss will be greater if you also have to pay a withdrawal charge, or if you have to pay taxes or tax penalties. |
| • | If you take a withdrawal, including required minimum distributions, and there is insufficient value in the other investment options available under your EQUI-VEST ® contract and the Segment Holding Account, we will withdraw amounts pro rata from any active Segments in your EQUI-VEST® contract. Amounts withdrawn from active Segments will be valued using the formula for calculating the Segment Interim Value. |
| • | Amounts paid on death or surrender before the Segment Maturity Date, will be based on the Segment Interim Value. |
• |
Any calculation of the Segment Interim Value will generally be affected by changes in both the volatility and level of the Index, as well as interest rates. The calculation of the Segment Interim Value is linked to various factors, including the value of a basket of put and call options on the Index as described in “Contract Adjustment — Segment Interim Value” in the Statement of Additional Information. The Segment Interim Value will generally be negatively affected by increases in the expected volatility of index prices, interest rate increases, and by poor market performance. All other factors being equal, the Segment Interim Value would be lower the earlier a withdrawal or surrender is made during a Segment. Also, for all contracts using a Performance Cap Rate limiting factor, participation in upside performance for early withdrawals is pro-rated based on the period those amounts were invested in a Segment. This means you participate to a lesser extent in upside performance the earlier you take a withdrawal. |
| • | You cannot transfer out of a Segment prior to its maturity to another investment option. You can only make withdrawals out of a Segment or surrender your EQUI-VEST® contract. The amount you would receive would be calculated using the formula for the Segment Interim Value. |
Risks Related to Segments, Segment Returns, and Segment Type Holding Accounts
| • | We may, in our sole discretion, not offer certain Segments on one or more Segment Start Dates. |
• |
We may not offer new Segments. Therefore, a certain Segment may not be available for you to transfer your Segment Maturity Value into after the Segment Maturity Date. |
| • | We have the right to substitute an alternative index prior to Segment Maturity if the publication of the Index is discontinued or at our sole discretion we determine that our |
use of the Index should be discontinued or if the calculation of the Index is substantially changed. If we substitute an index for an existing Segment, we would not change the Segment Buffer or Performance Cap Rate. We would attempt to choose a substitute index that has a similar investment objective and risk profile to the replaced index. |
| • | The amounts held in the Segment Holding Account may earn a return that is less than the return you might have earned if those amounts were held in another investment option. |
| • | The level of risk you bear and your potential investment performance will differ depending on the Segments you choose. All of the reference Indices are price return indices, meaning that dividends are excluding from the performance of the Index. The performance of an Index is based on changes in the values of the securities or other instruments that comprise or define the Index. The securities and instruments comprising or defining the Indices are subject to a variety of investment risks, many of which are complicated and interrelated. These risks may affect capital markets generally, specific market segments, or specific issuers. The performance of the Indices may fluctuate, sometimes rapidly and unpredictably. Negative Index performance may cause you to lose money on your investment in the contract. The historical performance of an Index or a Segment of the SIO does not guarantee future results. It is impossible to predict whether an Index will perform positively or negatively over the course of a Segment Duration. |
• |
In the highly unlikely event we were forced to stop offering new Segments, contract owners would be limited to transferring or contributing to the other investment options. You could choose to surrender your contract, but you may be subject to withdrawal charges, taxes, and tax penalties, and if you purchase another retirement vehicle, it may have different features, fees, and risks than your annuity contract. If you are buying the annuity contract for the SIO, you should speak to your financial adviser as to whether this product is suitable for you. |
Risks Related to Indices
While it is not possible to invest directly in an Index, if you choose to allocate amounts to a Segment of the SIO, you are indirectly exposed to the investment risks associated with the applicable Index. Because each Index is comprised or defined by a collection of securities, each Index is largely exposed to market risk and issuer risk.
Market risk is the risk that market fluctuations may cause the value of a security to fluctuate, sometimes rapidly and unpredictably. Issuer risk is the risk that the value of an issuer’s securities may decline for reasons directly related to the issuer, as opposed to the market generally.
| • | S&P Price Return Index: The S&P 500 Price Return Index is comprised of equity securities issued by large-capitalization U.S. companies. In general, large-capitalization companies may be unable to respond quickly to new competitive challenges, and may not be able to attain the high growth rate of successful smaller companies. |
| • | Russell 2000 ® Price Return Index: The Russell 2000® Price Return Index is comprised of equity securities of small-capitalization U.S. companies. In general, the securities of small-capitalization companies may be more volatile and may involve more risk than the securities of larger companies. Small-capitalization companies are more likely to fail than larger companies. |
| • | MSCI EAFE Price Return Index: The MSCI EAFE Price Return Index is an equity index that captures large and mid-cap representation across developed markets around the world. The securities comprising the MSCI EAFE Price Return Index are subject to the risks related to investments in foreign markets (e.g. increased price volatility; changing currency exchange rates; and greater political, regulatory, and economic uncertainty). In general, foreign markets may be less liquid, more volatile, and subject to less government supervision than domestic markets. |
Risks Associated with the Fixed Maturity Options
An allocation to a fixed maturity option has various risks associated with it.
Please be aware that a market value adjustment could result in a significant loss of principal and previously credited interest. In certain extreme circumstances, it is theoretically possible to lose 100% of your investment. Specifically:
| • | If you make any withdrawal (including transfers, surrender or termination of your contract, or when we make deductions for charges) from a fixed maturity option before it matures, we will make a market value adjustment. The market value adjustment may be negative. |
| • | If there is a market value adjustment and interest rates have increased from the time that you originally allocated to a fixed maturity option to the time that you take the withdrawal (including transfers, surrender or termination of your contract, or when we make deductions for charges), the market value adjustment will be negative and will reduce your value in the fixed maturity option. |
| • | The amount of the market value adjustment, either up or down, will be greater the longer the time remaining until the fixed maturity option’s maturity date. |
| • | Therefore, it is possible that a negative market value adjustment could greatly reduce your value in the fixed maturity options, particularly in fixed maturity options with later maturity dates. |
If we deduct all or a portion of a fee or charge from a fixed maturity option, a market value adjustment will apply to that deduction from the fixed maturity option. If the market value adjustment is negative, it will reduce your value in the fixed maturity option.
No company other than us has any legal responsibility to pay amounts that the Company owes under the contract and fixed maturity option. An owner should look to the financial strength of the Company for its claims-paying ability.
Risk associated with taking an early withdrawal
The contract is not a short-term investment and is not appropriate for an investor who needs ready access to cash because the contract is designed to provide for the accumulation of retirement savings and income on a long-term basis. As such, you should not use the contract as a short-term investment or savings vehicle and you should consider whether investing in the contract is consistent with the purpose for which the investment is being considered.
Withdrawals could significantly reduce the minimum death benefit by an amount greater than the value withdrawn.
Withdrawals may be subject to Withdrawal Charges, negative Segment Interim Value adjustments (see
Risks associated with the Structured Investment Option (SIO)
), negative Market Value Adjustments (see Risks associated with the Fixed Maturity Options
), loss of interest and the possibility of adverse tax consequences. Insurance company risk
No company other than us has any legal responsibility to pay amounts that we owe under the contract including amounts allocated to the SIO and fixed maturity options. The general obligations and any Guaranteed benefits under the contract are supported by our general account and are subject to our claims paying ability. You should look solely to our financial strength for our claims-paying ability.
Possible fees on access to account value
We may apply fees if you access your account value during the accumulation period or surrender your contract. For example, in addition to possible tax consequences, you may incur fees for accessing your account value such as a withdrawal charge, transfer fee, third party transfer or exchange fee, annual administrative expense, base contract expense, and/or a charge for any optional benefits.
Possible adverse tax consequences
The tax considerations associated with the contract vary and can be complicated. The applicable tax rules can differ, depending on the type of contract, whether TSA, EDC, Annuitant-Owned HR-10, Trusteed, SEP, SIMPLE IRA and SARSEP contracts. We cannot provide detailed information on all tax aspects of the contracts. Moreover, the tax aspects that apply to a particular person’s contract may vary depending on the facts applicable to that person. Tax rules may change without notice. We cannot predict whether, when, or how these rules could change. Any change could affect contracts purchased before the change. Congress may also consider further proposals to comprehensively reform or overhaul the United States tax and retirement systems, which if enacted, could affect the tax benefits of a contract. We cannot predict what, if any, legislation will actually be proposed or enacted. Before making contributions to your contract or taking other action related to your contract, you should consult with a tax professional to determine the tax implications of an investment in, and payments received under, the contract.
Contract Changes Risk
We may, at any time, exercise our rights to limit or terminate your contributions, allocations and transfers to any of the variable investment options. We reserve the right, subject to compliance with laws that apply, to remove variable investment options from the Separate Account, to combine any two or more variable investment options, to restrict or eliminate any voting rights as to the Separate Account, to limit or terminate contributions or transfers into any of the variable investment options, and to limit the number of variable investment options you may select.
We reserve the right to offer any or all Segments more or less frequently or to stop offering any of them (except we will always offer a Segment Option with a Segment Buffer that protects the first 10% of loss) or to suspend offering any or all of them temporarily for some or all contracts.
You should evaluate whether our ability to make the changes described above, and your ability to react to such changes, are appropriate based on your investment goals. When such changes occur, you should also evaluate whether those changes are appropriate based on your investment goals and, if not, you should evaluate your options under the Contract, which may be limited and may have negative consequences associated with them, as described in this section.
Risk of loss
All investments have risks to some degree and it is possible that you could lose money by investing in the contract. An investment in the contract is not a deposit with a bank and is not insured or guaranteed by the Federal Deposit Insurance Corporation or any other government agency.
Availability by financial intermediary
Some financial intermediaries (e.g., selling broker-dealer firms) may not offer and/or may limit the offering of certain investment options, contract benefits, and other contract features based on issue age or other criteria established by the selling broker-dealer. For example, your financial professional may not recommend a particular investment option or contract benefit to you that is described in this Prospectus. Before you purchase the contract, you should discuss with your financial professional any limitations, restrictions, or other variations related to the investment options, contract benefits or other contract features available to you through your financial professional. If a particular feature that interests you is not recommended through your broker-dealer, you may want to contact us to explore its availability.
Risk associated with taking a loan
Loans will decrease your account value and death benefit, and loaned amounts will not participate in the investment experience of your investment options. There may be adverse tax consequences associated with taking a loan from your contract.
Business disruption, cybersecurity, and artificial intelligence (“AI”) technologies risks
We rely heavily on technology, including interconnected computer systems and data storage networks and digital communications, to conduct our variable product business. Because our variable product business is highly dependent upon the effective operation of our computer systems and those of our service providers and other business partners, our business is vulnerable to disruptions from utility outages, and susceptible to operational and information security risks resulting from information systems failure (e.g., hardware and software malfunctions), and cyberattacks. Cyber-attacks may be systemic (e.g., affecting the internet, cloud services, or other infrastructure) or targeted (e.g., failures in or breach of our systems or those of third parties on whom we rely, including ransomware and malware attacks). Cybersecurity risks include, among other things, the loss, theft, misuse, corruption and destruction of data maintained online or digitally, interference with or denial of service, attacks on our websites (or the websites of third parties on whom we rely), other operational disruption and unauthorized release, use or abuse of confidential customer information. The risk of cyber-attacks may be higher during periods of geopolitical turmoil. Due to the increasing sophistication of cyber-attacks, a cybersecurity breach could occur and persist for an extended period of time without detection. Systems failures and cyberattacks, as well as, any other catastrophic event, including natural and manmade disasters, public health emergencies, pandemic diseases, terrorist attacks, floods or severe storms affecting us, any third-party administrator, the underlying funds, intermediaries and other affiliated or third-party service providers may adversely affect us, our business operations and your account value and interfere with our ability to process contract transactions and calculate account values. Systems failures and cyberattacks may also interfere with our processing of contract transactions, including the processing of orders from our website or with the underlying funds, impact our ability to calculate account values and unit values and/or the underlying funds to be unable to calculate share values, cause the release or possible destruction of confidential customer and/or business information, impede order processing or cause other operational issues, subject us and/or our service providers and intermediaries to regulatory fines, litigation and financial losses and/or cause reputational damage. Cybersecurity risks may also impact the issuers of securities in which the underlying funds invest, which may cause the underlying funds to lose value. The preventative actions we take to reduce the frequency and severity of cybersecurity incidents and protect our computer systems may be insufficient to prevent a cybersecurity breach from impacting our operations or your contract value. There can be no assurance that we or the underlying funds or our service providers and intermediaries will be able to avoid cybersecurity breaches affecting your contract.
The development and deployment of AI tools and technologies, including generative AI, and its use and
anticipated use by us or by third parties on whom we rely, may increase our existing operational risks or create new operational risks that we are not currently anticipating. AI and generative AI may be misused by us or by third parties upon which we rely, and that risk is increased by the relative newness of the technology, the speed at which it is being adopted, and the uncertain and evolving policy and regulatory landscape governing its use. Such misuse could expose us to legal or regulatory risk. Because the generative AI technology is so new, many of the potential risks of generative AI are currently unknowable.
In addition, we are also exposed to risks related to natural and man-made disasters, including, but not limited to, storms, fires, floods, earthquakes, public health crises, malicious acts, and terrorist acts, or any other event, which could adversely affect our ability to conduct business. A natural or man-made disaster, including a pandemic such as COVID-19, could result in our workforce, and/or employees of service providers and/or third-party administrators, being compromised and unable or unwilling to fully perform their responsibilities, which could likewise result in interruptions in our service. This could interfere with our processing of contract transactions, including processing orders from owners and orders with the underlying funds, impact our ability to calculate contract value, or have other adverse impacts on our operations. These events may also negatively affect the our service providers and intermediaries, the underlying funds and issuers of securities in which the underlying funds invest, which may cause the funds underlying your contract to lose value. There can be no assurance that we or the underlying funds or our service providers and intermediaries will be able to avoid negative impacts associated with natural and man-made disasters.
What are your investment options under the contract?
Your investment options, subject to any employer plan limitations, are the variable investment options, for Series 100 and Series 200 TSA and EDC contracts only: Segments available under the SIO, the guaranteed interest option, and the fixed maturity options available under the investment method you select. See “Selecting your investment method” in this prospectus.
Variable Investment Options
Contract value allocated to one of the variable investment options will vary based on the investment performance of he underlying Portfolio in which the variable investment option invests. There is a risk of loss of the entire amount invested. Because the variable investment option is not a Segment, it is not subject to any Segment Buffer. You can lose your principal when investing in the variable investment options. In periods of poor market performance, the net return, after charges, expenses and adjustments, may result in negative yields, including for the EQ/Money Market variable investment option. We may, at any time, exercise our rights to limit or terminate your contributions and to limit the number of variable investment options you may elect or to close a variable investment option to new contributions or transfers.
You can choose from among the variable investment options, for Series 100 and Series 200 TSA and EDC contracts only: Segments available under the SIO, the guaranteed interest option and fixed maturity options, subject to certain restrictions.
Portfolios of the Trusts
We offer both affiliated and unaffiliated Trusts, which in turn offer one or more Portfolios. Equitable Investment Management Group, LLC (“Equitable IMG”) is an affiliate of the Company and serves as the investment adviser of the EQ Advisors Trust (the “affiliated Trust”). For some affiliated Portfolios, Equitable IMG has entered into sub-advisory agreements with one or more other investment advisers (the “sub-advisers”) to carry out investment decisions for the Portfolios. As such, among other responsibilities, Equitable IMG oversees the activities of the sub-advisers with respect to the affiliated Trust and is responsible for retaining or discontinuing the services of those sub-advisers. The chart in
the Appendix: “Investment options available under the contract” indicates the sub-adviser(s) for each Portfolio, if any.
Information regarding each of the currently available Portfolios, their investment adviser(s) and/or sub-adviser(s), their current expenses, and their current performance is available in an appendix to the prospectus. See Appendix: “Investment options available under the contract.”
Each Portfolio has issued a prospectus that contains more detailed information about the Portfolio. You should consider the investment objectives, risks, and charges and expenses of the portfolios carefully before investing. In order to obtain copies of the portfolios’ prospectuses, you may call one of our customer service representatives at (877) 522-5035, or visit www.equitable.com/ICSR#EQH146649.
You should be aware that Equitable Advisors and Equitable Distributors, LLC (“Equitable Distributors”) (together, the “Distributors”) directly or indirectly receive 12b-1 fees from affiliated Portfolios for providing certain distribution and/or shareholder support services. These fees will not exceed 0.25% of the Portfolios’ average daily net assets. The affiliated Portfolios’ sub-advisers and/or their affiliates may also contribute to the cost of expenses for sales meetings or seminar sponsorships that may relate to the contracts and/or the sub-advisers’ respective Portfolios. In addition, Equitable IMG receives advisory fees and Equitable Investment Management, LLC, an affiliate of Equitable IMG, receives administration fees in connection with the services they provide to the Portfolios. It may be more profitable for us to offer affiliated Portfolios than to offer unaffiliated Portfolios.
The Company or the Distributors may directly or indirectly receive 12b-1 fees and additional payments from certain unaffiliated Portfolios, their advisers, sub-advisers, distributors or affiliates, for providing certain administrative, marketing, distribution and/or shareholder support services. These fees and payments range from 0% to 0.60% of the unaffiliated Portfolios’ average daily net assets. The Distributors may also receive payments from the advisers or sub-advisers of the unaffiliated Portfolios or their affiliates for certain distribution services, including expenses for sales meetings or seminar sponsorships that may relate to the contracts and/or the advisers’ respective Portfolios.
As a certificate owner, you may bear the costs of some or all of these fees and payments through your indirect investment in the Portfolios. (See the Portfolios’ prospectuses for more information.) These fees and payments, as well as the Portfolios’ investment advisory fees and administration expenses, will reduce the underlying Portfolios’ investment returns. The Company and/or its affiliates may profit from these fees and payments. The Company considers the availability of these fees and payment arrangements during the selection process for the underlying Portfolios. These fees and payment arrangements may create an incentive for us to select Portfolios (and classes of shares of Portfolios) that pay us higher amounts.
Some affiliated Portfolios invest in other affiliated Portfolios (the “EQ Fund of Fund Portfolios”). The EQ Fund of Fund Portfolios offer certificate owners a convenient opportunity to invest in other Portfolios that are managed and have been selected for inclusion in the EQ Fund of Fund Portfolios by Equitable IMG. Equitable Advisors, an affiliated broker-dealer of the Company, may promote the benefits of such Portfolios to certificate owners and/or suggest that certificate
owners consider whether allocating some or all of their account value to such Portfolios is consistent with their desired investment objectives. In doing so, the Company, and/or its affiliates, may be subject to conflicts of interest insofar as the Company may derive greater revenues from the EQ Fund of Fund Portfolios than certain other Portfolios available to you under your certificate. Please see “Allocating your contributions” later in this section for more information about your role in managing your allocations.
As described in more detail in the Portfolio prospectuses, the EQ Managed Volatility Portfolios may utilize a proprietary volatility management strategy developed by Equitable IMG (the “EQ volatility management strategy”) and, in addition, certain EQ Fund of Fund Portfolios may invest in affiliated Portfolios that utilize this strategy. The EQ volatility management strategy employs various volatility management techniques, such as the use of ETFs or futures and options, to reduce the Portfolio’s equity exposure during periods when certain market indicators indicate that market volatility is above specific thresholds set for the Portfolio. When market volatility is increasing above the specific thresholds set for a Portfolio utilizing the EQ volatility management strategy, the adviser of the Portfolio may reduce equity exposure. Although this strategy is intended to reduce the overall risk of investing in the Portfolio, it may not effectively protect the Portfolio from market declines and may increase its losses. Further, during such times, the Portfolio’s exposure to equity securities may be less than that of a traditional equity portfolio. This may limit the Portfolio’s participation in market gains and result in periods of underperformance, including those periods when the specified benchmark index is appreciating, but market volatility is high.
The EQ Managed Volatility Portfolios that include the EQ volatility management strategy as part of their investment objective and/or principal investment strategy, and the EQ Fund of Fund Portfolios that invest in Portfolios that use the EQ volatility management strategy, are identified in the Appendix: “Investment options available under the contract” by a “†”.
Portfolios that utilize the EQ volatility management strategy (or, in the case of certain EQ Fund of Fund Portfolios, invest in other Portfolios that use the EQ volatility management strategy) are designed to reduce the overall volatility of your account value and provide you with risk-adjusted returns over time. During rising markets, the EQ volatility management strategy, however, could result in your account value rising less than would have been the case had you been invested in a Portfolio that does not utilize the EQ volatility management strategy (or, in the case of the EQ Fund of Fund Portfolios, invest exclusively in other Portfolios that do not use the EQ volatility management strategy). Conversely, investing in investment options that
use the EQ volatility management strategy may be helpful in a declining market when high market volatility triggers a reduction in the investment option’s equity exposure because during these periods of high volatility, the risk of losses from investing in equity securities may increase. In these instances, your account value may decline less than would have been the case had you not been invested in investment options that use the EQ volatility management strategy. Please see the underlying Portfolio prospectuses for more information in general, as well as more information about the EQ volatility management strategy. See also Appendix “Investment options available under the contract” for more information.
Certain other affiliated Portfolios, as well as unaffiliated Portfolios, may utilize volatility management techniques (including Fund of Fund Portfolios that invest in other Portfolios that utilize volatility management techniques) that differ from the EQ volatility management strategy. Such techniques could also impact your Total account value and guaranteed benefit(s), if any, in the same manner described above.
Asset Transfer Program.
Portfolio allocations in certain of our variable annuity contracts with guaranteed benefits are subject to our Asset Transfer Program (ATP) feature. The ATP helps us manage our financial exposure in connection with providing certain guaranteed benefits, by using predetermined mathematical formulas to move account value between the EQ/Ultra Conservative Strategy Portfolio (an investment option utilized solely by the ATP) and the other Portfolios offered under those contracts. You should be aware that operation of the predetermined mathematical formulas underpinning the ATP has the potential to adversely impact the Portfolios, including their performance, risk profile and expenses. This means that Portfolio investments in certificates with no ATP feature, such as yours, could still be adversely impacted. Particularly during times of high market volatility, if the ATP triggers substantial asset flows into and out of a Portfolio, it could have the following effects on all contract and certificate and cert owners invested in that Portfolio:
| (a) | By requiring a Portfolio sub-adviser to buy and sell large amounts of securities at inopportune times, a Portfolio’s investment performance and the ability of the sub-adviser to fully implement the Portfolio’s investment strategy could be negatively affected; and |
| (b) | By generating higher turnover in its securities or other assets than it would have experienced without being impacted by the ATP, a Portfolio could incur higher operating expense ratios and transaction costs than comparable funds. In addition, even Portfolios structured as funds-of-funds that are not available for investment by contract owners who are subject to the ATP could also be impacted by the ATP if those Portfolios invest in underlying funds that are themselves subject to significant asset turnover caused by |
| the ATP. Because the ATP formulas generate unique results for each contract, not all contract owners who are subject to the ATP will be affected by operation of the ATP in the same way. On any particular day on which the ATP is activated, some contract owners may have a portion of their account value transferred to the EQ/Ultra Conservative Strategy Portfolio investment option and others may not. If the ATP causes significant transfers of total account value out of one or more Portfolios, any resulting negative effect on the performance of those Portfolios will be experienced to a greater extent by a contract owner (with or without the ATP) invested in those Portfolios whose account value was not subject to the transfers. |
Fixed Investment Options
Information regarding each currently offered fixed investment option, including its name, its term and its minimum guaranteed interest rate is available in an appendix to this prospectus. See Appendix “Investment options available under the contract”.
Guaranteed interest option
The guaranteed interest option is a fixed option that is part of our general account and pays interest at guaranteed rates. We discuss our general account in “More information” in this prospectus.
We credit interest daily to amounts in the guaranteed interest option. The minimum rate may vary depending on when your contract is issued but it will be shown on the data page for your contract and will never be less than 1.0%.
We set current interest rates periodically, according to our procedures that we have in effect at the time. All interest rates are effective annual rates, but before deduction of annual administrative charges or any withdrawal charges.
We assign an interest rate to each amount allocated to the guaranteed interest option. This rate is guaranteed for a specified period. The rate may be different depending on certain factors, including the type and series of your contract and when the allocation is made. An exception to this approach applies to Corporate Trusteed contracts and EDC contracts issued to government employees in New York whose EQUI-VEST funding arrangements became effective on and after July 1, 1989. Generally, we assign an interest rate to the total amounts invested in Corporate Trusteed and EDC contracts issued to government employees in New York regardless of when allocations were made to the guaranteed interest option.
®
We reserve the right to limit contributions to the guaranteed interest option. See “Allocating your contributions” in this section for more information.
There is no market value adjustment deduction in connection with any transfer of account value out of the guaranteed interest option due to changes in interest rates. A withdrawal from the certificate itself, however, may result in a withdrawal charge. For more information, see “Withdrawal charge” under “Charges, expenses, and adjustments”in this prospectus.
Fixed maturity options
The fixed maturity option is part of our general account and pays interest at guaranteed rates. The guaranteed minimum We discuss our general account in “More information” in this prospectus. We offer fixed maturity options with maturity dates generally ranging from one to ten years. The minimum guaranteed rate of interest is 3%. If you make any withdrawals (including transfers, surrender or termination of your contract, or when we make deductions for charges) from a fixed maturity option before it matures, we will make a market value adjustment, which will increase or decrease any fixed maturity amount you have in that fixed maturity option. Please see “Fixed maturity options” later in this section for more information.
Selecting your investment method for variable investment options
Subject to any employer plan limitations, you must choose one of the following two methods for selecting your investment options:
| • | Maximum investment options choice. |
| • | Maximum transfer flexibility. |
Temporary removal of transfer restrictions that apply to the investment methods
From time to time, we may remove certain restrictions that apply to your investment method. If we do so, we will tell you. For example, if you elect the “Maximum investment options choice” method, for a limited time there will be no restrictions on the amount you could transfer out of the guaranteed interest option listed in group “A.” If you elect the “Maximum transfer flexibility” method, for a limited time you will be able to use the fixed income variable investment options listed in group “B” as well as the fixed maturity options.
We will also tell you at least 45 days in advance of the day that we intend to reimpose the transfer restrictions. When we reimpose the transfer restrictions, if you elect the “Maximum investment options choice” method, limits on transfers out of the guaranteed interest option will again apply. If you elect the “Maximum transfer flexibility” method, you will no longer be permitted to allocate new contributions to, or transfer amounts into, the variable investment options in group B (including through our rebalancing program) or the fixed
maturity options. However, amounts that are in any investment options that are not available under “Maximum transfer flexibility” can remain in these options.
Please see options A and B in the investment options chart in the Appendix: “Investment options available under the contract” in this prospectus.
The Target Date Allocation investment options (which invest in the corresponding Target Date Allocation portfolios) are expected to invest more heavily in fixed income securities as they approach their respective target dates, and thereafter. See Appendix: “Investment options available under the contract” for a list of the Target Date Allocation portfolios. As each Target Date Allocation investment option reaches its respective target date, we reserve the right to make it a group “B” investment option. Please note that if you select the “Maximum transfer flexibility” method, and you allocate any contributions or account value to any of the Target Date Allocation investment options, you will be deemed to have changed to the “Maximum investment options choice” method. This change to your investment method will occur when you change your allocation instruction to include a Target Date Allocation investment option or when you make a transfer to a Target Date Allocation investment option that has been reassigned. We will notify you of this change in writing. Please note that if this occurs, the number of variable investment options available to you will increase. In other words, the “B” investment options will be available to you. However, your ability to transfer out of the guaranteed interest option will be limited.
If you select the “Maximum transfer flexibility” method but have not included any of the Target Date Allocation investment options among your allocations, you will not be changed to the alternate method but those options will no longer be available to you.
You may choose from any of the investment options available under your investment method. In all cases, if any of the options listed in B in the chart referenced in the Appendix: “Investment options available under the contract” are selected, you will be subject to the restrictions on transfers out of the guaranteed interest option that apply under the “Maximum investment options choice” investment method.
Please note that under Trusteed contracts your employer or the plan trustee will select the investment method available to the participant. Under all other contracts, you may choose from any of the investment options available under your investment method. In all cases, if any of the options listed in B in the chart referenced in the Appendix: “Investment options available under the contract” are selected, you will be subject to the restrictions on transfers out of the guaranteed interest option that apply under the “Maximum investment options choice” investment method.
A participant is an individual who participates in an employer’s plan funded by an EQUI-VEST
®
contract. The participant is also the annuitant. Structured Investment Option (For Series 100 and Series 200 TSA and EDC contracts only)
The SIO provides you with the opportunity to earn interest that we will credit based, in part, on the performance of
external indices from the Segment Start Date to the Segment Maturity Date. Please be aware that the possibility of a negative return could result in a significant loss of principal and previously credited interest.
The Structured Investment Option consists of Segment Types which provide a rate of return tied to the performance of an Index. We will credit positive or negative interest to amounts allocated to a Segment of the SIO on the Segment Maturity Date based, in part, on the performance of the applicable Index. An investment in a Segment of the SIO is not an investment in the Index or in any index fund. You could lose a significant amount of money if the external index declines in value.
Each month, you have the opportunity to invest in a Segment, subject to the requirements, limitations and procedures disclosed in this section. Investments in Segments are not investments in the Index or in any index fund. The Structured Investment Option is not available in all states. Please contact the customer service group referenced in the Prospectus or your financial professional for information on state availability. Also, see “Appendix: State contract availability and/or variations of certain features and benefits” for more information.
Segment Type
Information regarding the features of each of the currently available Segment Types, including the Index name and type, the Segment Duration, the current Segment Buffer, and the minimum Performance Cap Rate for the life of the Segment Type, is available in an appendix to the prospectus. See Appendix “Investment Options available under the contract.”
We currently offer seven Segment Types. We intend to offer a Segment each month, on the Segment Start Date. We are not obligated to offer any one particular Segment Type. Also, we are not obligated to offer any Segment Type. A Segment Type refers to Segments that have the same Index, Segment Duration, and Segment Buffer. A Segment Type has a corresponding Segment Holding Account. Please refer to the “Definitions of key terms” section earlier in this Prospectus for a discussion of these terms. Not all Segment Durations are available in all states. Please see “Appendix: State contract availability and/or variations of certain features and benefits” for more information.
The following Segment Types are currently available:
Index |
Segment Duration |
Segment Buffer | ||
| S&P 500 Price Return Index | 1 year | -10% | ||
| S&P 500 Price Return Index | 3 year | -20% | ||
| S&P 500 Price Return Index | 5 year | -20% | ||
| Russell 2000 ® |
1 year | -10% | ||
| Russell 2000 ® |
3 year | -20% | ||
| Russell 2000 ® |
5 year | -20% | ||
| MSCI EAFE Price Return Index | 1 year | -10% |
At maturity, the highest level of protection is the -20% Segment Buffer and the lowest level of protection is the -10% Segment Buffer.
We may change the Indices and/or Segment Options in the future but we will always offer a Segment Option with a Segment Buffer that protects the first 10% of loss. In the future, we may offer other Segment Options that do not provide any downside protection which would mean there is a risk of loss of the entire amount invested.
The Indices are described in more detail below, under the heading “Indices.”
Each Segment has a Performance Cap Rate that we set on the Segment Start Date. See “Performance Cap Rate” below.
For example, a Segment could be S&P 500 Price Return Index/ 1 year/-10%/ September 2025 with a 20% Performance Cap Rate declared on the Segment Start Date. This means that you will participate in the performance of the S&P 500 Price Return Index for one year starting from the September 2025 Segment Start Date. If the Index performs positively during this period, your rate of return at maturity could be as much as 20% for that Segment Duration. If the Index performs negatively during this period, at maturity you will be protected from the first 10% of the Index’s decline. If the Index performance is between -10% and 0%, your Segment Return Amount at maturity will equal your Segment Investment.
Both the Performance Cap Rate and the Segment Buffer are rates of return from the Segment Start Date to the Segment Maturity Date.
®
contract, die or make a withdrawal from a Segment before the Segment Maturity Date, the Segment Buffer will not necessarily apply to the extent it would on the Segment Maturity Date, and any upside performance will be limited to a percentage lower than the Performance Cap Rate. Please see “Your account value in the Structured Investment Option” later in this section. A partial withdrawal from a Segment does not affect the Performance Cap Rate and Segment Buffer that apply to any remaining amounts that are held in the Segment through the Segment Maturity Date. Please see “Performance Cap Rate limiting factor” in “Contract Adjustment — Segment Interim Value” in the Statement of Additional Information for table(s) showing which contracts will no longer use a Performance Cap Rate limiting factor. We reserve the right to offer any or all Segments more or less frequently or to stop offering any of them (except we will always offer a Segment Option with a Segment Buffer that protects the first 10% of loss) or to suspend offering any or all of them temporarily for some or all contracts. Please see “Suspension, termination and changes to the Segment
Type and Index” later in this section. We may also add different Segment Types in the future.
You may not have more than 12 active Segments in addition to the Segment Holding Account.
Segment Buffer
The SIO provides some protection against negative returns on the Segment Maturity Date through the use of a Segment Buffer. The extent of the downside protection provided by the Segment Buffer varies by Segment, ranging from the first 10% to 20% of loss. For example, if the Index return is -25% and the Segment Buffer is -10%, we will credit -15% (the amount that exceeds the Segment Buffer) in interest on the Segment Maturity Date assuming there are no fees or charges assessed, meaning your Segment Investment will decrease by 15%.
There is a risk of a substantial loss of your principal and previously credited interest because you agree to absorb all losses to the extent they exceed the applicable Segment Buffer on the Segment Maturity Date.
The Segment Buffer for each Segment will not change throughout the Segment Duration. See Appendix: “Investment options available under the contract” for the current Segment Buffer for each Segment Type.
We may change the Indices and/or Segment
Options in the future but we will always offer a Segment Option with a Segment Buffer that protects the first 10% of loss.
In the future, we may offer other Segment Options that do not provide any downside protection which would mean there is a risk of loss of the entire amount invested.
The Segment Buffer is set at our sole discretion. In determining the current Segment Buffer for a Segment Type, we consider, among other factors, the Segment Rate of Return calculation method, the cost of hedging instruments, the range of Performance Cap Rates that may be offered with the Segment Buffer, protection levels offered by our competitors, and the current market environment. Before selecting a Segment for investment, you should consider whether the Segment Buffer is consistent with your risk tolerance and investment goals for the Segment Duration of the Segment Type.
On a Segment Maturity Date, the highest level of protection provided by a Segment Buffer is the -30% Segment Buffer and lowest level of protection provided by a Segment Buffer is the -10% Segment Buffer.
Indices
Each Segment Type references an Index that determines the performance of its associated Segments. We currently offer Segment Types based on the performance of the S&P 500 Price Return Index, the Russell 2000
®
Price Return Index and the MSCI EAFE Price Return Index. Throughout this Prospectus, we refer to these indices using the term “Index” or, collectively, “Indices.” Please note that each Index is a price return index, which means that changes in the value of the Index are
determined solely by changes in the price of each security included in the Index. By contrast, a total return index also includes the value of all dividends, interest, rights offerings or other distributions associated with each security included in the index. This will reduce the Index return and will cause the Index to underperform a direct investment in the securities composing the Index. For example, the value of the S&P 500 Price Return Index incorporates dividends and other distributions by assuming that they are reinvested in the entire index.
S&P 500 Price Return Index.
Russell 2000
®
Price Return Index.®
Price Return Index was established by Russell Investments. The Russell 2000®
Price Return Index measures the performance of the small-cap segment of the U.S. equity universe. The Russell 2000®
Price Return Index is a subset of the Russell 3000®
Index representing approximately 10% of the total market capitalization of that index. It includes approximately 2,000 of the smallest securities based on a combination of their market cap and current index membership. The Russell 2000®
Price Return Index does not include dividends declared by any of the companies included in this Index, which will reduce Index performance. Additional information about the Index may be found in Appendix: Index Publishers. If you would like to request additional information about the Index, contact the customer service group or your financial professional.
MSCI EAFE Price Return Index.
designed to measure the equity market performance of developed markets, excluding the US and Canada. As of the date of this Prospectus the MSCI EAFE Price Return Index consisted of the following 22 developed market country indices: Australia, Austria, Belgium, Denmark, Finland, France, Germany, Greece, Hong Kong, Ireland, Israel, Italy, Japan, the Netherlands, New Zealand, Norway, Portugal, Singapore, Spain, Sweden, Switzerland, and the United Kingdom. The MSCI EAFE Price Return Index does not include dividends declared by any of the companies included in this Index, which will reduce Index performance. Additional information about the Index may be found in Appendix: Index Publishers. If you would like to request additional information about the Index, contact the customer service group or your financial professional.
Index Performance Examples
The bar charts shown below provide each Index’s annual returns for the last 10 calendar years (or for the life of the Index if less than 10 years), as well as the Index returns after applying a hypothetical 5% cap and a hypothetical -10% buffer. The chart illustrates the variability of the returns from year to year and shows how hypothetical limits on Index gains and losses may affect these returns. Past performance is not necessarily an indication of future performance.
The performance below is NOT the performance of any Segment of the SIO. Your performance under the contract will differ, perhaps significantly. The performance below may reflect a different return calculation, time period, and limit on Index gains and losses than the Segments of the SIO, and does not reflect contract fees and charges, including withdrawal charges and negative Segment Interim Value adjustments, which reduce performance.
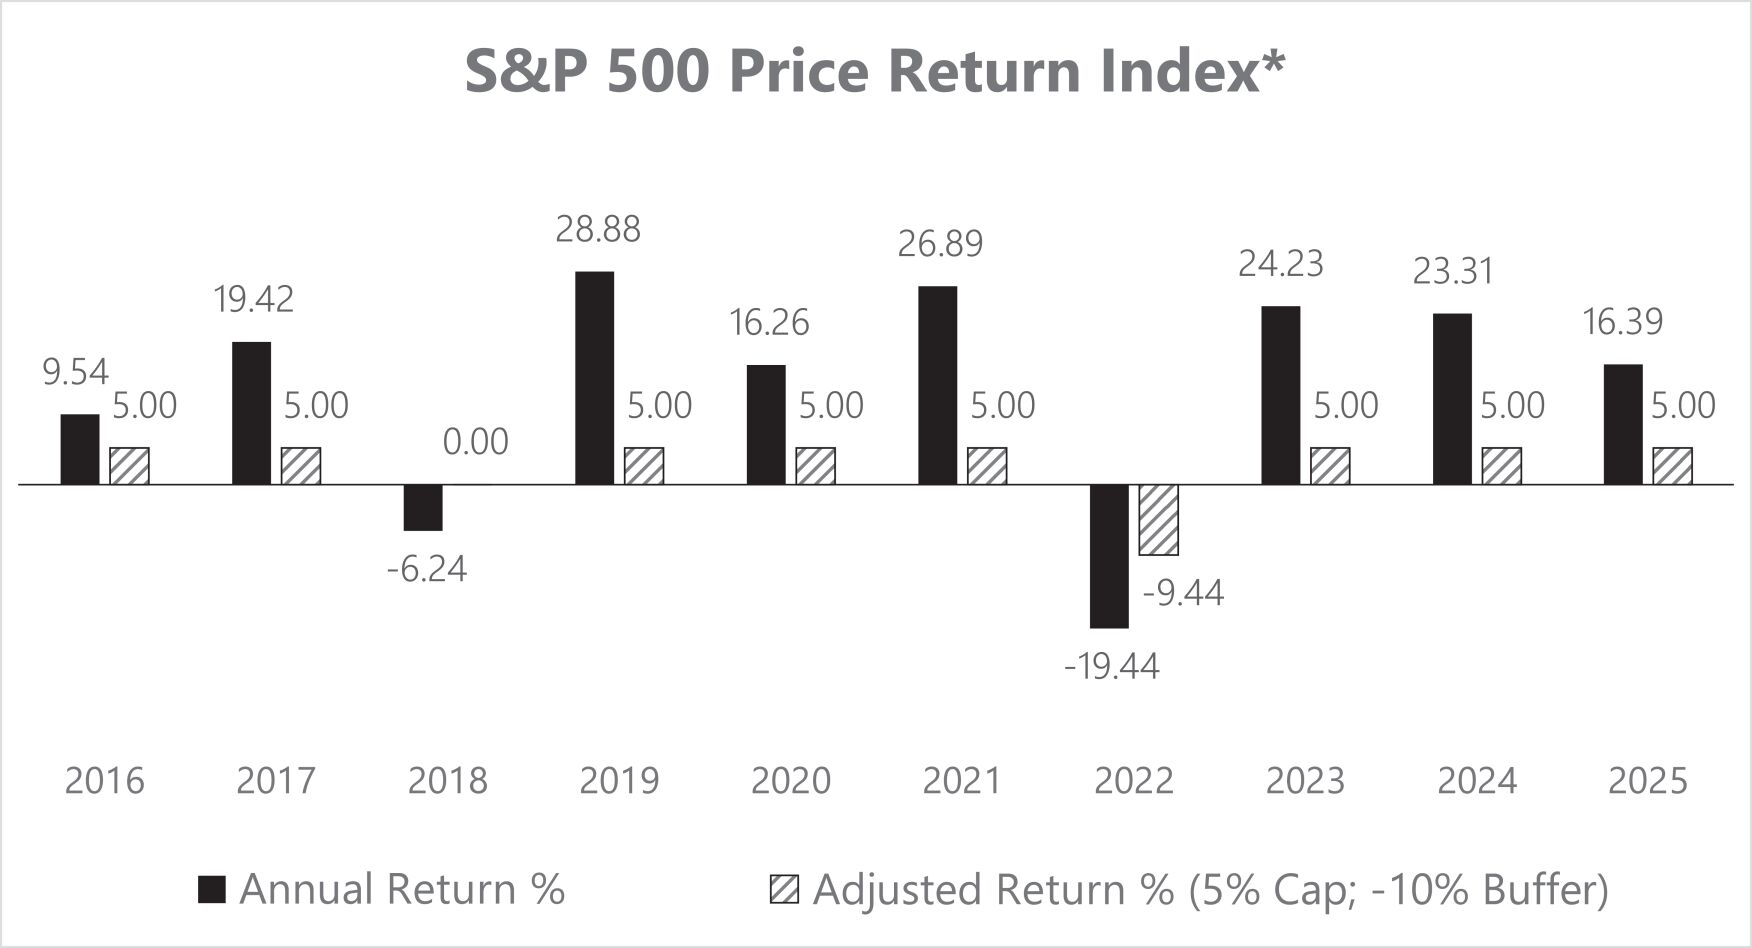
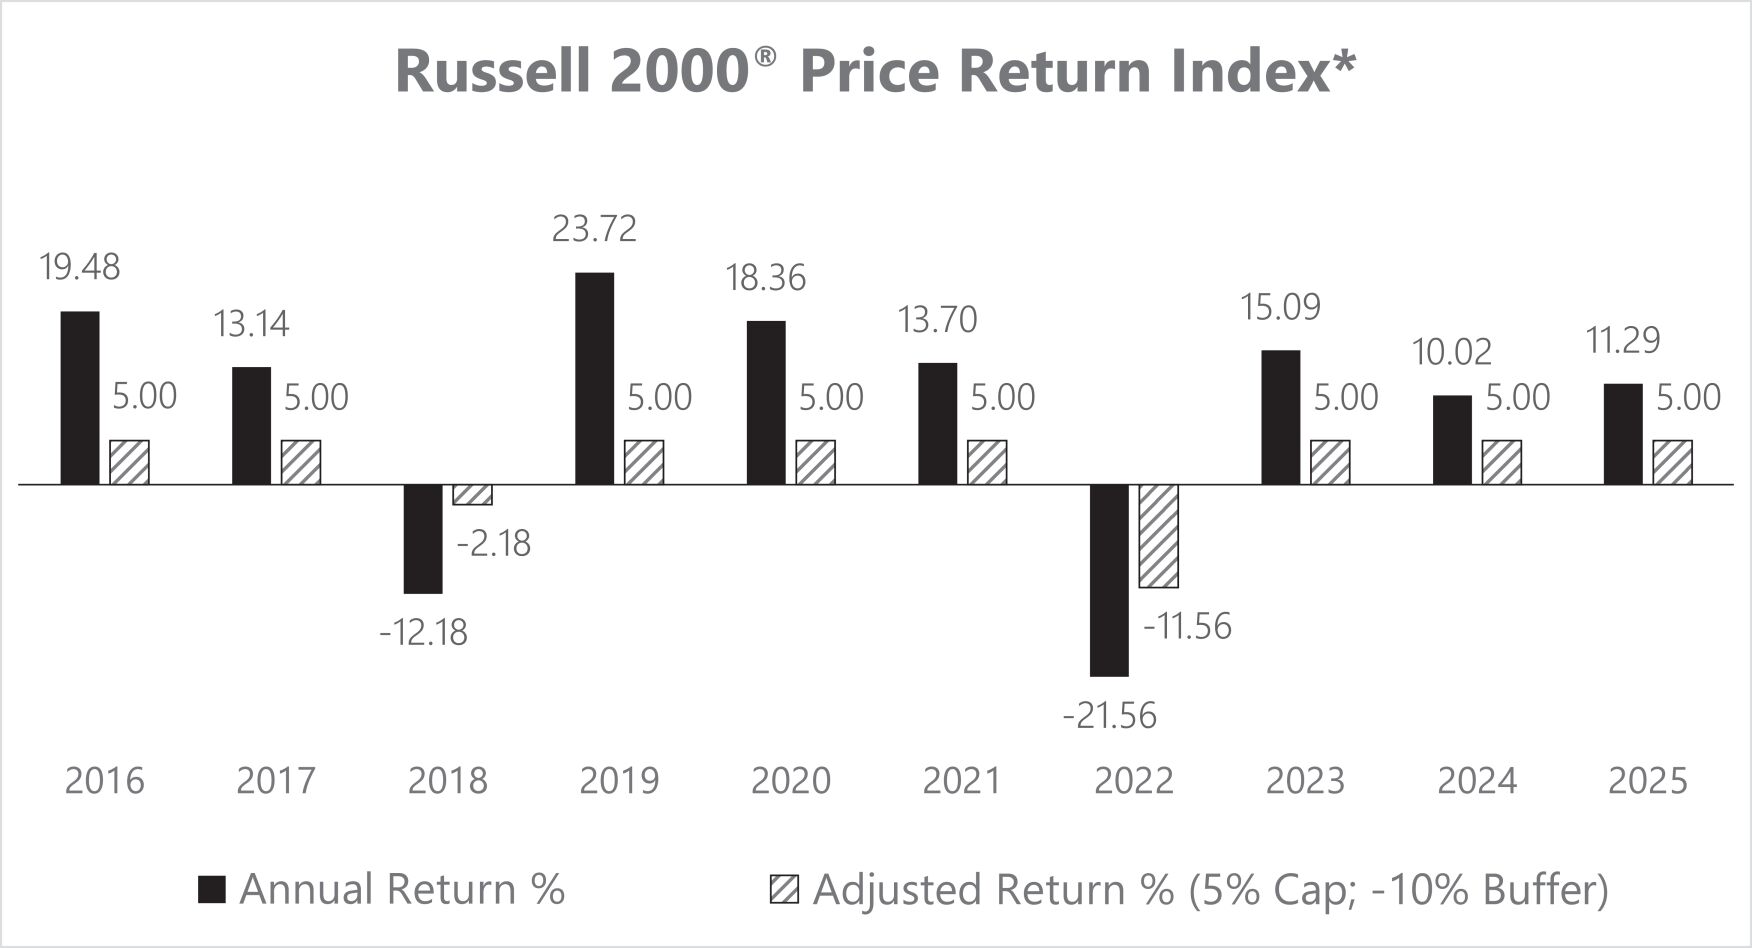
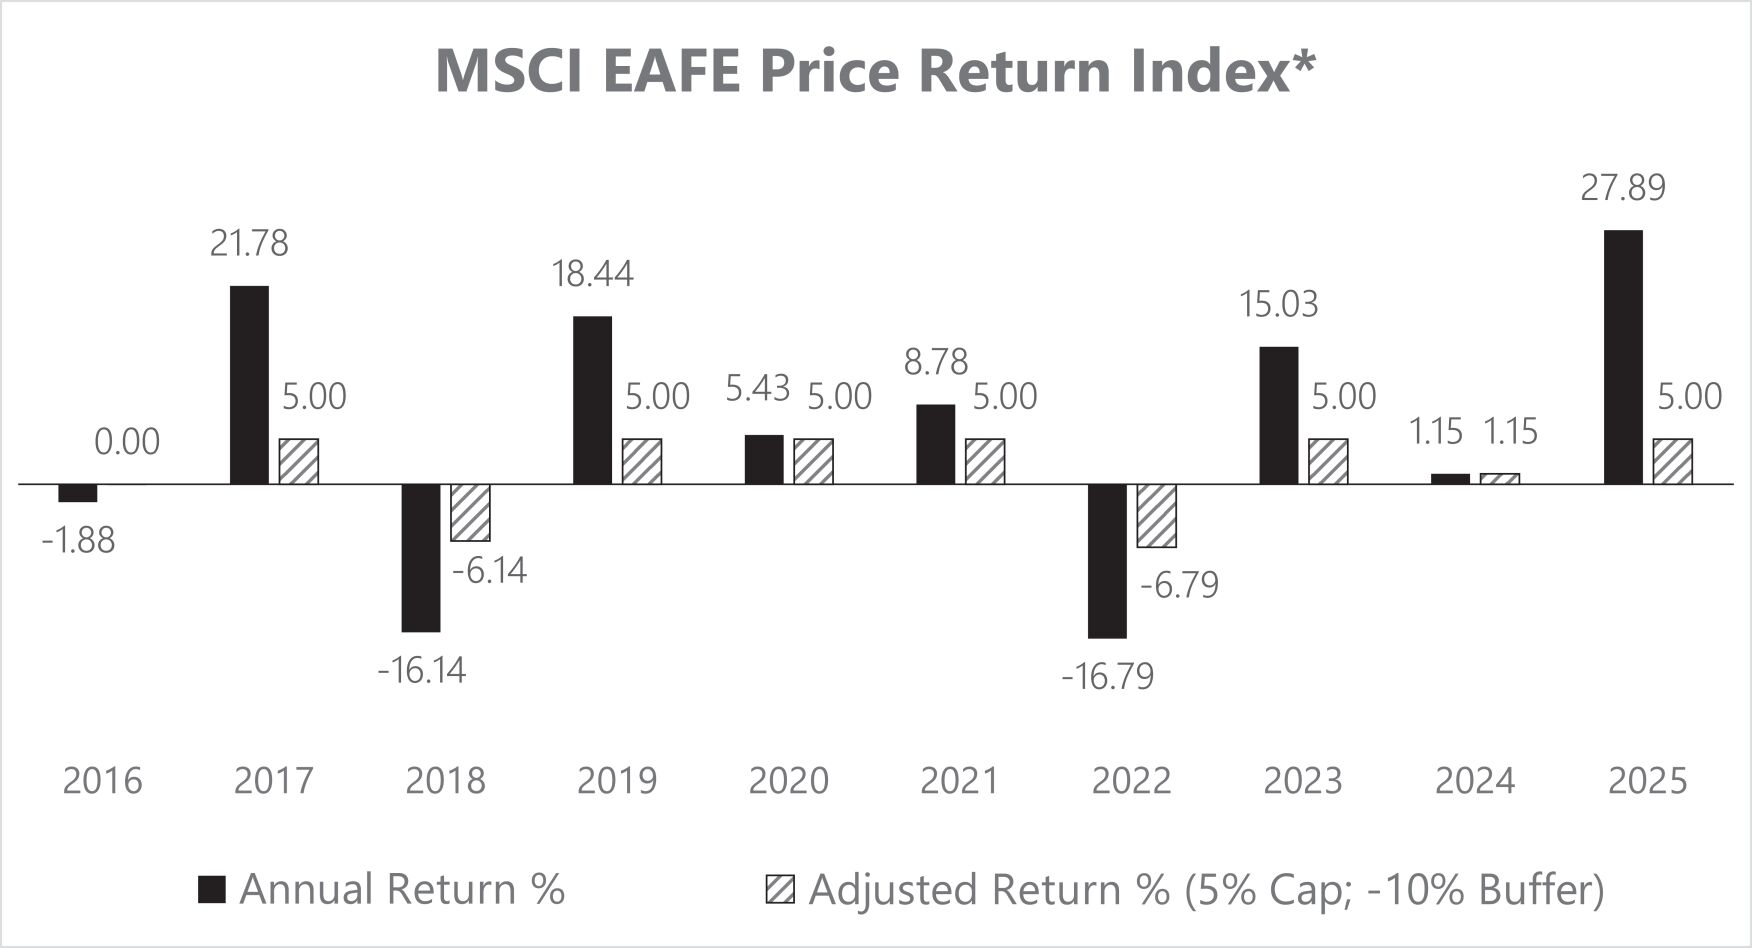
| * | The Index is a “price return” index, not a “total return” index, and therefore the performance of the Index does not reflect dividends declared by any of the companies included in the Index, reducing the Index return. As a result, the Index will underperform a direct investment in the securities composing the Index. |
Segment Holding Account
Any contribution or transfer designated for a Segment Type will be allocated to the Segment Holding Account until the Segment Start Date. The Segment Holding Account is part of the EQ/Money Market variable investment option. Please see “Separate Account Annual Expenses” later in this prospectus for more information regarding non-guaranteed charge waivers in the Segment Holding Account. You must transfer or contribute to the Segment Holding Account for the corresponding Segment Type if you want to invest in a Segment; you cannot transfer or contribute directly to a Segment.
You can transfer amounts from the Segment Holding Account into any of the investment options, or another Segment Holding Account at any time up to the close of business on the last business day before the Segment Start Date.
Please see “How to reach us” for more information regarding contacting us and communicating your instructions. We also have specific forms that we recommend you use for electing the Structured Investment Option and any Structured Investment Option transactions.
Segment Start Date
Each Segment will have a Segment Start Date, which is generally the second Segment Business Day occurring after the 13th of the month. However, the Segment Start Date may sometimes be a later date under certain circumstances. Please see “Setting the Segment Maturity Date and Segment Start Date” below.
Segment Rate of Return
If the Index Performance Rate is positive, then the Segment Rate of Return is a rate equal to the Index Performance Rate,
but not more than the Performance Cap Rate. If the Index Performance Rate is negative, but declines by a percentage less than or equal to the Segment Buffer, then the Segment Rate of Return is 0%. If the Index Performance Rate is negative, and declines by more than the Segment Buffer, then the Segment Rate of Return is negative, but will not reflect the first -10% or -20% of downside performance, depending on the Segment Buffer applicable to that Segment.
Performance Cap Rate
The Performance Cap Rate is the maximum Segment Rate of Return that each Segment will be credited with on the Segment Maturity Date. We will declare a Performance Cap Rate for each Segment on the Segment Start Date. Information about current Performance Cap Rates is incorporated in this prospectus by reference from www.equitable.com/equivestsio.
The Performance Cap Rate is set at our sole discretion. In determining the current Performance Cap Rate for a Segment Type, we consider, among other factors, the Segment Rate of Return calculation method, the cost of hedging instruments, the rates offered by our competitors, the rates of other Segments, and the current market environment. In general, the Performance Cap Rates will be lower for Segment Types that offer greater protection from negative returns or additional enhancements to positive returns. Before selecting a Segment for investment, you should consider whether the current Performance Cap Rate is acceptable to you in return for the protection from negative returns or enhancements to positive returns that may be applied at the end of the Segment Duration for that Segment Type.
Because we declare the Performance Cap Rate for a Segment on its Segment Start Date, you will not know the Performance Cap Rate for a new Segment until your account value has been transferred from the corresponding Segment Holding Account into the Segment. You may not transfer out of a Segment before the Segment Maturity Date. For this reason, we permit you to specify a Performance Cap Threshold, which we describe below under “Segment Participation Requirements.” For more information regarding transfer restrictions, please see “Transfers” later on in this prospectus.
The Performance Cap Rate may limit your participation in any increase in the underlying Index associated with a Segment. For example, if the Index return is 12% and the Performance Cap Rate is 4%, we will credit 4% in interest on the Segment Maturity Date, meaning your Segment Investment will increase by 4%. Our minimum Performance Cap Rates for 1, 3, and 5-year Segments are 4%, 12%, and 20%, respectively. See Appendix: “State contract availability and/or variations of certain features and benefits” for more information on state variations. For more information about the Segment suspension, see “Suspension, Termination and Changes to Segment Types and Indices” later in this section. We guarantee that for the life of your contact we will not open a Segment with a Performance Cap Rate below the applicable minimum Performance Cap Rate. In some cases, we may decide not to declare a Performance Cap Rate for a Segment, in which case there is no maximum Segment Rate of Return for that Segment.
Please note that the Performance Cap Rate and Segment Rate of Return are rates of return from the Segment Start Date to the Segment Maturity Date. The Performance Cap Rate is set at our sole discretion.
Segment Participation Requirements
All amounts in the Segment Holding Account as of the close of business on the business day preceding the Segment Start Date, plus any earnings on those amounts, will be transferred into the Segment on the Segment Start Date, provided that all participation requirements are met.
Amounts transferred into the Segment Holding Account on a Segment Start Date will not be included in any new Segment created that day. These amounts will remain in the Segment Holding Account until they are transferred out or the next Segment Start Date on which the participation requirements are met for the amounts to be transferred into a new Segment.
If you change your Performance Cap Threshold on a Segment Start Date, that Performance Cap Threshold will not affect the participation requirements for any Segment created that day. For example, if you have a Performance Cap Threshold on file of 6.0%, but change it to 9.0% on a Segment Start Date, any amounts in the Segment Holding Account will be transferred into a new Segment of the Segment Type that we create that day with a Participation Cap Rate equal to or higher than 6.00%, if the other participation requirements are met. For example, a Performance Cap Rate of 7.0% would meet your Performance Cap Threshold on that Segment Start Date.
The following participation requirements must be met on a Segment Start Date in order for any amount designated for a Segment Type to be transferred from a Segment Holding Account into the designated new Segment: (1) minimum sweep amount is met; (2) Segment is available; (3) Segment Maturity Date Requirement is met; and (4) Performance Cap Threshold is met. If these requirements are met, your account value in the Segment Holding Account will be transferred into a new Segment. This amount is your initial Segment Investment.
(1) Minimum sweep amount is met.
| • | For EQUI-VEST Employer-Sponsored Retirement Plans (Series 100) and EQUI-VEST ® Employer-Sponsored Retirement Plans (Series 200) TSA and EDC contracts only, |
availability. Also see Appendix: “State contract availability and/or variations of certain features and benefits” for more information on state variations to the minimum amount that must be accumulated in the Segment Holding Account before it will be swept into a 1-year Segment. |
| • | EQUI-VEST ® VantageSM contracts, |
(2) Segment is available.
(3) Segment Maturity Date
Requirement is met.
®
contract maturity date, your account value in the Segment Holding Account will be transferred to the EQ/Money Market variable investment option. (4) Performance Cap Threshold is met.
For example, you may specify a Performance Cap Threshold of 8.0%. If we set a Performance Cap Rate of 8.0% or higher for the next available Segment of that Segment Type, then we will transfer the applicable account value to the new Segment, provided all other requirements and conditions are met. However, if we set the Performance Cap Rate at 7.9% for that Segment, the applicable account value would not be transferred to the new Segment and your account value will remain in the Segment Holding Account, until the next available Segment for which your threshold is met.
If you specify a Performance Cap Threshold, it will remain in effect until you change it.
If you do not specify a Performance Cap Threshold, then we will transfer your account value from the Segment Holding Account into a Segment, regardless of how low the Performance Cap Rate may be if the other participation requirements are met.
Once your account value has been swept from a Segment Holding Account into a Segment, transfers into or out of
that Segment before its Segment Maturity Date are not permitted.
We permit you, but do not require you, to specify a Performance Cap Threshold so that you have additional flexibility in managing your contract. We do not require that you select a Performance Cap Threshold because you may wish to invest in a Segment regardless of the particular Performance Cap Rate. If you do not specify a threshold, you risk the possibility that the Performance Cap Rate established will have a lower cap on returns than you would otherwise find acceptable. You may wish to discuss with your financial professional whether to specify a Performance Cap Threshold and, if so, at what percentage.
You will receive confirmation of any Performance Cap Threshold you set that indicates the date on which the Performance Cap Threshold expires. You can also monitor your Performance Cap Thresholds, including their expiry dates, using Equitable Client portal.
Segment Maturity Date
Your Segment Maturity Date is generally the first Segment Business Day occurring after the 13th day of the same month as the Segment Start Date in the calendar year in which the Segment Duration ends. However, the Segment Maturity Date in a particular month may be a later date under certain circumstances. Please see “Setting the Segment Maturity Date and Segment Start Date” below.
You may tell us how to allocate the Segment Maturity Value among the investment options. You may tell us either to follow your allocation instructions on file for new contributions, to withdraw all or a portion of your Segment Maturity Value, or to transfer your Segment Maturity Value to the next available Segment, provided the participation requirements are met.
As stated above, you may elect to have maturing Segments invested according to your allocations on file. You may also elect to transfer all or a portion of your Segment Maturity Value to the next available Segment. The designated portion of your Segment Maturity Value will be transferred to the Segment Holding Account, as of the close of business on the Segment Maturity Date. Assuming that all participation requirements are met, the designated amounts will be treated like any other amounts in a Segment Holding Account. On the next Segment Start Date, the designated amounts in the Segment Holding Account will be transferred into the Segment. Typically, this means the designated amounts would be held in a Segment Holding Account for one business day.
If you have not provided us with maturity instructions, the Segment Maturity Value will be transferred to the Segment Holding Account. Your Segment Maturity Value would then be transferred from that Segment Holding Account into the next Segment on the Segment Start Date. If the next Segment to be created would not meet the Segment Maturity Date Requirement or the Segment Type has been terminated, we will instead transfer your Segment Maturity Value
to the EQ/Money Market variable investment option. Alternatively, if you designate a Performance Cap Threshold that is not met on the next Segment Start Date or if the Segment Type has been suspended, your Segment Maturity Value will remain in the Segment Holding Account. If you are impacted by these delays, you may transfer your Segment Maturity Value out of the Segment Holding Account into any other investment options available under your EQUI-VEST
®
contract at any time before the next month’s Segment Start Date. Segment Maturity Value
On the Segment Maturity Date, we calculate your Segment Maturity Value using your Segment Investment and the Segment Rate of Return. The Segment Rate of Return is equal to the Index Performance Rate (the percentage change in the value of the related Index from the Segment Start Date to the Segment Maturity Date), subject to the Performance Cap Rate and Segment Buffer, as follows:
If the Index Performance Rate: |
Your Segment Rate of Return will be: | |
| goes up by more than the Performance Cap Rate | positive, equal to the Performance Cap Rate | |
| goes up by less than the Performance Cap Rate | positive, equal to the Index Performance Rate | |
| stays flat or goes down by a percentage equal to or less than the Segment Buffer | equal to 0% | |
| goes down by a percentage greater than the Segment Buffer | negative, to the extent of the percentage exceeding the Segment Buffer |
Your Segment Maturity Value is calculated as follows:
We multiply your Segment Investment by your Segment Rate of Return to get your Segment Return Amount. Your Segment Maturity Value is equal to your Segment Investment plus your Segment Return Amount. Your Segment Return Amount may be negative, in which case your Segment Maturity Value will be less than your Segment Investment. All of these values are based on the value of the relevant Index on the Segment Start Date and they are compared to the values on the Segment Maturity Date. Any fluctuations in the value of the Index between those dates is ignored in calculating the Segment Maturity Value. See the “Appendix: Segment Maturity Value Calculation Examples” for more information.
Setting the Segment Maturity Date and Segment Start Date
There will be a Segment Maturity Date and Segment Start Date each month. The Segment Maturity Date for Segments maturing in a given month and the Segment Start Date for new Segments starting in that same month will always be scheduled to occur on the first two consecutive business days that are also Segment Business Days occurring after the 13th of a month.
Please see Appendix: “Segment Maturity Date and Segment Start Date examples” later in this prospectus for a demon-
stration of the effects weekends and scheduled holidays can have on the Segment Maturity Date and the Segment Start Date.
Effect of an emergency close.
An emergency closure of the NYSE can have a different effect if it occurs on a Segment Maturity Date rather than a Segment Start Date.
| • | If an emergency closure of the NYSE occurs on a scheduled Segment Maturity Date, then the Segment Maturity Date for that Segment will be delayed until the next Segment Business Day. The next Segment Business Day would be the Segment Start Date. If the emergency closure only lasted that one day, the Segment Start Date and the Segment Maturity Date for the affected Segment would occur on the same day. |
| — | For example, assume Monday the 14th is the scheduled Segment Maturity Date in a given month. If the NYSE does not open due to an emergency condition, there would be no reference price that day for the Index. A Segment that was scheduled to mature on the 14th of that month could not mature, because we would not have a price with which to calculate the Segment Maturity Value. This would mean if the NYSE opens on Tuesday the 15th the Segment Maturity Date would be Tuesday the 15th. However, the Segment Start Date for a new Segment created that month would be Tuesday the 15th. |
| • | If an emergency closure occurs on a scheduled Segment Start Date, then we would not create a Segment that utilizes the Index. Consequently, Segment Maturity Values designated for the Segment Type that utilizes the Index would not be allocated to a Segment that month and would remain in the Segment Holding Account. |
| — | For example, assume that the NYSE did not open on the 14th or the 15th. A Segment that utilizes the Index would be matured at the next available price after the 15th and, consequently, could not participate in a Segment established for that month. The resulting Segment Maturity Values would remain in the Segment Holding Account until the following month or until you provided further instruction. |
If the conditions that cause an emergency close persist, we will use reasonable efforts to calculate the Segment Maturity Value of an affected Segment. If the Index cannot be priced within eight days, we will contact a calculating agency, normally a bank we have a contractual relationship with, which will determine a price to reflect a reasonable estimate of the Index level.
Suspension, Termination and Changes to the Segment Type and Index
We may decide at any time until the close of business on each Segment Start Date whether to offer the Segment Type described in this Prospectus on a Segment Start Date for a particular Segment. We may suspend the Segment Type for a month or a period of several months, or we may terminate the Segment Type entirely.
If the Segment Type is suspended, your account value will remain in the Segment Holding Account until a Segment of the Segment Type is offered or you transfer out of the Segment Holding Account.
If the Segment Type is terminated, your account value in the Segment Holding Account will be defaulted into the EQ/Money Market variable investment option on the date that would have been the Segment Start Date.
We have the right to substitute an alternative index prior to the Segment Maturity Date if the publication of the Index is discontinued or at our sole discretion we determine that our use of such Index should be discontinued or if the calculation of the Index is substantially changed. In addition, we reserve the right to use any or all reasonable methods to end any outstanding Segments that use the Index. We also have the right to add additional indices at any time. We would provide notice about the use of additional or alternative indices, as soon as practicable, in a supplement to this Prospectus. If an alternative index is used, its performance could impact the Index Performance Rate, Segment Rate of Return, Segment Maturity Value and Segment Interim Value because it would be used to calculate performance from the Segment Start Date to the Segment Maturity Date. An alternative index would not change the Segment Buffer or Performance Cap Rate for an existing Segment. If a similar index cannot be found, we will end the affected Segments prematurely by applying the Performance Cap Rate and Segment Buffer that were established on the applicable Segment Start Date to the actual gains or losses on the original Index as of the date of termination. We would attempt to choose a substitute index that has a similar investment objective and risk profile to the replaced index.
For example, if the S&P 500 Price Return Index was not available, we might use the NASDAQ or the Russell 2000
®
Price Return Index. We reserve the right to offer any or all Segments more or less frequently or to stop offering any of them (except we will always offer a Segment Option with a Segment Buffer that protects the first 10% of loss) or to suspend offering any or all of them temporarily for some or all contracts. If we stop offering or suspend the Segment Type, each existing Segment of the Segment Type will remain invested until its respective Segment Maturity Date.
Your account value in the Structured Investment Option
Your value in each Segment on the Segment Maturity Date is calculated as described under “Segment Rate of Return” earlier in this Prospectus.
In setting the Performance Cap Rate that we use in calculating the Segment Maturity Value, we assume that you are going to hold a Segment until the Segment Maturity Date. However, you have the right to access amounts in the Segments before the Segment Maturity Date under certain circumstances. Therefore, we calculate a Segment Interim Value on each business day, which is also a Segment Business Day, between the Segment Start Date and the Segment Maturity Date. The method we use to calculate the Segment Interim Value is different than the method we use to calculate the value of the Segment on the Segment Maturity Date. Prior to the Segment Maturity Date, we use the Segment Interim Value to calculate (1) your account value; (2) the amount your beneficiary would receive as a death benefit; (3) the amount you would receive if you make a withdrawal or a loan from a Segment; (4) the amount you would receive if you surrender your EQUI-VEST
®
contract; or (5) the amount you would receive if you cancel your EQUI-VEST®
contract; and return it to us for a refund within your state’s “free look” period (unless your state requires that we refund the full amount of your contribution upon cancellation). The Segment Interim Value is calculated based on a formula that provides a treatment for an early distribution that is designed to be consistent with how distributions at the end of a Segment are treated. “Contract Adjustment — Segment Interim Value” in the Statement of Additional Information sets forth in detail the specific calculation formula as well as numerous hypothetical examples. The formula is calculated by adding the fair value of three components. These components provide us with a market value estimate of the risk of loss and the possibility of gain at the end of a Segment. As detailed in the “Contract Adjustment — Segment Interim Value” section in the Statement of Additional Information, these components are used to calculate the Segment Interim Value. The three components are:
| (1) | Fair value of fixed instruments is calculated as the present value of the Segment Investment (using a risk-free swap interest rate for the remaining duration of the Segment). We use this component because we are forgoing the opportunity to earn interest on the Segment Investment by having to make an early distribution. |
PLUS
(2) |
Fair value of derivatives is calculated by using the Black Scholes model, as described in “Contract Adjustment — Segment Interim Value” in the Statement of Additional Information, to value three hypothetical options (one put and two call options) on the index underlying the Segment. The put option is used to estimate the potential losses at Segment Maturity. The call options are used to estimate the potential gains at Segment Maturity. The value of these options also reflects the limits on positive performance (i.e., the Performance Cap Rate) and some protection against negative performance (i.e., the Segment Buffer). |
PLUS
| (3) | Cap calculation factor is a positive adjustment of the percentage of the estimated expenses corresponding to the portion of the Segment Duration that has not |
| elapsed. This component reflects the fact that an early withdrawal from a Segment means that we no longer have to incur expected expenses associated with administering the Segment for the full period. |
For all contracts with issue dates before June 24, 2024 and certain other contracts subject to state and other necessary approvals (see ”Performance Cap Rate limiting factor” in the Statement of Additional Information for a table showing which contracts still use a Performance Cap Rate limiting factor), we then compare the sum of the three components above with a limitation based on the Performance Cap Rate referred to as the Performance Cap Rate limiting factor. For these contracts, the Segment Interim Value is never greater than the Segment Investment multiplied by the portion of the Performance Cap Rate corresponding to the portion of the Segment Duration that has elapsed. This limitation is imposed to discourage owners from withdrawing from a Segment before the Segment Maturity Date where there may have been significant increases in the relevant Index early in the Segment Duration.
You could lose a significant amount of money due to the use of Segment Interim Values if amounts are removed from a Segment prior to the Segment Maturity Date. Even if the Index has experienced positive investment performance since the Segment Start Date, because of the factors we take into account in the calculation above, your Segment Interim Value may be lower than your Segment Investment.
Fixed Maturity Options
We offer fixed maturity options with maturity dates generally ranging from one to ten years. The minimum guaranteed rate of interest is 3%. We will not accept allocations to a fixed maturity option if on the date the contribution or transfer is to be applied the rate to maturity (e.g., the crediting rate) is 3%. This means that at points in time there may be no fixed maturity options available. You can allocate your contributions to one or more of these fixed maturity options. However, you may not allocate more than one contribution to any one fixed maturity option. These amounts become part of a non-unitized separate account. They will accumulate interest at the “rate to maturity” for each fixed maturity option. The total amount you allocate to and accumulate in each fixed maturity option is called the “fixed maturity amount.” The fixed maturity options may not be available in all or all states. See Appendix: “State contract availability and/or variations of certain features and benefits” for more information. See also “Charges, expenses, and adjustments” in this prospectus for information on withdrawal charges when amounts are allocated to the fixed maturity options.
The rate to maturity you will receive for each fixed maturity option is the rate to maturity in effect for new contributions allocated to that fixed maturity option on the date we apply your contribution.
On the maturity date of a fixed maturity option, your fixed maturity amount, assuming you have not made any withdrawals or transfers, will equal your contribution to that fixed maturity option plus interest, at the rate to maturity for that
contribution. This is the fixed maturity option’s “maturity value.” Before maturity, the current value we will report for your fixed maturity amount will reflect a market value adjustment. Your current value will reflect the market value adjustment that we would make if you were to withdraw all of your fixed maturity amounts on the date of the report. We call this your “market adjusted amount.”
Fixed maturity options and maturity dates.
If a fixed maturity option is scheduled to mature on June 15th and June 15th is a non-business day, that fixed maturity option will mature on the prior business day.
We will not accept allocations to a fixed maturity option if on the date the contribution is to be applied:
| • | you previously allocated a contribution or made a transfer to the same fixed maturity option; or |
| • | the rate to maturity is 3%; or |
| • | the fixed maturity option’s maturity date is within 45 days; or |
| • | the fixed maturity option’s maturity date is later than the date annuity payments are to begin. |
Contributions allocated to a fixed maturity option will receive the rate to maturity in effect for that fixed maturity option on that business day.
Your choices at the maturity date.
| (a) | transfer the maturity value into another available fixed maturity option, or into any of the variable investment options; or |
| (b) | withdraw the maturity value (there may be a withdrawal charge). |
The rates to maturity are determined weekly. Current rates to maturity for the fixed maturity options can be obtained from your financial professional or us. Please see “How to reach us” for detailed information on how to reach us.
If we do not receive your choice on or before the fixed maturity option’s maturity date, we will automatically transfer your maturity value into the next available fixed maturity option (or another investment option if we are required to do so by any state regulation). We may change our procedures in the future.
Market value adjustment.
maturity amount you have in that fixed maturity option. The amount of the adjustment will depend on two factors:
| (a) | the difference between the rate to maturity that applies to the amount being withdrawn and the rate to maturity in effect at that time for new allocations to that same fixed maturity option, and |
| (b) | the length of time remaining until the maturity date. |
In general, if interest rates rise from the time that you originally allocate an amount to a fixed maturity option to the time that you take a withdrawal, the market value adjustment will be negative. Likewise, if interest rates drop at the end of that time, the market value adjustment will be positive. Also, the amount of the market value adjustment, either up or down, will be greater the longer the time remaining until the fixed maturity option’s maturity date. Therefore, it is possible that the market value adjustment could greatly reduce your value in the fixed maturity options, particularly in the fixed maturity options with later maturity dates. You could lose a significant amount of money due to a market value adjustment if amounts are removed from a fixed maturity option prior to maturity.
Rates to maturity and price per $100 of maturity value
We can determine the amount required to be allocated to one or more fixed maturity options in order to produce
specified maturity values. For example, we can tell you how much you need to allocate per $100 of maturity value.
The rates to maturity are determined weekly. The rates in the table below are illustrative only and will most likely differ from the rates applicable at time of purchase. Current rates to maturity can be obtained from your financial professional or us. Please see “How to reach us” for detailed information on how to reach us.
The rates to maturity for new allocations and the related price per $100 of maturity value are as shown below:
Fixed Maturity Options with June 15th Maturity Date of Maturity Year |
Rate to Maturity as of February 15, 2026 |
Price Per $100 of Maturity Value | ||
2026 |
3.00% (2) |
$99.03 | ||
2027 |
3.00% (2) |
$96.15 | ||
2028 |
3.00% (2) |
$93.34 | ||
2029 |
3.00% (2) |
$90.63 | ||
2030 |
3.00% (2) |
$87.99 | ||
2031 |
3.00% (2) |
$85.43 | ||
2032 |
3.00% (2) |
$82.93 | ||
2033 (1) |
3.00% (2) |
$80.53 | ||
2034 (1) |
3.00% (2) |
$78.19 | ||
2035 (1) |
3.05% |
$75.57 |
(1) |
Not available in Oregon. |
| (2) | Since these rates to maturity are 3%, no amounts could have been allocated to these options. |
How we determine the market value adjustment
We use the following procedure to calculate the market value adjustment (up or down) we make if you withdraw all of your value from a fixed maturity option before its maturity date.
| (1) | We determine the market adjusted amount on the date of the withdrawal as follows: |
| (a) | We determine the fixed maturity amount that would be payable on the maturity date, using the rate to maturity for the fixed maturity option. |
| (b) | We determine the period remaining in your fixed maturity option (based on the withdrawal date) and convert it to fractional years based on a 365-day year. For example, three years and 12 days becomes 3.0329. |
| (c) | We determine the current rate to maturity that applies on the withdrawal date to new allocations to the same fixed maturity option. |
| (d) | We determine the present value of the fixed maturity amount payable at the maturity date, using the period determined in (b) and the rate determined in (c). |
| (2) | We determine the fixed maturity amount as of the current date. |
| (3) | We subtract (2) from the result in (1)(d). The result is the market value adjustment applicable to such fixed maturity option, which may be positive or negative. |
Your market adjusted amount is the present value of the maturity value discounted at the rate to maturity in effect for new contributions to that same fixed maturity option on the date of the calculation.
If you withdraw only a portion of the amount in a fixed maturity option, the market value adjustment will be a percentage of the market value adjustment that would have applied if you had withdrawn the entire value in that fixed maturity option. This percentage is equal to the percentage of the value in the fixed maturity option that you are withdrawing. Any withdrawal charges that are deducted from a fixed maturity option will result in a market value adjustment calculated in the same way. See “Calculation Examples” in the Statement of Additional Information for an example.
For purposes of calculating the rate to maturity for new allocations to a fixed maturity option (see (1)(c) above), we use the rate we have in effect for new allocations to that fixed maturity option. We use this rate even if new allocations to that option would not be accepted at that time. This rate will not be less than 3%. If we do not have a rate to maturity in effect for a fixed maturity option to which the “current rate to maturity” in (1)(c) above would apply, we will use the rate at the next closest maturity date. If we are no longer offering new fixed maturity options, the “current rate to maturity” will be determined in accordance with our procedures then in effect. We reserve the right to add up
to 0.50% to the current rate in (1)(c) above for purposes of calculating the market value adjustment only.
ERISA considerations for employers
If you are an employer and your plan is intended to comply with the requirements of the Employee Retirement Income Security Act of 1974 (“ERISA”) Section 404(c), you or your plan trustee must make sure that the investment options chosen for your plan constitute a broad range of investment choices as required by the Department of Labor’s (“DOL”) regulation under ERISA Section 404(c). See “Tax information” in this prospectus.
Allocating your contributions
Once you have made your investment method choice, you may allocate your contributions to one or more or all of the investment options that you have chosen, subject to any restrictions under the investment method you chose. However, you may not allocate more than one contribution to any one fixed maturity option. If the annuitant is age 76 or older, you may only allocate contributions to fixed maturity options with maturities of five years or less. Allocations must be in whole percentages and you may change your allocation percentages at any time. However, the total of your allocations must equal 100%. Additional contributions are allocated according to instructions on file unless you provide us with new instructions. Once your contributions are allocated to the investment options, they become a part of your account value. We discuss account value in “Determining your contract’s value” in this prospectus.
The contract is between you and the Company. The contract is not an investment advisory account, and the Company is not providing any investment advice or managing the allocation under your contract. In the absence of a specific written arrangement to the contrary, you, as the owner of the contract, have the sole authority to make investment allocations and other decisions under the contract. Your Equitable Advisors’ financial professional is acting as a broker-dealer registered representative, and is not authorized to act as an investment advisor or to manage the allocations under your contract. If your financial professional is a registered representative with a broker-dealer other than Equitable Advisors, your should speak with him/her regarding any different arrangements that may apply.
Your right to cancel within a certain number of days
If for any reason you are not satisfied with your contract, you may return it to us for a refund. To exercise this cancellation right you must mail the contract directly to our processing office within 10 days after you receive it. In some states, this “free look” period may be longer.
For contributions allocated to the variable investment options, your refund will equal your contributions, reflecting any investment gain or loss that also reflects the daily charges we deduct. For contributions allocated to the fixed maturity
options, your refund will equal the amount of the contribution allocated to fixed maturity options reflecting any positive or negative market value adjustments. Some states require that we refund the full amount of your contribution (not including any investment gain or loss, or interest or market value adjustment). For contributions allocated to the guaranteed interest option, your refund will equal the amount of the contributions, without interest. For contracts issued to fund SEPs, SARSEPs or SIMPLE IRAs that are returned to us within seven days after you receive it, we are required to refund the full amount of your contribution. When required by applicable law to return the full amount of your contribution, we will return the greater of your contribution or your contract’s cash value.
Please note that if you are invested in Segments of SIO when you free look your contract, the Segment Interim Value will apply. See “Structured Investment Option” in this section for more information.
We may require that you wait six months before you apply for a contract with us again if:
| • | you cancel your contract during the free look period; or |
| • | you change your mind before you receive your contract whether we have received your contribution or not. |
See Appendix: “State contract availability and/or variations of certain features and benefits” for any state variations.
In addition to the cancellation right described above, you have the right to surrender your contract, rather than cancel it. Surrendering your contract may yield results different than canceling your contract, including a greater potential for taxable income. In some cases, your cash value upon surrender may be greater than your contributions to the contract. Please see “Tax information” in this prospectus for possible consequences of cancelling your contract.
We may change the Indices and/or Segment
Options in the future but we will always offer a Segment Option with a Segment Buffer that protects the first 10% of loss.
The Segment Interim Value is calculated based on a formula that provides a treatment for an early distribution that is designed to be consistent with how distributions at the end of a Segment are treated. “Contract Adjustment — Segment Interim Value” in the Statement of Additional Information sets forth in detail the specific calculation formula as well as numerous hypothetical examples. The formula is calculated by adding the fair value of three components. These components provide us with a market value estimate of the risk of loss and the possibility of gain at the end of a Segment. As detailed in the “Contract Adjustment — Segment Interim Value” section in the Statement of Additional Information, these components are used to calculate the Segment Interim Value. The three components are:
| (1) | Fair value of fixed instruments is calculated as the present value of the Segment Investment (using a risk-free swap interest rate for the remaining duration of the Segment). We use this component because we are forgoing the opportunity to earn interest on the Segment Investment by having to make an early distribution. |
PLUS
(2) |
Fair value of derivatives is calculated by using the Black Scholes model, as described in “Contract Adjustment — Segment Interim Value” in the Statement of Additional Information, to value three hypothetical options (one put and two call options) on the index underlying the Segment. The put option is used to estimate the potential losses at Segment Maturity. The call options are used to estimate the potential gains at Segment Maturity. The value of these options also reflects the limits on positive performance (i.e., the Performance Cap Rate) and some protection against negative performance (i.e., the Segment Buffer). |
PLUS
| (3) | Cap calculation factor is a positive adjustment of the percentage of the estimated expenses corresponding to the portion of the Segment Duration that has not |
| elapsed. This component reflects the fact that an early withdrawal from a Segment means that we no longer have to incur expected expenses associated with administering the Segment for the full period. |
Index Performance Examples
The bar charts shown below provide each Index’s annual returns for the last 10 calendar years (or for the life of the Index if less than 10 years), as well as the Index returns after applying a hypothetical 5% cap and a hypothetical -10% buffer. The chart illustrates the variability of the returns from year to year and shows how hypothetical limits on Index gains and losses may affect these returns. Past performance is not necessarily an indication of future performance.
The performance below is NOT the performance of any Segment of the SIO. Your performance under the contract will differ, perhaps significantly. The performance below may reflect a different return calculation, time period, and limit on Index gains and losses than the Segments of the SIO, and does not reflect contract fees and charges, including withdrawal charges and negative Segment Interim Value adjustments, which reduce performance.
| * | The Index is a “price return” index, not a “total return” index, and therefore the performance of the Index does not reflect dividends declared by any of the companies included in the Index, reducing the Index return. As a result, the Index will underperform a direct investment in the securities composing the Index. |
Segment Type
Information regarding the features of each of the currently available Segment Types, including the Index name and type, the Segment Duration, the current Segment Buffer, and the minimum Performance Cap Rate for the life of the Segment Type, is available in an appendix to the prospectus. See Appendix “Investment Options available under the contract.”
We currently offer seven Segment Types. We intend to offer a Segment each month, on the Segment Start Date. We are not obligated to offer any one particular Segment Type. Also, we are not obligated to offer any Segment Type. A Segment Type refers to Segments that have the same Index, Segment Duration, and Segment Buffer. A Segment Type has a corresponding Segment Holding Account. Please refer to the “Definitions of key terms” section earlier in this Prospectus for a discussion of these terms. Not all Segment Durations are available in all states. Please see “Appendix: State contract availability and/or variations of certain features and benefits” for more information.
The following Segment Types are currently available:
Index |
Segment Duration |
Segment Buffer | ||
| S&P 500 Price Return Index | 1 year | -10% | ||
| S&P 500 Price Return Index | 3 year | -20% | ||
| S&P 500 Price Return Index | 5 year | -20% | ||
| Russell 2000 ® |
1 year | -10% | ||
| Russell 2000 ® |
3 year | -20% | ||
| Russell 2000 ® |
5 year | -20% | ||
| MSCI EAFE Price Return Index | 1 year | -10% |
At maturity, the highest level of protection is the -20% Segment Buffer and the lowest level of protection is the -10% Segment Buffer.
We may change the Indices and/or Segment Options in the future but we will always offer a Segment Option with a Segment Buffer that protects the first 10% of loss. In the future, we may offer other Segment Options that do not provide any downside protection which would mean there is a risk of loss of the entire amount invested.
The Indices are described in more detail below, under the heading “Indices.”
Each Segment has a Performance Cap Rate that we set on the Segment Start Date. See “Performance Cap Rate” below.
For example, a Segment could be S&P 500 Price Return Index/ 1 year/-10%/ September 2025 with a 20% Performance Cap Rate declared on the Segment Start Date. This means that you will participate in the performance of the S&P 500 Price Return Index for one year starting from the September 2025 Segment Start Date. If the Index performs positively during this period, your rate of return at maturity could be as much as 20% for that Segment Duration. If the Index performs negatively during this period, at maturity you will be protected from the first 10% of the Index’s decline. If the Index performance is between -10% and 0%, your Segment Return Amount at maturity will equal your Segment Investment.
Both the Performance Cap Rate and the Segment Buffer are rates of return from the Segment Start Date to the Segment Maturity Date.
®
contract, die or make a withdrawal from a Segment before the Segment Maturity Date, the Segment Buffer will not necessarily apply to the extent it would on the Segment Maturity Date, and any upside performance will be limited to a percentage lower than the Performance Cap Rate. Please see “Your account value in the Structured Investment Option” later in this section. A partial withdrawal from a Segment does not affect the Performance Cap Rate and Segment Buffer that apply to any remaining amounts that are held in the Segment through the Segment Maturity Date. Please see “Performance Cap Rate limiting factor” in “Contract Adjustment — Segment Interim Value” in the Statement of Additional Information for table(s) showing which contracts will no longer use a Performance Cap Rate limiting factor. We reserve the right to offer any or all Segments more or less frequently or to stop offering any of them (except we will always offer a Segment Option with a Segment Buffer that protects the first 10% of loss) or to suspend offering any or all of them temporarily for some or all contracts. Please see “Suspension, termination and changes to the Segment
Type and Index” later in this section. We may also add different Segment Types in the future.
You may not have more than 12 active Segments in addition to the Segment Holding Account.
®
contract at any time before the next month’s Segment Start Date.
Fixed Maturity Options
We offer fixed maturity options with maturity dates generally ranging from one to ten years. The minimum guaranteed rate of interest is 3%. We will not accept allocations to a fixed maturity option if on the date the contribution or transfer is to be applied the rate to maturity (e.g., the crediting rate) is 3%. This means that at points in time there may be no fixed maturity options available. You can allocate your contributions to one or more of these fixed maturity options. However, you may not allocate more than one contribution to any one fixed maturity option. These amounts become part of a non-unitized separate account. They will accumulate interest at the “rate to maturity” for each fixed maturity option. The total amount you allocate to and accumulate in each fixed maturity option is called the “fixed maturity amount.” The fixed maturity options may not be available in all or all states. See Appendix: “State contract availability and/or variations of certain features and benefits” for more information. See also “Charges, expenses, and adjustments” in this prospectus for information on withdrawal charges when amounts are allocated to the fixed maturity options.
The rate to maturity you will receive for each fixed maturity option is the rate to maturity in effect for new contributions allocated to that fixed maturity option on the date we apply your contribution.
On the maturity date of a fixed maturity option, your fixed maturity amount, assuming you have not made any withdrawals or transfers, will equal your contribution to that fixed maturity option plus interest, at the rate to maturity for that
contribution. This is the fixed maturity option’s “maturity value.” Before maturity, the current value we will report for your fixed maturity amount will reflect a market value adjustment. Your current value will reflect the market value adjustment that we would make if you were to withdraw all of your fixed maturity amounts on the date of the report. We call this your “market adjusted amount.”
Fixed maturity options and maturity dates.
If a fixed maturity option is scheduled to mature on June 15th and June 15th is a non-business day, that fixed maturity option will mature on the prior business day.
We will not accept allocations to a fixed maturity option if on the date the contribution is to be applied:
| • | you previously allocated a contribution or made a transfer to the same fixed maturity option; or |
| • | the rate to maturity is 3%; or |
| • | the fixed maturity option’s maturity date is within 45 days; or |
| • | the fixed maturity option’s maturity date is later than the date annuity payments are to begin. |
Contributions allocated to a fixed maturity option will receive the rate to maturity in effect for that fixed maturity option on that business day.
Your choices at the maturity date.
| (a) | transfer the maturity value into another available fixed maturity option, or into any of the variable investment options; or |
| (b) | withdraw the maturity value (there may be a withdrawal charge). |
The rates to maturity are determined weekly. Current rates to maturity for the fixed maturity options can be obtained from your financial professional or us. Please see “How to reach us” for detailed information on how to reach us.
If we do not receive your choice on or before the fixed maturity option’s maturity date, we will automatically transfer your maturity value into the next available fixed maturity option (or another investment option if we are required to do so by any state regulation). We may change our procedures in the future.
Market value adjustment.
maturity amount you have in that fixed maturity option. The amount of the adjustment will depend on two factors:
| (a) | the difference between the rate to maturity that applies to the amount being withdrawn and the rate to maturity in effect at that time for new allocations to that same fixed maturity option, and |
| (b) | the length of time remaining until the maturity date. |
In general, if interest rates rise from the time that you originally allocate an amount to a fixed maturity option to the time that you take a withdrawal, the market value adjustment will be negative. Likewise, if interest rates drop at the end of that time, the market value adjustment will be positive. Also, the amount of the market value adjustment, either up or down, will be greater the longer the time remaining until the fixed maturity option’s maturity date. Therefore, it is possible that the market value adjustment could greatly reduce your value in the fixed maturity options, particularly in the fixed maturity options with later maturity dates. You could lose a significant amount of money due to a market value adjustment if amounts are removed from a fixed maturity option prior to maturity.
Rates to maturity and price per $100 of maturity value
We can determine the amount required to be allocated to one or more fixed maturity options in order to produce
specified maturity values. For example, we can tell you how much you need to allocate per $100 of maturity value.
The rates to maturity are determined weekly. The rates in the table below are illustrative only and will most likely differ from the rates applicable at time of purchase. Current rates to maturity can be obtained from your financial professional or us. Please see “How to reach us” for detailed information on how to reach us.
The rates to maturity for new allocations and the related price per $100 of maturity value are as shown below:
Fixed Maturity Options with June 15th Maturity Date of Maturity Year |
Rate to Maturity as of February 15, 2026 |
Price Per $100 of Maturity Value | ||
2026 |
3.00% (2) |
$99.03 | ||
2027 |
3.00% (2) |
$96.15 | ||
2028 |
3.00% (2) |
$93.34 | ||
2029 |
3.00% (2) |
$90.63 | ||
2030 |
3.00% (2) |
$87.99 | ||
2031 |
3.00% (2) |
$85.43 | ||
2032 |
3.00% (2) |
$82.93 | ||
2033 (1) |
3.00% (2) |
$80.53 | ||
2034 (1) |
3.00% (2) |
$78.19 | ||
2035 (1) |
3.05% |
$75.57 |
(1) |
Not available in Oregon. |
| (2) | Since these rates to maturity are 3%, no amounts could have been allocated to these options. |
How we determine the market value adjustment
We use the following procedure to calculate the market value adjustment (up or down) we make if you withdraw all of your value from a fixed maturity option before its maturity date.
| (1) | We determine the market adjusted amount on the date of the withdrawal as follows: |
| (a) | We determine the fixed maturity amount that would be payable on the maturity date, using the rate to maturity for the fixed maturity option. |
| (b) | We determine the period remaining in your fixed maturity option (based on the withdrawal date) and convert it to fractional years based on a 365-day year. For example, three years and 12 days becomes 3.0329. |
| (c) | We determine the current rate to maturity that applies on the withdrawal date to new allocations to the same fixed maturity option. |
| (d) | We determine the present value of the fixed maturity amount payable at the maturity date, using the period determined in (b) and the rate determined in (c). |
| (2) | We determine the fixed maturity amount as of the current date. |
| (3) | We subtract (2) from the result in (1)(d). The result is the market value adjustment applicable to such fixed maturity option, which may be positive or negative. |
Your market adjusted amount is the present value of the maturity value discounted at the rate to maturity in effect for new contributions to that same fixed maturity option on the date of the calculation.
If you withdraw only a portion of the amount in a fixed maturity option, the market value adjustment will be a percentage of the market value adjustment that would have applied if you had withdrawn the entire value in that fixed maturity option. This percentage is equal to the percentage of the value in the fixed maturity option that you are withdrawing. Any withdrawal charges that are deducted from a fixed maturity option will result in a market value adjustment calculated in the same way. See “Calculation Examples” in the Statement of Additional Information for an example.
For purposes of calculating the rate to maturity for new allocations to a fixed maturity option (see (1)(c) above), we use the rate we have in effect for new allocations to that fixed maturity option. We use this rate even if new allocations to that option would not be accepted at that time. This rate will not be less than 3%. If we do not have a rate to maturity in effect for a fixed maturity option to which the “current rate to maturity” in (1)(c) above would apply, we will use the rate at the next closest maturity date. If we are no longer offering new fixed maturity options, the “current rate to maturity” will be determined in accordance with our procedures then in effect. We reserve the right to add up
| (a) | transfer the maturity value into another available fixed maturity option, or into any of the variable investment options; or |
| (b) | withdraw the maturity value (there may be a withdrawal charge). |
Adjustments
Segment Interim Values
We use the Segment Interim Values for your Segments of the SIO if you have an Interim Value Transaction. This amount may be less than the amount invested and may be less than the amount you would receive had you held the investment until maturity. The Segment Interim Value will generally be negatively affected by increases in the expected volatility of index prices, interest rate increases, and by poor market performance. All other factors being equal, the Segment Interim Value would be lower the earlier a withdrawal or surrender is made during a Segment. Also, for all contracts using a Performance Cap Rate limiting factor, participation in upside performance for early withdrawals is pro-rated based on the period those amounts were invested in a Segment. This means you participate to a lesser extent in upside performance the earlier you take a withdrawal. For more information, please see “Segment Interim Value” under “Structured Investment Option” under “Purchasing the Contract” in this prospectus and “Contract Adjustment -- Segment Interim Value” in the Statement of Additional Information.
If you make one of these transactions, because the end-of term downside protection provided by a Segment Buffer does not apply to the Segment Interim Value, it is theoretically possible that you could lose up to 100% of your investment and previously credited interest in certain extreme scenarios.
Withdrawals from a Segment prior to your Segment Maturity Date reduce the Segment Investment on a pro rata basis by the same proportion that the Segment Interim Value is reduced on the date of the withdrawal. We use the Segment Investment to determine your Segment Maturity Value. For more information about the Segment Interim Values, including examples illustrating the operation of the Segment Interim Values, please see the Statement of Additional Information.
The use of Segment Interim Values transfers risk from us to you to protect us from losses on our investments supporting the Segments if amounts are removed prematurely.
You can obtain the Segment Interim Values for the Segments in which you invest by calling (800) 628-6673. This value can fluctuate daily, and the current value quoted may
67
differ from the actual Segment Interim Values at the time of a transaction. Please see “How to reach us” for more information.
Market Value Adjustments
If you make any withdrawals (including transfers, surrender or termination of your contract, or when we make deductions for charges) from a fixed maturity option before it matures, we will make a market value adjustment, which will increase or decrease any fixed maturity amount you have in that fixed maturity option. The market value adjustment for amounts withdrawn from a fixed maturity option before maturity could result in up to a 100% loss of your investment in the fixed maturity option in extreme situations. The amount of the adjustment will depend on two factors:
| (a) | the difference between the rate to maturity that applies to the amount being withdrawn and the rate to maturity in effect at that time for new allocations to that same fixed maturity option, and |
| (b) | the length of time remaining until the maturity date. |
In general, if interest rates rise from the time that you originally allocate an amount to a fixed maturity option to the time that you take a withdrawal, the market value adjustment will be negative. Likewise, if interest rates drop at the end of that time, the market value adjustment will be positive. Also, the amount of the market value adjustment, either up or down, will be greater the longer the time remaining until the fixed maturity option’s maturity date. Therefore, it is possible that the market value adjustment could greatly reduce your value in the fixed maturity options, particularly in the fixed maturity options with later maturity dates. For more information about the market value adjustment, including examples illustrating the operation of the market value adjustment, please see the Statement of Additional Information.
The market value adjustment transfers risk from us to you to protect us from losses on our investments supporting the fixed maturity options if amounts are removed prematurely.
You can obtain the market value adjustment for the fixed maturity options in which you invest by calling (800) 628-6673. This value can fluctuate daily, and the current value quoted may differ from the actual market value adjustment at the time of a transaction. Please see “How to reach us” for more information.
2.
Benefits available under the contract Summary of Benefits
The following tables summarize important information about the benefits available under the contract.
Death Benefits
This death benefit is available during the accumulation phase:
Name of Benefit |
Purpose |
Standard/ Optional |
Annual Fee |
Brief Description of Restrictions/ Limitations | ||||||
Max |
Current | |||||||||
| Death Benefit | Guarantees beneficiaries will receive a benefit equal to at least your contributions less adjusted withdrawals and the amounts of any outstanding loans and accrued interest. | Standard | No Additional Charge |
• Withdrawals could significantly reduce or terminate benefit | ||||||
Other Benefits
These other benefits are available during the accumulation phase:
Name of Benefit |
Purpose |
Standard/ Optional |
Annual Fee |
Brief Description of Restrictions/ Limitations | ||||||
Max |
Current | |||||||||
Rebalancing Option I (1) andOption II (2) |
Periodically rebalance to your desired asset mix. | Optional | No Charge | • Not generally available with Dollar Cost Averaging | ||||||
| Dollar Cost Averaging | Transfer account value to selected investment options on a regular basis to potentially reduce the impact of market volatility. | Optional | No Charge | • Not generally available with Rebalancing | ||||||
| Investment Simplifier | Allows you to automatically transfer amounts from the guaranteed interest option to the variable investment options. | Optional | No Charge | • Not generally available with Rebalancing | ||||||
| Semester Strategies program (Series 100 and Series 200 TSA and EDC contracts only) | We offer access to account services through SWBC Investment Advisory Services LLC (“SWBC”), an unaffiliated third party. SWBC is an independent registered investment advisory firm that assists retirement plan participants with investment advisory services, including model portfolio services. | Optional | No Charge | • To participate in the Program, you are required to use the Maximum investment options choice method • Not available with Dollar Cost Averaging or Rebalancing | ||||||
| Participant Loans (Applicable to TSA, governmental employer EDC and Corporate Trusted contracts only) | Loans may be available to plan participants. | Optional | 2%; calculated as a percentage of the outstanding loan amount | • Not all employer plans will offer loans • Loans are subject to restrictions under federal tax laws and ERISA | ||||||
| (1) | Option I allows you to rebalance your account value among the variable investment options. |
| (2) | Option II allows you to rebalance your account value among the variable investment options and the guaranteed interest option. |
Death Benefits
There are no restrictions on which investment options you can invest in for the death benefits. The Segments and variable investment options may be conservative in nature and you may receive a higher rate of return from other investment options. If you are seeking more aggressive investment options the allowable investments may not be appropriate for you.
Payment of Death Benefit
Beneficiary designations are subject to the terms of your plan. You designate your beneficiary when you apply for your contract. You may change your beneficiary at any time while you are alive and while the contract is in force. The change will be effective as of the date the written request is executed, whether or not you are living on the date the change is received at our processing office. We are not responsible for any beneficiary change request that we do not receive. We will send you a written confirmation when we receive your request. Generally, the owner must be the beneficiary under tax exempt employer EDC plan contracts and the trustee must be the beneficiary under most Trusteed contracts. Such owner may substitute as the beneficiary under the contract the beneficiary under the employer’s plan after your death.
Death benefit
Your contract provides a death benefit. The death benefit is equal to the greater of (i) your account value (without adjustment for any otherwise applicable negative market value adjustment) and less any outstanding loan balance and accrued interest as of the date we receive satisfactory proof of death, any required instructions, information and forms necessary to effect payment and (ii) the “minimum death benefit.” The minimum death benefit is equal to your total contributions, adjusted for withdrawals and any withdrawal charges and any taxes that apply, less any outstanding loan balance and accrued interest. Amounts withdrawn from any Segment before the Segment Maturity Date to pay the death benefit will reflect the Segment Interim Value calculation. For more information, see “Adjustments with respect to early distributions from Segments” in “Charges, Expenses, and Adjustments” in this prospectus.
If your surviving spouse rolls the death benefit proceeds over into a contract issued by us, the death proceeds will remain invested in this contract until your spouse’s contract is issued and the amount of the death benefit will be calculated as of the date we receive all requirements necessary to issue your spouse’s new contract. The amount of the death benefit will be calculated to equal the greater of (i) your account value (without adjustment for any otherwise applicable negative market value adjustment), less any outstanding loan balance and accrued interest, as of the date that your spouse’s contract is issued, and (ii) the “minimum death benefit” as of the date of your death. This means that the death benefit proceeds could vary up or down, based on investment performance, until your spouse’s new contract is issued.
How withdrawals affect the minimum death benefit
Depending upon the contract series, the contract date, and the state where your contract is issued, each withdrawal you make will reduce the amount of your current minimum death benefit on a pro rata basis. Reduction on a pro rata basis means that
we calculate the percentage of your current account value that is being withdrawn (including the amount of any withdrawal charge deducted from the contract) and we reduce your current minimum death benefit by that same percentage. For example, if your account value is $30,000, and you withdraw $12,000 you have withdrawn 40% of your account value. If your minimum death benefit was $40,000 before the withdrawal, it would be reduced by $16,000 ($40,000 x .40) and your new minimum death benefit after the withdrawal would be $24,000 ($40,000-$16,000). As this example shows,
the pro rata reduction of the death benefit can be greater than the dollar amount of the withdrawal.
Check with your financial professional. Effect of the annuitant’s death
If the annuitant dies before the annuity payments begin, we will pay the death benefit to your beneficiary.
Generally, the death of the annuitant terminates the contract. However, if you are the owner and annuitant and your spouse is the sole primary beneficiary the contract can be continued as follows:
Successor owner and annuitant for SEP, SARSEP and SIMPLE IRAs (may not be available in all states).
If you are the owner and annuitant and your spouse is the sole primary beneficiary, your spouse may elect upon your death to continue the contract as the owner/annuitant and no death benefit is payable until the surviving spouse’s death. If your surviving spouse decides to continue the contract, as of the date we receive satisfactory proof of death, any required instructions, information and forms necessary to effect the successor owner/annuitant feature, we will increase the account value to equal your minimum death benefit, if such death benefit is greater than such account value. The increase in the account value will be allocated to the investment options according to the allocation percentages we have on file for your contract. Thereafter, for series 300 and 400 withdrawal charges will no longer apply to contributions made before your death. Withdrawal charges will apply if additional contributions are made. These additional contributions will be withdrawn only after all other amounts have been withdrawn. For series 100 and 200 contracts, withdrawal charges will no longer apply and additional contributions may no longer be made.
The determination of spousal status is made under applicable state law; however, in the event of a conflict between federal and state law, we follow federal rules.
Effect of your death on the Structured Investment Option
Once we have received notice of your death and until the death benefit is processed, we will not make any transfers from the Segment Holding Account to a Segment. Amounts in the Segment Holding Account will be defaulted into the EQ/Money Market variable investment option on the next scheduled Segment Maturity Date. If Segments mature, the Segment Maturity Value will be transferred to the EQ/Money Market variable investment option.
How death benefit payment is made
The Setting Every Community Up for Retirement Enhancement Act (“SECURE Act”) enacted at the end of 2019 has changed key aspects of post-death distributions from tax
qualified and tax favored contracts such as TSAs, SEP IRAs, SARSEP IRAs and SIMPLE IRAs. We may be required in certain cases to pay benefits faster under existing contracts.
We will pay the death benefit to the beneficiary in the form of the annuity payout option you have chosen, if the option is permitted under federal tax rules in effect after your death. If you have not chosen an annuity payout option as of the time of the annuitant’s death, the beneficiary will receive the death benefit in a single sum. However, subject to any exceptions in the contract, our rules and applicable federal income tax rules, the beneficiary may elect to apply the death benefit to one or more annuity payout options we offer at the time. See “Your annuity payout options” under “Accessing your money” in this prospectus. In some cases a beneficiary may be able to do a nonspousal direct rollover to a new inherited IRA of a death benefit from a qualified plan, 403(b) plan or governmental employer 457(b) plan.
If the beneficiary is a natural person (i.e., not an entity such as a corporation or a trust) and so elects, death benefit proceeds can be paid through the “Equitable Access Account,” which is a draft account that works in certain respects like an interest-bearing checking account. In that case, we will send the beneficiary a draftbook, and the beneficiary will have immediate access to the proceeds by writing a draft for all or part of the amount of the death benefit proceeds. The Company will retain the funds until a draft is presented for payment. Interest on the Equitable Access Account is earned from the date we establish the account until the account is closed by your beneficiary or by us if the account balance falls below the minimum balance requirement, which is currently $1,000. The Equitable Access Account is part of the Company’s general account and is subject to the claims of our creditors. We will receive any investment earnings during the period such amounts remain in the general account. The Equitable Access Account is not a bank account or a checking account and it is not insured by the FDIC. Funds held by insurance companies in the general account are guaranteed by the respective state guaranty association.
Beneficiary continuation option (For TSAs, SEPs, SARSEP and SIMPLE IRAs only) — May not be available in all states
Depending on the beneficiary, this option may be restricted or may no longer be available for deaths after December 31, 2019, due to the changes made by the SECURE Act. Upon your death under a TSA, SEP, SARSEP or SIMPLE IRA contract, your beneficiary may generally elect to keep the contract with your name on it and receive distributions under the contract instead of receiving the death benefit in a single sum. If the election is made, then as of the date we receive satisfactory proof of death, any required instructions, information and forms necessary to effect the beneficiary continuation option feature, we will increase the account value to equal the applicable death benefit if such death benefit is greater than such account value. The increase in account value will be allocated to the investment options according to the allocation percentages we have on file for your contract.
If eligible, your beneficiary can elect to receive payments over your beneficiary’s life expectancy (determined in the calendar year after your death and determined on a term certain basis).
This feature must be elected by September 30th of the year following the calendar year of your death and before any other inconsistent election is made. Beneficiaries who do not make a timely election will not be eligible for this option. These payments must begin no later than December 31st of the calendar year after the year of your death. For sole spousal beneficiaries, payments may begin by December 31st of the calendar year in which you would have reached the applicable RMD age (as described under “Tax Information” later in this prospectus), if such time is later. For deaths after December 31, 2019, only specified individuals who are “eligible designated beneficiaries” or “EDBs” may generally stretch post-death payments over the beneficiary’s life expectancy. See required minimum distributions after your death in this prospectus under Tax Information. Individual beneficiaries who do not have EDB status (including beneficiaries named by the original beneficiary to receive any remaining interest after the death of the original beneficiary) must take out any remaining interest in the IRA or plan within 10 years of the applicable death in accordance with federal tax rules. In the case of deceased participants under government employer sponsored plans, these new rules apply to deaths after December 31, 2021.
Under the beneficiary continuation option:
| • | The contract continues with your name on it for the benefit of your beneficiary. |
| • | This feature is only available if the beneficiary is an individual. Certain trusts with only individual beneficiaries will be treated as individuals for this purpose. |
| • | If there is more than one beneficiary, each beneficiary’s share will be separately accounted for. It will be distributed over the beneficiary’s own life expectancy, if payments over life expectancy are chosen by an eligible beneficiary. |
| • | The minimum amount that is required in order to elect the beneficiary continuation option is $5,000 for each beneficiary. |
| • | The beneficiary may make transfers among the investment options, but no additional contributions will be permitted. |
| • | Loans will no longer be available for TSA contracts. |
| • | Any death benefit provision (including the minimum death benefit provision) will no longer be in effect. |
| • | The beneficiary may choose at any time to withdraw all or a portion of the account value and no withdrawal charges will apply. |
| • | Any partial withdrawal must be at least $300. |
| • | Your beneficiary will have the right to name a beneficiary to receive any remaining interest in the contract. |
| • | Depending on the type of contract you own, upon the death of your beneficiary, the beneficiary he or she has named has the option to either continue taking required minimum distributions based on the remaining life expectancy of the deceased beneficiary or to receive any remaining interest in the contract in a lump sum. In certain cases, the subsequent beneficiary must withdraw any |
remaining amount within ten years of your death or your beneficiary’s death as applicable. See “Tax information” in this prospectus. |
The option elected will be processed when we receive satisfactory proof of death, any required instructions for the method of payment and any required information and forms necessary to effect payment.
The beneficiary continuation option may not be available in your state. Check with your financial professional or our processing office regarding availability in your state.
How the Structured Investment Option affects the Beneficiary continuation option
Under the Beneficiary continuation option, if you have any account value in a Segment or Segment Holding Account:
| • | The transfer restrictions on amounts in Segments prior to election of the beneficiary continuation option remain in place. Any amounts in Segments may not be transferred out of the Segments until their Segment Maturity Dates. The Segment Maturity Value may be reinvested in other investment options. However, if the beneficiary is subject to the “10-year rule,” amounts may not be invested in Segments with Segment Maturity Dates later than December 31st of the calendar year which contains the tenth anniversary of your death. |
| • | If there is more than one beneficiary, then as of the date we receive satisfactory proof of death, any required instructions, information and forms necessary to effect the beneficiary continuation option feature for the first beneficiary, all Segments will continue for each beneficiary. |
| • | An eligible designated beneficiary who chooses to receive annual payments over his life expectancy should consult his tax adviser about selecting Segments that provide sufficient liquidity to satisfy the payout requirements under this option. For more information, please see “Required minimum distributions” under “Tax Information” in this prospectus. |
Other Benefits
Investment simplifier
Our Investment simplifier program allows you to choose from two automatic options for transferring amounts from the guaranteed interest option to the variable investment options. The transfer options are the “fixed-dollar option” and the “interest sweep.” You may select one or the other, but not both. If you elect to use rebalancing option II (discussed below), you may not choose either of the investment simplifier options.
Fixed-dollar option.
Under this option you may elect to have a fixed-dollar amount transferred out of the guaranteed interest option and into the variable investment options of your choice on a monthly basis. You can specify the number of monthly transfers or instruct us to continue to make monthly transfers until all available amounts in the guaranteed interest option have been transferred out.
In order to elect the fixed-dollar option, you must have a minimum of $5,000 in the guaranteed interest option on the date we receive your election form at our processing office. You also must elect to transfer at least $50 per month. The fixed-dollar option is subject to the guaranteed interest option transfer limitation described above under “Transferring your account value.”
Interest sweep.
Under the interest sweep, we will make transfers on a monthly basis from amounts in the guaranteed interest option. The amount we will transfer will be the interest credited to amounts you have in the guaranteed interest option from the last business day of the prior month to the last business day of the current month. You must have at least $7,500 in the guaranteed interest option on the date we receive your election and on the last business day of each month thereafter to participate in the interest sweep option.
The fixed-dollar and interest sweep options are forms of dollar-cost averaging. Dollar-cost averaging allows you to gradually allocate amounts to the variable investment options by periodically transferring approximately the same dollar amount to the variable investment options you select. This will cause you to purchase more units if the unit’s value is low and fewer units if the unit’s value is high. Therefore, you may get a lower average cost per unit over the long term. This plan of investing, however, does not guarantee that you will earn a profit or be protected against losses.
When your participation in the investment simplifier will end.
Your participation in the investment simplifier will end:
| • | Under the fixed-dollar option, when either the number of designated monthly transfers have been completed or the amount you have available in the guaranteed interest option has been transferred out. |
| • | Under the interest sweep option, when the amount you have in the guaranteed interest option falls below $7,500 (determined on the last business day of the month) for two months in a row. |
| • | Under either option, on the date we receive at our processing office, your written request to cancel automatic transfers, or on the date your contract terminates. |
Rebalancing your account value
Our rebalancing program offers two options that you can use to automatically reallocate your account value. Option I permits reallocation among the variable investment options only and option II permits reallocation among the variable investment options and the guaranteed interest option. To enroll in the asset rebalancing program, you must notify us in writing by completing our asset rebalancing form, instructing us:
| (a) | in whole percentages only, the percentage you want invested in each variable investment option (and the guaranteed interest option, if applicable), and |
| (b) | how often you want the rebalancing to occur (quarterly, semiannually, or annually). |
While your rebalancing program is in effect, we will transfer amounts among each variable investment option (and the guaranteed interest option, if applicable), so that the percentage of your account value that you specify is
invested in each option at the end of each rebalancing date. Your entire account value in the variable investment options (and guaranteed interest option, if applicable) must be included in the rebalancing program. Currently, we permit rebalancing of up to 20 investment options. Transfer restrictions out of the guaranteed interest option may apply in accordance with the last two bullets under “Transferring your account value” above in this section. The initial transfer under the rebalancing program (based on your account value as of the day before the program is established) is not permitted to cause the transfer restrictions to be violated, and any rebalancing election that would be a violation of the transfer restrictions will not be put into effect. However, if the program can be established, once it is in effect, the transfer restrictions will be waived for the rebalancing transfers.
Rebalancing does not assure a profit or protect against loss. You should periodically review your allocation percentages as your needs change. You may want to discuss the rebalancing program with your financial professional before electing the program.
To be eligible, you must have (i) at least $5,000 of account value in the variable investment options for option I, or (ii) at least $5,000 of account value in the variable investment options and the guaranteed interest option, combined for option II. We may waive this $5,000 requirement. Rebalancing is not available for amounts you have allocated in the fixed maturity options.
If you elect to use option II, you may not choose either of the investment simplifier automatic options.
You may elect or terminate the rebalancing program at any time. You may also change your allocations under the program at any time. Once enrolled in the rebalancing program, it will remain in effect until you instruct us in writing to terminate the program. Requesting an investment option transfer while enrolled in our rebalancing program will not automatically change your allocation instructions for rebalancing your account value. This means that upon the next scheduled rebalancing, we will transfer amounts among your investment options pursuant to the allocation instructions previously on file for your program. Changes to your allocation instructions for the rebalancing program (or termination of your enrollment in the program) must be in writing and sent to our processing office.
For TSA, Corporate Trusteed and certain governmental employer EDC contracts with outstanding loans only,
on any rebalancing date where the amount to be transferred from the guaranteed interest option would cause a transfer from the Loan Reserve Account (which is part of the guaranteed interest option), the rebalancing program will be automatically cancelled. (See “Loans under TSA, governmental employer EDC and Corporate Trusteed contracts” in “Accessing your money” in this prospectus.) Optional Semester Strategies program (For Series 100 and Series 200 TSA and EDC contracts only)
The Company offers access to account services through SWBC Investment Advisory Services LLC (“SWBC”), an
unaffiliated third party. SWBC is an independent registered investment advisory firm that assists retirement plan participants with investment advisory services, including model portfolio services. If available under your employer’s plan, you may generally enroll in SWBC’s model portfolio and investment advisory services program (the “Program”) to manage your account value. The investment advisor will have an advisory relationship with contract owners who participate in the Program. The Program will allocate your account value among the variable investment options, guaranteed interest option and Segments in the Structured Investment Option based on your set time horizon, risk tolerance and investment return objectives derived by SWBC from information you provide to SWBC. For more information about the Structured Investment Option, please see the “Structured Investment Option” in “Purchasing the Contract”. To see if the Program is available in your state, please contact your financial professional and/or see Appendix “State contract availability and/or variations of certain features and benefits” in this prospectus. SWBC’s Form ADV is provided at enrollment and is also available upon request and on SWBC’s website.
SWBC will assign you to a specific Program model portfolio (“Model Portfolio”) based on two main criteria: time horizon and risk tolerance. First, they will determine the age you plan to retire (the “Planned Retirement Age”), which cannot be later than the maturity date under the contract and the Model Portfolio strategy you select. SWBC’s Programs generally offers Model Portfolios with five different time horizons, which are named accordingly:
| • | 16+ years to retirement |
| • | 11-15 years to retirement |
| • | 6-10 years to retirement |
| • | 1-5 years to retirement |
| • | Post-retirement |
You can generally change your Planned Retirement Age at any time by providing the new retirement age to SWBC.
Next, SWBC will consider your “risk tolerance”. Together, you will determine if you want more or less exposure to equities. The Program currently offers the above Model Portfolios using two different strategies. Based on your risk tolerance, you can choose:
| • | Semester Strategies has more exposure to equities. Semester Strategies allocates approximately 20% of your assets into multiple 1-year Standard Segments and the remaining assets into fixed income and equity variable investment options (shifting from more equities to more fixed income as you glide between models as you approach retirement). |
| • | Semester Strategies Plus has less exposure to equities. Semester Strategies Plus initially allocates a higher percentage of your assets into multiple 1-year Standard Segments than Semester Strategies (gradually increasing the allocation to 1-year Standard Segments) and the |
remaining assets into fixed income and equity variable investment options (shifting from more equities, but less than Semester Strategies, to more fixed income as you glide between models as you approach retirement). |
You can generally change from Semester Strategies to Semester Strategies Plus at any time. You cannot, however, move from Semester Strategies Plus to Semester Strategies.
The Model Portfolios may have limited investment options which may be more conservative than other investment options which may limit the upside potential for your contract. There is a risk of loss in all the Model Portfolios.
When you enroll in the Program, your allocation instructions for future contributions will be changed to the Model Portfolio you are assigned to by SWBC as of the date we process your enrollment request. In addition, your entire account value will be rebalanced or reallocated periodically according to the Model Portfolio’s allocations. Amounts in variable investment options, including the Segment Type Holding Accounts, and guaranteed interest options will be rebalanced according to the Model Portfolio’s allocations monthly, generally on the first Friday of every month (each a “Semester Strategies Rebalance Date”) and amounts in a Segment will be reallocated according to the Model Portfolio’s allocations when that Segment matures (each a “Semester Strategies Reallocation Date”). Amounts rebalanced or reallocated into new Segments will be placed in the applicable Segment Type Holding Accounts. Because of the difference in timing between Semester Strategies Rebalance Dates, Semester Strategies Reallocation Dates and amounts directed into Segments first being placed in Segment Type Holding Accounts, your actual allocations may vary from the Model Portfolio’s allocations at certain points in time if you have account value in Segments. If an investment option in a Model Portfolio terminates, liquidates, merges, or closes to new investors, SWBC will determine what course of action to take and will update the Model Portfolio’s allocations as necessary.
On an annual basis, the Program will determine if you will transition or “glide” from one Model Portfolio to the next Model Portfolio based on your birthdate and the number of years remaining until your Planned Retirement Age currently on file. If a glide is scheduled to occur, your allocation instructions for future contributions will be changed to the new Model Portfolio allocations. Your account value will be rebalanced and reallocated as applicable into the investment options according that new Model Portfolio’s allocations on the next Semester Strategies Rebalance Date and applicable Semester Strategies Reallocation Dates. You will receive notice of an upcoming glide. The automatic glide feature is part of the Program and cannot be modified. If you do not want to glide from the current Model Portfolio to the next Model Portfolio, you will have to change your Planned Retirement Age prior to your birthdate. Once you reach your Planned Retirement Age, you will glide to the post-retirement Model Portfolio for purposes of the Program and thereafter you will no longer glide to a different Model Portfolio as you continue to age.
SWBC will generally review the Model Portfolios on an annual basis and may review them more frequently based on market conditions. SWBC may also terminate a Model Portfolio and assign you to a new Model Portfolio. You will receive notice of any changes in the Model Portfolio allocations. You may decide to opt out of the changes by terminating your participation in the Program and becoming self-directed prior to your account value being rebalanced and reallocated as applicable according to the new Model Portfolio allocations. If you do not opt out, on the date of the proposed change your allocation instructions for future contributions will be changed to the Model Portfolio’s new allocations. Your account value will be rebalanced and reallocated as applicable into the investment options according to that Model Portfolio’s new allocations on the next Semester Strategies Rebalance Date and applicable Semester Strategies Reallocation Dates.
To participate in the Program, you are required to use the Maximum investment options choice method. If you elected the Maximum transfer flexibility method before enrolling in the Program, you will be switched to the Maximum investment options choice method when you enroll in the Program. In addition, when you enroll in the Program, any current automated transfer programs, including dollar cost averaging, and asset rebalancing, will be unavailable and/or terminate and you will not be able to establish any new program(s) while you participate. In addition, if you invested in the Structured Investment Option and specified a Performance Cap Threshold and/or provided Segment maturity instructions, those elections will be changed when you enroll in the Program. For more information about the Structured Investment Option, please see the “Structured Investment Option” in “Purchasing the Contract” in this prospectus.
When you enroll in the Program, we will pay SWBC’s advisory services fee on your behalf.
You may terminate the Program and become self-directed at any time by completing the necessary termination form or by contacting your financial professional. You can also terminate your participation in the Program by logging into your account at www.equitable.com or contacting one of our customer service representatives at (800)
628-6673.
If you request to change your future allocation instructions or make a transfer from one investment option to another, your participation in the Program will terminate and you will become self-directed. Once terminated, we reserve the right to not permit you to re-enroll
in the Program. If the Program terminates for any reason, you will be self-directed and, therefore, you will no longer receive model portfolio or investment advisory services from SWBC. If the Program terminates you will remain in your existing investment options until you provide us with new instructions. We can also terminate the Program at any time and for any reason. If we terminate the Program you will become self-directed. We do not provide investment advice. Please note that if you were switched from the Maximum transfer flexibility method to the Maximum investment options choice method when you enrolled in the Program you will not be automatically switched back to the Maximum transfer flexibility method if your participation in the Program terminates. Likewise, if any automated programs, a Performance Cap Threshold or Segment maturity instructions were terminated when you enrolled in the Program, those automated programs, Performance Cap Thresholds or special maturity instructions will not automatically resume; you will need to provide us with new instructions regarding which automated programs that you wish to
re-enroll
in, any Performance Cap Threshold you wish to set and any new Segment maturity instructions you want to use. Please note:
| • | Your Planned Retirement Age cannot be later than the maturity date under your contract. |
| • | If you have current investments in the Structured Investment Option, you may not be eligible to participate in the Program if your current Structured Investment Option allocations are higher than the Model Portfolio allocations to the Structured Investment Option would be based on the information you provided SWBC. |
| • | You cannot move from Semester Strategies Plus to Semester Strategies. |
| • | If you change your future allocations or transfer account value from one investment option to another, your participation in the Program will terminate and you will become self-directed. |
| • | When you enroll in the Program, you will not be able to establish a new automated rebalancing program and any current automated rebalancing program will terminate. |
| • | The Program will rebalance and reallocate your account value generally according to the Model Portfolio allocations; however, because of the difference in timing between Semester Strategies Rebalance Dates, Semester Strategies Reallocation Dates and amounts directed into Segments first being placed in Segment Type Holding Accounts, your actual allocations may vary from the Model Portfolio allocations at certain points in time if you have account value in Segments. |
For additional information or to enroll in the Program, contact your financial professional or one of our customer service representatives. The Program may not be available to all plans, all contracts, all certificates, in all states or through all financial intermediaries.
Summary of Benefits
The following tables summarize important information about the benefits available under the contract.
Death Benefits
This death benefit is available during the accumulation phase:
Name of Benefit |
Purpose |
Standard/ Optional |
Annual Fee |
Brief Description of Restrictions/ Limitations | ||||||
Max |
Current | |||||||||
| Death Benefit | Guarantees beneficiaries will receive a benefit equal to at least your contributions less adjusted withdrawals and the amounts of any outstanding loans and accrued interest. | Standard | No Additional Charge |
• Withdrawals could significantly reduce or terminate benefit | ||||||
Other Benefits
These other benefits are available during the accumulation phase:
Name of Benefit |
Purpose |
Standard/ Optional |
Annual Fee |
Brief Description of Restrictions/ Limitations | ||||||
Max |
Current | |||||||||
Rebalancing Option I (1) andOption II (2) |
Periodically rebalance to your desired asset mix. | Optional | No Charge | • Not generally available with Dollar Cost Averaging | ||||||
| Dollar Cost Averaging | Transfer account value to selected investment options on a regular basis to potentially reduce the impact of market volatility. | Optional | No Charge | • Not generally available with Rebalancing | ||||||
| Investment Simplifier | Allows you to automatically transfer amounts from the guaranteed interest option to the variable investment options. | Optional | No Charge | • Not generally available with Rebalancing | ||||||
| Semester Strategies program (Series 100 and Series 200 TSA and EDC contracts only) | We offer access to account services through SWBC Investment Advisory Services LLC (“SWBC”), an unaffiliated third party. SWBC is an independent registered investment advisory firm that assists retirement plan participants with investment advisory services, including model portfolio services. | Optional | No Charge | • To participate in the Program, you are required to use the Maximum investment options choice method • Not available with Dollar Cost Averaging or Rebalancing | ||||||
| Participant Loans (Applicable to TSA, governmental employer EDC and Corporate Trusted contracts only) | Loans may be available to plan participants. | Optional | 2%; calculated as a percentage of the outstanding loan amount | • Not all employer plans will offer loans • Loans are subject to restrictions under federal tax laws and ERISA | ||||||
| (1) | Option I allows you to rebalance your account value among the variable investment options. |
| (2) | Option II allows you to rebalance your account value among the variable investment options and the guaranteed interest option. |
Appendix: Investment options available under the contract
(a) Variable investment options
The following is a list of Portfolio Companies available under the contract. More information about the Portfolio Companies is available in the prospectuses for the Portfolio Companies, which may be amended from time to time and can be found online at www.equitable.com/ICSR#EQH146649. You can request this information at no cost by calling (877) 522-5035 or by sending an email request to EquitableFunds@dfinsolutions.com.
The current expenses and performance information below reflects fee and expenses of the Portfolios, but do not reflect the other fees and expenses that your contract may charge. Expenses would be higher and performance would be lower if these other charges were included. Each Portfolio’s past performance is not necessarily an indication of future performance.
Affiliated Portfolio Companies:
TYPE |
Portfolio Company — Investment Adviser; Sub-Adviser(s), as applicable |
Current Expenses |
Average Annual Total Returns (as of 12/31/2025) |
|||||||||||||||
1 year |
5 year |
10 year |
||||||||||||||||
Specialty |
1290 VT Convertible Securities — Equitable Investment Management Group, LLC (“EIMG”) ; SSGA Funds Management, Inc. |
0.90% |
^ |
15.79% |
2.91% |
8.89% |
||||||||||||
Equity |
1290 VT Equity Income — EIMG ; Barrow, Hanley, Mewhinney & Strauss, LLC d/b/a Barrow Hanley Global Investors |
0.95% |
^ |
13.04% |
11.25% |
8.85% |
||||||||||||
Specialty |
1290 VT GAMCO Mergers & Acquisitions — EIMG ; GAMCO Asset Management, Inc. |
1.29% |
^ |
15.91% |
7.70% |
5.38% |
||||||||||||
Equity |
1290 VT GAMCO Small Company Value — EIMG ; GAMCO Asset Management, Inc. |
1.05% |
12.82% |
11.24% |
10.77% |
|||||||||||||
Fixed Income |
1290 VT High Yield Bond — EIMG ; AXA Investment Managers US Inc., Post Advisory Group, LLC |
1.02% |
^ |
7.54% |
3.92% |
5.41% |
||||||||||||
Equity |
1290 VT Small Cap Value — EIMG ; BlackRock Investment Management, LLC, Horizon Kinetics Asset Management LLC |
1.23% |
^ |
6.11% |
13.44% |
11.19% |
||||||||||||
Equity |
1290 VT SmartBeta Equity ESG — EIMG ; AXA Investment Managers US Inc. |
1.10% |
13.95% |
10.21% |
10.74% |
|||||||||||||
Equity |
1290 VT Socially Responsible — EIMG ; BlackRock Investment Management, LLC |
0.90% |
17.23% |
13.04% |
13.83% |
|||||||||||||
Equity |
EQ/2000 Managed Volatility † — EIMG ; AllianceBernstein L.P., BlackRock Investment Management, LLC |
0.84% |
9.32% |
4.40% |
8.33% |
|||||||||||||
Equity |
EQ/400 Managed Volatility † — EIMG ; AllianceBernstein L.P., BlackRock Investment Management, LLC |
0.85% |
^ |
3.31% |
7.06% |
9.21% |
||||||||||||
Equity |
EQ/500 Managed Volatility † — EIMG ; AllianceBernstein L.P., BlackRock Investment Management, LLC |
0.80% |
13.33% |
12.43% |
13.15% |
|||||||||||||
Asset Allocation |
EQ/AB Dynamic Moderate Growth Δ — EIMG ; AllianceBernstein L.P. |
1.13% |
13.46% |
6.31% |
6.12% |
|||||||||||||
Equity |
EQ/AB Small Cap Growth — EIMG ; AllianceBernstein L.P. |
0.92% |
9.21% |
3.43% |
10.10% |
|||||||||||||
Asset Allocation |
EQ/Aggressive Allocation † — EIMG |
1.15% |
12.97% |
7.79% |
9.47% |
|||||||||||||
Asset Allocation |
EQ/Aggressive Growth Strategy † — EIMG |
1.01% |
12.17% |
7.61% |
9.04% |
|||||||||||||
Asset Allocation |
EQ/All Asset Growth Allocation — EIMG |
1.25% |
^ |
17.18% |
7.12% |
8.28% |
||||||||||||
Equity |
EQ/American Century Mid Cap Value — EIMG ; American Century Investment Management, Inc. |
1.00% |
^ |
8.72% |
8.64% |
— |
||||||||||||
Asset Allocation |
EQ/Balanced Strategy † — EIMG |
0.97% |
10.05% |
4.68% |
6.08% |
|||||||||||||
Equity |
EQ/Capital Group Research — EIMG ; Capital International, Inc. |
0.95% |
^ |
19.83% |
13.80% |
15.00% |
||||||||||||
Equity |
EQ/ClearBridge Large Cap Growth ESG — EIMG ; ClearBridge Investments, LLC |
1.00% |
^ |
7.69% |
10.47% |
13.63% |
||||||||||||
Equity |
EQ/ClearBridge Select Equity Managed Volatility † — EIMG ; BlackRock Investment Management, LLC, ClearBridge Investments, LLC |
1.06% |
^ |
7.66% |
8.42% |
12.21% |
||||||||||||
Equity |
EQ/Common Stock Index — EIMG ; AllianceBernstein L.P. |
0.67% |
^ |
16.30% |
12.50% |
13.54% |
||||||||||||
Asset Allocation |
EQ/Conservative Allocation † — EIMG |
1.00% |
^ |
7.48% |
1.74% |
3.11% |
||||||||||||
Asset Allocation |
EQ/Conservative Growth Strategy † — EIMG |
0.97% |
9.32% |
3.76% |
5.10% |
|||||||||||||
Asset Allocation |
EQ/Conservative Strategy † — EIMG |
0.95% |
7.86% |
1.93% |
3.12% |
|||||||||||||
Asset Allocation |
EQ/Conservative-Plus Allocation † — EIMG |
1.09% |
9.06% |
3.38% |
4.94% |
|||||||||||||
TYPE |
Portfolio Company — Investment Adviser; Sub-Adviser(s), as applicable |
Current Expenses |
Average Annual Total Returns (as of 12/31/2025) |
|||||||||||||||
1 year |
5 year |
10 year |
||||||||||||||||
Fixed Income |
EQ/Core Bond Index(1) — EIMG; SSGA Funds Management, Inc. |
0.62% |
^ |
6.43% |
0.35% |
1.70% |
||||||||||||
Fixed Income |
EQ/Core Plus Bond — EIMG; Brandywine Global Investment Management, LLC, Loomis, Sayles & Company, L.P. |
0.93% |
^ |
8.53% |
-0.74% |
2.16% |
||||||||||||
Equity |
EQ/Emerging Markets Equity PLUS — EIMG; AllianceBernstein L.P., EARNEST Partners, LLC |
1.20% |
^ |
33.46% |
4.64% |
7.73% |
||||||||||||
Equity |
EQ/Equity 500 Index — EIMG; AllianceBernstein L.P. |
0.53% |
^ |
17.24% |
13.79% |
14.16% |
||||||||||||
Equity |
EQ/Fidelity Institutional AM ® Large Cap — EIMG ; FIAM LLC |
0.87% |
^ |
18.34% |
13.86% |
— |
||||||||||||
Equity |
EQ/Franklin Small Cap Value Managed Volatility† — EIMG; BlackRock Investment Management, LLC, Franklin Mutual Advisers, LLC |
1.05% |
^ |
7.06% |
6.11% |
8.71% |
||||||||||||
Equity |
EQ/Global Equity Managed Volatility† — EIMG; BlackRock Investment Management, LLC |
1.08% |
^ |
19.14% |
8.33% |
9.47% |
||||||||||||
Equity |
EQ/Goldman Sachs Mid Cap Value — EIMG; Goldman Sachs Asset Management L.P. |
1.09% |
^ |
9.22% |
9.66% |
— |
||||||||||||
Fixed Income |
EQ/Intermediate Government Bond (1) — EIMG ; SSGA Funds Management, Inc. |
0.62% |
^ |
5.51% |
0.30% |
1.14% |
||||||||||||
Equity |
EQ/International Core Managed Volatility† — EIMG; BlackRock Investment Management, LLC |
1.06% |
26.12% |
7.52% |
7.48% |
|||||||||||||
Equity |
EQ/International Equity Index — EIMG; AllianceBernstein L.P. |
0.72% |
^ |
31.53% |
9.91% |
8.07% |
||||||||||||
Equity |
EQ/International Managed Volatility† — EIMG; AllianceBernstein L.P., BlackRock Investment Management, LLC |
0.86% |
25.90% |
7.28% |
6.92% |
|||||||||||||
Equity |
EQ/International Value Managed Volatility† — EIMG; BlackRock Investment Management, LLC, Harris Associates LP |
1.04% |
26.66% |
7.75% |
6.77% |
|||||||||||||
Equity |
EQ/Invesco Comstock — EIMG; Invesco Advisers, Inc. |
1.00% |
^ |
16.93% |
14.99% |
11.71% |
||||||||||||
Equity |
EQ/Invesco Global — EIMG; Invesco Advisers, Inc. |
1.10% |
^ |
15.40% |
6.95% |
10.59% |
||||||||||||
Specialty |
EQ/Invesco Global Real Assets — EIMG; Invesco Advisers, Inc. |
1.16% |
15.93% |
7.11% |
— |
|||||||||||||
Equity |
EQ/Janus Enterprise — EIMG; Janus Henderson Investors US LLC |
1.04% |
8.05% |
7.06% |
10.61% |
|||||||||||||
Equity |
EQ/JPMorgan Growth Stock — EIMG; J.P. Morgan Investment Management Inc. |
0.96% |
^ |
14.76% |
9.43% |
14.08% |
||||||||||||
Equity |
EQ/JPMorgan Value Opportunities — EIMG; J.P. Morgan Investment Management Inc. |
0.95% |
15.40% |
12.77% |
12.08% |
|||||||||||||
Equity |
EQ/Large Cap Core Managed Volatility† — EIMG; BlackRock Investment Management, LLC |
0.88% |
10.88% |
12.03% |
12.83% |
|||||||||||||
Equity |
EQ/Large Cap Growth Index — EIMG; AllianceBernstein L.P. |
0.71% |
17.74% |
14.51% |
17.26% |
|||||||||||||
Equity |
EQ/Large Cap Growth Managed Volatility† — EIMG; BlackRock Investment Management, LLC |
0.87% |
11.06% |
11.64% |
15.01% |
|||||||||||||
Equity |
EQ/Large Cap Value Index — EIMG; AllianceBernstein L.P. |
0.74% |
15.04% |
10.52% |
9.77% |
|||||||||||||
Equity |
EQ/Large Cap Value Managed Volatility† — EIMG; AllianceBernstein L.P. |
0.86% |
10.62% |
9.69% |
9.56% |
|||||||||||||
Equity |
EQ/Lazard Emerging Markets Equity — EIMG; Lazard Asset Management LLC |
1.35% |
^ |
42.06% |
10.84% |
— |
||||||||||||
Equity |
EQ/Loomis Sayles Growth — EIMG; Loomis, Sayles & Company, L.P. |
1.03% |
^ |
13.08% |
12.72% |
15.87% |
||||||||||||
Equity |
EQ/MFS International Growth — EIMG; Massachusetts Financial Services Company d/b/a MFS Investment Management |
1.10% |
^ |
20.90% |
6.90% |
9.61% |
||||||||||||
Equity |
EQ/MFS International Intrinsic Value — EIMG; Massachusetts Financial Services Company d/b/a MFS Investment Management |
1.15% |
^ |
32.95% |
6.99% |
— |
||||||||||||
Equity |
EQ/MFS Mid Cap Focused Growth — EIMG; Massachusetts Financial Services Company d/b/a MFS Investment Management |
1.10% |
^ |
5.60% |
5.09% |
— |
||||||||||||
Specialty |
EQ/MFS Technology — EIMG; Massachusetts Financial Services Company d/b/a MFS Investment Management |
1.10% |
16.24% |
12.06% |
— |
|||||||||||||
Specialty |
EQ/MFS Utilities Series — EIMG; Massachusetts Financial Services Company d/b/a MFS Investment Management |
1.05% |
^ |
14.65% |
7.33% |
— |
||||||||||||
Equity |
EQ/Mid Cap Index — EIMG; AllianceBernstein L.P. |
0.64% |
^ |
6.80% |
8.42% |
9.99% |
||||||||||||
Equity |
EQ/Mid Cap Value Managed Volatility† — EIMG; BlackRock Investment Management, LLC |
0.97% |
4.98% |
7.62% |
8.20% |
|||||||||||||
Asset Allocation |
EQ/Moderate Allocation† — EIMG |
1.08% |
10.20% |
4.12% |
5.77% |
|||||||||||||
Asset Allocation |
EQ/Moderate Growth Strategy† — EIMG |
0.98% |
10.83% |
5.67% |
7.08% |
|||||||||||||
Asset Allocation |
EQ/Moderate-Plus Allocation† — EIMG |
1.11% |
11.50% |
5.88% |
7.67% |
|||||||||||||
TYPE |
Portfolio Company — Investment Adviser; Sub-Adviser(s), as applicable |
Current Expenses |
Average Annual Total Returns (as of 12/31/2025) |
|||||||||||||||
1 year |
5 year |
10 year |
||||||||||||||||
Cash/Cash Equivalent |
EQ/Money Market* — EIMG; Dreyfus, a division of Mellon Investments Corporation |
0.67% |
3.66% |
2.79% |
1.73% |
|||||||||||||
Equity |
EQ/Morgan Stanley Small Cap Growth — EIMG; BlackRock Investment Management, LLC, Morgan Stanley Investment Management, Inc. |
1.15% |
^ |
7.39% |
-0.01% |
12.95% |
||||||||||||
Fixed Income |
EQ/PIMCO Global Real Return — EIMG; Pacific Investment Management Company LLC |
2.74% |
^ |
5.52% |
-0.90% |
2.48% |
||||||||||||
Fixed Income |
EQ/PIMCO Ultra Short Bond — EIMG; Pacific Investment Management Company LLC |
0.80% |
^ |
4.47% |
2.93% |
2.32% |
||||||||||||
Fixed Income |
EQ/Quality Bond PLUS — EIMG; AllianceBernstein L.P., Pacific Investment Management Company LLC |
0.83% |
6.29% |
-0.17% |
1.31% |
|||||||||||||
Equity |
EQ/Small Company Index — EIMG; AllianceBernstein L.P. |
0.63% |
12.57% |
6.16% |
9.44% |
|||||||||||||
Equity |
EQ/Value Equity — EIMG; Aristotle Capital Management, LLC |
0.91% |
11.01% |
8.65% |
8.47% |
|||||||||||||
Specialty |
EQ/Wellington Energy — EIMG; Wellington Management Company LLP |
1.19% |
^ |
12.17% |
17.90% |
— |
||||||||||||
Asset Allocation |
Equitable Conservative Growth MF/ETF Portfolio — EIMG |
1.10% |
^ |
12.03% |
4.95% |
6.85% |
||||||||||||
Asset Allocation |
Equitable Growth MF/ETF — EIMG |
1.15% |
^ |
14.37% |
— |
— |
||||||||||||
Asset Allocation |
Equitable Moderate Growth MF/ETF — EIMG |
1.10% |
^ |
13.43% |
— |
— |
||||||||||||
Equity |
Multimanager Aggressive Equity — EIMG; AllianceBernstein L.P. |
0.99% |
16.32% |
11.47% |
15.67% |
|||||||||||||
Fixed Income |
Multimanager Core Bond(1) — EIMG; BlackRock Financial Management, Inc., DoubleLine Capital LP, Pacific Investment Management Company LLC, SSGA Funds Management, Inc. |
0.93% |
^ |
7.11% |
-0.27% |
1.72% |
||||||||||||
Specialty |
Multimanager Technology — EIMG; AllianceBernstein L.P., FIAM LLC, Wellington Management Company LLP |
1.23% |
^ |
25.87% |
12.46% |
19.41% |
||||||||||||
Asset Allocation |
Target 2015 Allocation — EIMG |
1.10% |
^ |
9.41% |
2.84% |
5.08% |
||||||||||||
Asset Allocation |
Target 2025 Allocation — EIMG |
1.10% |
^ |
13.12% |
5.57% |
7.41% |
||||||||||||
Asset Allocation |
Target 2035 Allocation — EIMG |
1.05% |
15.70% |
7.50% |
8.95% |
|||||||||||||
Asset Allocation |
Target 2045 Allocation — EIMG |
1.03% |
16.81% |
8.58% |
9.86% |
|||||||||||||
Asset Allocation |
Target 2055 Allocation — EIMG |
1.10% |
^ |
17.90% |
9.51% |
10.81% |
||||||||||||
^ |
This Portfolio’s annual expenses reflect temporary fee reductions. |
Δ |
Certain other affiliated Portfolios, as well as unaffiliated Portfolios, may utilize volatility management techniques (including Fund of Fund Portfolios that invest in other Portfolios that utilize volatility management techniques) that differ from the EQ volatility management strategy. Affiliated Portfolios that utilize these volatility management techniques are identified in the chart by a “ Δ ”. Any such unaffiliated Portfolio is not identified in the chart. See “Portfolios of the Trusts” for more information regarding volatility management. |
† |
EQ Managed Volatility Portfolios that include the EQ volatility management strategy as part of their investment objective and/or principal investment strategy, and the EQ/affiliated Fund of Fund Portfolios that invest in Portfolios that use the EQ volatility management strategy, are identified in the chart by a “†“. See “Portfolios of the Trusts” for more information regarding volatility management. |
* |
The Portfolio operates as a “government money market fund.” The Portfolio will invest at least 99.5% of its total assets in U.S. government securities, cash, and/or repurchase agreements that are fully collateralized by U.S. government securities or cash. |
(1) |
Effective on or about June 29, 2026, and subject to shareholder approval, SSGA Funds Management, Inc. will be replaced as a sub-adviser to the Portfolio (or an allocated portion thereof) with AllianceBernstein L.P. |
Unaffiliated Portfolio Companies:
TYPE |
Portfolio Company — Investment Adviser; Sub-Adviser(s), as applicable |
Current Expenses |
Average Annual Total Returns (as of 12/31/2025) |
|||||||||||||||
1 year |
5 year |
10 year |
||||||||||||||||
Fixed Income |
American Funds Insurance Series ® The Bond Fund of America ® — Capital Research and Management Company |
0.72% |
^ |
6.98% |
-0.38% |
2.11% |
||||||||||||
Fixed Income |
Fidelity ® VIP Investment Grade Bond Portfolio — Fidelity Management and Research Company (FMR) |
0.62% |
6.93% |
-0.21% |
2.45% |
|||||||||||||
Equity |
MFS ® Massachusetts Investors Growth Stock Portfolio — Massachusetts Financial Services Company |
0.97% |
^ |
9.61% |
9.74% |
13.98% |
||||||||||||
Fixed Income |
Nomura VIP High Income Series — Delaware Management Company ; Nomura Corporate Research and Asset Management Inc. |
0.97% |
7.17% |
3.73% |
5.56% |
|||||||||||||
Specialty |
VanEck VIP Global Resources Fund — Van Eck Associates Corporation |
1.32% |
36.17% |
10.24% |
8.06% |
|||||||||||||
^ |
This Portfolio’s annual expenses reflect temporary fee reductions. |
(b) Index-Linked Options
The following is a list of Segments of the Structured Investment Option (SIO) currently available under the contract. We may change the features of the Segments listed below (including the Index and current limits on Index gains and losses), offer new Segments, and terminate existing Segments. We will provide you with written notice before making any changes other than changes to current limits on Index gains. Information about current limits on Index gains is available at https://equitable.com/equivestsio. See “Structured Investment Option” in “Purchasing the contract” for additional information about the Indices, the Segment Rate of Return calculation methods, and the operation of the Segment Buffer and Performance Cap Rate.
Note: If amounts are removed from a Segment of the SIO before the Segment Maturity Date, we will apply a Contract adjustment based on the Segment Interim Value. This may result in a significant reduction in your account value that could exceed any protection from Index loss that would be in place if you held the option until the Segment Maturity Date.
Index 1 |
Type of Index |
Segment Duration |
Segment Rate of Return Calculation Method |
Current Limit on Index Loss (if held until Segment Maturity Date) |
Minimum Limit on Index Gain for the life of the Segment Type (Performance Cap Rate) | |||||
S&P 500 Price Return Index |
Market Index |
1 year |
Standard |
-10% Segment Buffer |
4% 2 | |||||
S&P 500 Price Return Index |
Market Index |
3 year |
Standard |
-20% Segment Buffer |
12% | |||||
S&P 500 Price Return Index |
Market Index |
5 year |
Standard |
-20% Segment Buffer |
20% | |||||
Russell 2000 ® |
Market Index |
1 year |
Standard |
-10% Segment Buffer |
4% 2 | |||||
Russell 2000 ® |
Market Index |
3 year |
Standard |
-20% Segment Buffer |
12% | |||||
Russell 2000 ® |
Market Index |
5 year |
Standard |
-20% Segment Buffer |
20% | |||||
MSCI EAFE Price Return Index |
Market Index |
1 year |
Standard |
-10% Segment Buffer |
4% 2 |
| 1 | Each reference Index is a “price return index,” not a “total return index,” and therefore does not reflect dividends paid on the securities composing the Index. This will reduce the Index return and cause the Index to underperform a direct investment in the securities composing the Index. |
2 |
5% in the State of New York. |
We may change the Indices and/or Segment Options, but we will always offer a Segment Option with a Segment Buffer that protects the first 10% of loss. In the future, we may offer other Segment Options that do not provide any downside protection which would mean there is a risk of loss of the entire amount invested. Our minimum Performance Cap Rate for 5 year Standard Segment Types is 20% (12% for 3 year Segments and 4% for 1 year Segments). We will not open a Segment with a Performance Cap Rate below the applicable minimum rate. See Appendix: “State contract availability and/or variations of certain features and benefits” for more information on state variations.
(c) Fixed investment options
The following is a list of Fixed investment options currently available under the contract. We may change the features of the Fixed investment options listed below, offer new Fixed investment options, and terminate existing Fixed investment options. We will provide you with written notice before doing so.
Note: If amounts are removed from a Fixed investment option before the end of its term, we may apply a market value adjustment. This may result in a significant reduction in your account value.
Name |
Term |
Minimum Guaranteed Rate of Interest | ||
| Guaranteed Interest Option | N/A | 1.0% | ||
| Fixed Maturity Options | 1 year to 10 years | 3.0% | ||
| Dollar Cost Averaging | N/A | N/A |
For more information, please see “Fixed Maturity Options” under “Purchasing the Contract” and “Market Value Adjustment” under “Charges, Fees, and Adjustments” in this prospectus.
Investment Options: The following are Investment Options A and B, as referred to in the “Selecting your investment
method” section in “Purchasing the contract” in this prospectus.
Investments Options A | ||
Guaranteed Interest Option | ||
1290 VT Equity Income |
EQ/Invesco Global | |
1290 VT GAMCO Mergers & Acquisitions |
EQ/Invesco Global Real Assets | |
1290 VT GAMCO Small Company Value |
EQ/Janus Enterprise | |
1290 VT Small Cap Value |
EQ/JPMorgan Value Opportunities | |
1290 VT SmartBeta Equity ESG |
EQ/Large Cap Core Managed Volatility | |
1290 VT Socially Responsible |
EQ/Large Cap Growth Index | |
EQ/2000 Managed Volatility |
EQ/Large Cap Growth Managed Volatility | |
EQ/400 Managed Volatility |
EQ/Large Cap Value Index | |
EQ/500 Managed Volatility |
EQ/Large Cap Value Managed Volatility | |
EQ/AB Dynamic Moderate Growth |
EQ/Lazard Emerging Markets Equity | |
EQ/AB Small Cap Growth |
EQ/Loomis Sayles Growth | |
EQ/Aggressive Growth Strategy |
EQ/MFS International Growth | |
EQ/All Asset Growth Allocation |
EQ/MFS International Intrinsic Value | |
EQ/American Century Mid Cap Value |
EQ/MFS Mid Cap Focused Growth | |
EQ/Balanced Strategy |
EQ/MFS Technology | |
EQ/Capital Group Research |
EQ/MFS Utilities Series | |
EQ/ClearBridge Large Cap Growth ESG |
EQ/Mid Cap Index | |
EQ/ClearBridge Select Equity Managed Volatility |
EQ/Mid Cap Value Managed Volatility | |
EQ/Common Stock Index |
EQ/Moderate Growth Strategy | |
EQ/Conservative Growth Strategy |
EQ/Morgan Stanley Small Cap Growth | |
EQ/Conservative Strategy |
EQ/Small Company Index | |
EQ/Emerging Markets Equity PLUS |
EQ/T. Rowe Price Growth Stock | |
EQ/Equity 500 Index |
EQ/Value Equity | |
EQ/Fidelity Institutional AM ® |
EQ/Wellington Energy | |
EQ/Franklin Small Cap Value Managed Volatility |
Equitable Conservative Growth MF/ETF | |
EQ/Global Equity Managed Volatility |
Equitable Growth MF/ETF | |
EQ/Goldman Sachs Mid Cap Value |
Equitable Moderate Growth MF/ETF | |
EQ/International Core Managed Volatility |
MFS ® | |
EQ/International Equity Index |
Multimanager Aggressive Equity | |
EQ/International Managed Volatility |
Multimanager Technology | |
EQ/International Value Managed Volatility |
VanEck VIP Global Resources Fund | |
EQ/Invesco Comstock |
||
Investments Options B | ||
1290 VT Convertible Securities |
EQ/PIMCO Global Real Return | |
1290 VT High Yield Bond |
EQ/PIMCO Ultra Short Bond | |
American Funds Insurance Series ® ® |
EQ/Quality Bond PLUS | |
EQ/Core Bond Index |
Fidelity ® | |
EQ/Intermediate Government Bond |
Multimanager Core Bond | |
EQ/Money Market |
Nomura VIP High Income Series | |
101
(b) Index-Linked Options
The following is a list of Segments of the Structured Investment Option (SIO) currently available under the contract. We may change the features of the Segments listed below (including the Index and current limits on Index gains and losses), offer new Segments, and terminate existing Segments. We will provide you with written notice before making any changes other than changes to current limits on Index gains. Information about current limits on Index gains is available at https://equitable.com/equivestsio. See “Structured Investment Option” in “Purchasing the contract” for additional information about the Indices, the Segment Rate of Return calculation methods, and the operation of the Segment Buffer and Performance Cap Rate.
Note: If amounts are removed from a Segment of the SIO before the Segment Maturity Date, we will apply a Contract adjustment based on the Segment Interim Value. This may result in a significant reduction in your account value that could exceed any protection from Index loss that would be in place if you held the option until the Segment Maturity Date.
Index 1 |
Type of Index |
Segment Duration |
Segment Rate of Return Calculation Method |
Current Limit on Index Loss (if held until Segment Maturity Date) |
Minimum Limit on Index Gain for the life of the Segment Type (Performance Cap Rate) | |||||
S&P 500 Price Return Index |
Market Index |
1 year |
Standard |
-10% Segment Buffer |
4% 2 | |||||
S&P 500 Price Return Index |
Market Index |
3 year |
Standard |
-20% Segment Buffer |
12% | |||||
S&P 500 Price Return Index |
Market Index |
5 year |
Standard |
-20% Segment Buffer |
20% | |||||
Russell 2000 ® |
Market Index |
1 year |
Standard |
-10% Segment Buffer |
4% 2 | |||||
Russell 2000 ® |
Market Index |
3 year |
Standard |
-20% Segment Buffer |
12% | |||||
Russell 2000 ® |
Market Index |
5 year |
Standard |
-20% Segment Buffer |
20% | |||||
MSCI EAFE Price Return Index |
Market Index |
1 year |
Standard |
-10% Segment Buffer |
4% 2 |
ITEM 31A. Information about Contracts with Index-Linked Options and Fixed Options Subject to a Contract Adjustment.
| (a) | For any Contract with Index-Linked Options and/or Fixed Options subject to a Contract Adjustment offered through this registration statement, provide the information required by the following table as of December 31 of the prior calendar year. |
Name of the Contract |
Number of Contracts outstanding |
Total value attributable to the Index- Linked Option and/or Fixed Option subject to a Contract Adjustment |
Number of Contracts sold during the prior calendar year |
Gross premiums received during the prior calendar year |
Amount of Contract value redemmed during the prior year |
Combination Contract (Yes/No) |
||||||||||||||||||
EQUI-VEST (Employer-Sponsored Retirement Plans) |
19,456 | $ | 2,961 | 0 | $ | 4,394,610 | $ | 116,330,335 | Yes | |||||||||||||||
EQUI-VEST (Series 100-500) |
13,858 | $ | 2,098,190 | 0 | $ | 34,419,972 | $ | 61,043,124 | Yes | |||||||||||||||
| (b) | See Exhibit (27)(r) Historical Current Limits on Index Gains. |
1290 VT Convertible Securities
Equitable Investment Management Group, LLC (“EIMG”)
SSGA Funds Management, Inc.
1290 VT Equity Income
EIMG
Barrow, Hanley, Mewhinney & Strauss, LLC d/b/a Barrow Hanley Global Investors
1290 VT GAMCO Mergers & Acquisitions
EIMG
GAMCO Asset Management, Inc.
1290 VT GAMCO Small Company Value
EIMG
GAMCO Asset Management, Inc.
1290 VT High Yield Bond
EIMG
AXA Investment Managers US Inc., Post Advisory Group, LLC
1290 VT Small Cap Value
EIMG
BlackRock Investment Management, LLC, Horizon Kinetics Asset Management LLC
1290 VT SmartBeta Equity ESG
EIMG
AXA Investment Managers US Inc.
1290 VT Socially Responsible
EIMG
BlackRock Investment Management, LLC
EQ/2000 Managed Volatility
EIMG
AllianceBernstein L.P., BlackRock Investment Management, LLC
EQ/400 Managed Volatility
EIMG
AllianceBernstein L.P., BlackRock Investment Management, LLC
EQ/500 Managed Volatility
EIMG
AllianceBernstein L.P., BlackRock Investment Management, LLC
EQ/AB Dynamic Moderate Growth
EIMG
AllianceBernstein L.P.
EQ/AB Small Cap Growth
EIMG
AllianceBernstein L.P.
EQ/Aggressive Allocation
EIMG
EQ/Aggressive Growth Strategy
EIMG
EQ/All Asset Growth Allocation
EIMG
EQ/American Century Mid Cap Value
EIMG
American Century Investment Management, Inc.
EQ/Balanced Strategy
EIMG
EQ/Capital Group Research
EIMG
Capital International, Inc.
EQ/ClearBridge Large Cap Growth ESG
EIMG
ClearBridge Investments, LLC
EQ/ClearBridge Select Equity Managed Volatility
EIMG
BlackRock Investment Management, LLC, ClearBridge Investments, LLC
EQ/Common Stock Index
EIMG
AllianceBernstein L.P.
EQ/Conservative Allocation
EIMG
EQ/Conservative Growth Strategy
EIMG
EQ/Conservative Strategy
EIMG
EQ/Conservative-Plus Allocation
EIMG
SSGA Funds Management, Inc.
Brandywine Global Investment Management, LLC, Loomis, Sayles & Company, L.P.
AllianceBernstein L.P., EARNEST Partners, LLC
AllianceBernstein L.P.
EQ/Fidelity Institutional AM
®
Large Cap
EIMG
FIAM LLC
BlackRock Investment Management, LLC, Franklin Mutual Advisers, LLC
BlackRock Investment Management, LLC
Goldman Sachs Asset Management L.P.
EQ/Intermediate Government Bond
EIMG
SSGA Funds Management, Inc.
BlackRock Investment Management, LLC
AllianceBernstein L.P.
AllianceBernstein L.P., BlackRock Investment Management, LLC
BlackRock Investment Management, LLC, Harris Associates LP
Invesco Advisers, Inc.
Invesco Advisers, Inc.
Invesco Advisers, Inc.
Janus Henderson Investors US LLC
J.P. Morgan Investment Management Inc.
J.P. Morgan Investment Management Inc.
BlackRock Investment Management, LLC
AllianceBernstein L.P.
BlackRock Investment Management, LLC
AllianceBernstein L.P.
AllianceBernstein L.P.
Lazard Asset Management LLC
Loomis, Sayles & Company, L.P.
Massachusetts Financial Services Company d/b/a MFS Investment Management
Massachusetts Financial Services Company d/b/a MFS Investment Management
Massachusetts Financial Services Company d/b/a MFS Investment Management
Massachusetts Financial Services Company d/b/a MFS Investment Management
Massachusetts Financial Services Company d/b/a MFS Investment Management
AllianceBernstein L.P.
BlackRock Investment Management, LLC
Dreyfus, a division of Mellon Investments Corporation
BlackRock Investment Management, LLC, Morgan Stanley Investment Management, Inc.
Pacific Investment Management Company LLC
Pacific Investment Management Company LLC
AllianceBernstein L.P., Pacific Investment Management Company LLC
AllianceBernstein L.P.
Aristotle Capital Management, LLC
Wellington Management Company LLP
AllianceBernstein L.P.
BlackRock Financial Management, Inc., DoubleLine Capital LP, Pacific Investment Management Company LLC, SSGA Funds Management, Inc.
AllianceBernstein L.P., FIAM LLC, Wellington Management Company LLP
American Funds Insurance Series
®
The Bond Fund of America
®
Capital Research and Management Company
Fidelity
®
VIP Investment Grade Bond Portfolio
Fidelity Management and Research Company (FMR)
MFS
®
Massachusetts Investors Growth Stock Portfolio
Massachusetts Financial Services Company
Nomura VIP High Income Series
Delaware Management Company
Nomura Corporate Research and Asset Management Inc.
VanEck VIP Global Resources Fund
Van Eck Associates Corporation
•
Withdrawals could significantly reduce or terminate benefit
•
Not generally available with Dollar Cost Averaging
•
To participate in the Program, you are required to use the Maximum investment options choice method
•
Not available with Dollar Cost Averaging or Rebalancing
•
Not all employer plans will offer loans
•
Loans are subject to restrictions under federal tax laws and ERISA
•
Not generally available with Rebalancing
•
Not generally available with Rebalancing
67
.
| (a) | the difference between the rate to maturity that applies to the amount being withdrawn and the rate to maturity in effect at that time for new allocations to that same fixed maturity option, and |
| (b) | the length of time remaining until the maturity date. |
Yes.
The return on the Segments of the SIO may be negative and there is a risk of substantial loss of your principal and previously credited interest due to negative index performance because you agree to absorb all losses to the extent they exceed the Segment Buffer.
You could lose as much as 80% (for Segments with a -20% Segment Buffer) to 90% (for Segments with a -10% Segment Buffer) of
your principal and previously credited interest due to negative index performance at Segment maturity, depending on the Segment Buffer applicable to the Segment in which you invest.
We may change the Indices and/or Segment Options in the future but we will always offer a Segment Option with a Segment Buffer that protects the first 10% of loss. In the future, we may offer other Segment Options that do not provide any downside protection which would mean there is a risk of loss of the entire amount invested.
For additional information about the risk of loss see “Principal risks of investing in the contract” in this prospectus.
Risk of loss
All investments have risks to some degree and it is possible that you could lose money by investing in the contract. An investment in the contract is not a deposit with a bank and is not insured or guaranteed by the Federal Deposit Insurance Corporation or any other government agency.
No.
®
For additional information about the investment profile of the contract see “Fee table” in this prospectus.
An investment in the contract is subject to the risk of poor investment performance and can vary depending on the performance of the investment options available under the contract, (e.g., the Portfolios) or Segment of the SIO. Each investment option, including the guaranteed interest option and fixed maturity options, has its own unique risks. You should review the investment options before making an investment decision.
For investments in a Segment of the SIO, the Performance Cap Rate will limit positive Index performance (e.g., limited upside). For example, if the Index Performance Rate is 10% and the Performance Cap Rate is 7%, we will credit 7% on the Segment Maturity Date assuming there are no fees or charges assessed.
This may result in you earning less than the Index Return.
The Segment Buffer will limit negative returns (e.g., limited protection in the case of market decline). The Segment Buffer is the maximum amount of negative interest we will assume and we will credit any negative interest in excess of the Segment Buffer which means you bear all loss that exceeds the Segment Buffer. For example, if the Index Performance Rate is -25% and the Segment Buffer is -10%, we will credit -15% on the Segment Maturity Date assuming there are no fees or charges assessed.
Each Index is a “price return index,” not a “total return index,” and therefore does not reflect dividends paid on the securities composing the Index. This will reduce the Index return and will cause the Index to underperform a direct investment in the securities composing the Index.
For additional information about the risks associated with investment options see “Fixed investment options”, “Guaranteed interest option” and “Portfolios of the Trusts” in “Purchasing the contract” in the prospectus, as well as, “Risks associated with the variable investment options”, “Risks associated with the Structured Investment Option,” and “Risks associated with the fixed maturity options” in “Principal Risks of investing in the contract.” See also Appendix: “Investment options available under the contract” in this prospectus.
Risks associated with variable investment options
You take all the investment risk for amounts allocated to one or more of the subaccounts, which invest in Portfolios. If the subaccounts you select increase in value, then your account value goes up; if they decrease in value, your account value goes down. How much your account value goes up or down depends on the performance of the Portfolios in which your subaccounts invest. We do not guarantee the investment results of any Portfolio. An investment in the contract is subject to the risk of poor investment performance, and the value of your investment can vary depending on the performance of the selected Portfolio(s), each of which has its own unique risks. You should review the Portfolios before making an investment decision.
An investment in the contract is subject to the risks related to the Company. The Company is solely responsible to the contract owner for the contract’s account value and the optional benefits. The general obligations, including the guaranteed interest option, fixed maturity options, SIO, and any optional benefits under the contract are supported by our general account and are subject to our claims paying ability. An owner should look solely to our financial strength for our claims-paying ability. More information about the Company, including our financial strength ratings, may be obtained at www.equitable.com/about-us/financial-strength-ratings.
For additional information about insurance company risks see “About the general account” in “More information” in this prospectus.
Insurance company risk
No company other than us has any legal responsibility to pay amounts that we owe under the contract including amounts allocated to the SIO and fixed maturity options. The general obligations and any Guaranteed benefits under the contract are supported by our general account and are subject to our claims paying ability. You should look solely to our financial strength for our claims-paying ability.
Contract Changes Risk
We may, at any time, exercise our rights to limit or terminate your contributions, allocations and transfers to any of the variable investment options. We reserve the right, subject to compliance with laws that apply, to remove variable investment options from the Separate Account, to combine any two or more variable investment options, to restrict or eliminate any voting rights as to the Separate Account, to limit or terminate contributions or transfers into any of the variable investment options, and to limit the number of variable investment options you may select.
We reserve the right to offer any or all Segments more or less frequently or to stop offering any of them (except we will always offer a Segment Option with a Segment Buffer that protects the first 10% of loss) or to suspend offering any or all of them temporarily for some or all contracts.
You should evaluate whether our ability to make the changes described above, and your ability to react to such changes, are appropriate based on your investment goals. When such changes occur, you should also evaluate whether those changes are appropriate based on your investment goals and, if not, you should evaluate your options under the Contract, which may be limited and may have negative consequences associated with them, as described in this section.
Risks associated with the Structured Investment Option (SIO)
An investor is not invested in the Index or in the securities tracked by the Index. There are unique risks regarding the SIO.
Limiting Negative Returns (Segment Risk of Loss)
• |
There is a risk of a substantial loss of your principal and previously credited interest despite limits on negative index returns because you agree to absorb all losses from the portion of any negative Index Performance Rate that exceeds the Segment Buffer for any Segment at maturity. Currently, the only levels of protection are the -10% or the -20% Segment Buffers at maturity. You could lose as much as 80% (for Segments with a -20% Segment Buffer) to 90% (for Segments with a -10% Segment Buffer) of your principal and previously credited interest due to negative index performance on the Segment Maturity Date. We may change the indices and/or Segment Options in the future, but we will always offer a Segment Option with a Segment Buffer that protects the first 10% of loss. In the future, we may offer other Segment Options that do not provide any downside protection which would mean there is a risk of loss of the entire amount invested. |
Limiting Positive Returns (Performance Cap Rates)
| • | Your Segment Rate of Return for a Segment is limited by its Performance Cap Rate, if applicable, which could cause your Segment Rate of Return to be lower than it would otherwise be if you invested in a mutual fund or exchange-traded fund designed to track the performance of the Index. |
• |
We declare a Performance Cap Rate for each Segment, which is the highest Segment Rate of Return that can be credited on the Segment Maturity Date for that Segment. The Performance Cap, if applicable, Rate may limit your participation in any increases in the underlying Index associated with a Segment. Our minimum Performance Cap Rates for 1, 3, and 5-year Segments are 4%, 12%, and 20%, respectively. See Appendix: “State contract availability and/or variations of certain features and benefits” for more information on state variations. We will not open a Segment with a Performance Cap Rate below the applicable minimum Performance Cap Rate. In some cases, we may decide not to declare a Performance Cap Rate for a Segment, in which case there is no maximum Segment Rate of Return for that Segment. |
• |
The Performance Cap Rate is determined on the Segment Start Date. You will not know the rate in advance. Prior to the Segment Start Date, you may elect a Performance Cap Threshold. The threshold represents the minimum Performance Cap Rate you find acceptable for a particular Segment. If we declare a cap that is lower than the threshold you specify, you will not be invested in that Segment and your account value will remain in that Segment Holding Account until the next available Segment for which your threshold is met or you provide us with alternative instructions. You risk having amounts remain in Segment Holding Accounts for lengthy periods of time rather than being invested in Segments. If you do not specify a threshold, you risk the possibility that the Performance Cap Rate established will have a lower cap than you would find acceptable. We will not open a Segment if the Performance Cap Rate for 1, 3, and 5-year Segments would be less than 4%, 12%, and 20%, respectively. See Appendix: “State contract availability and/or variations of certain features and benefits” for more information on state variations. The Performance Cap Rate is a rate of return from the Segment Start Date to the Segment Maturity Date. |
Risks Related to Withdrawals (Segment Interim Value)
| • | There is a risk of loss of principal and previously credited interest in the case of a withdrawal (including an automatic or systematic withdrawal or a required minimum distribution), annuitization, death, surrender, contract cancellation, or transfer prior to a Segment Maturity Date due to charges and adjustments imposed on those distributions, and this may occur even if index performance has been positive. |
| • | The method we use in calculating your Segment Interim Value may result in an amount lower than your Segment Investment, even if the Index has experienced positive investment performance since the Segment Start Date. Also, this amount may be less than the |
amount you would receive had you held the investment until maturity. Because the end-of-term downside protection provided by a Segment Buffer does not apply to the Segment Interim Value, it is theoretically possible that you could lose up to 100% of your investment and previously credited interest in certain extreme scenarios. This loss will be greater if you also have to pay a withdrawal charge, or if you have to pay taxes or tax penalties. |
| • | If you take a withdrawal, including required minimum distributions, and there is insufficient value in the other investment options available under your EQUI-VEST ® contract and the Segment Holding Account, we will withdraw amounts pro rata from any active Segments in your EQUI-VEST® contract. Amounts withdrawn from active Segments will be valued using the formula for calculating the Segment Interim Value. |
| • | Amounts paid on death or surrender before the Segment Maturity Date, will be based on the Segment Interim Value. |
• |
Any calculation of the Segment Interim Value will generally be affected by changes in both the volatility and level of the Index, as well as interest rates. The calculation of the Segment Interim Value is linked to various factors, including the value of a basket of put and call options on the Index as described in “Contract Adjustment — Segment Interim Value” in the Statement of Additional Information. The Segment Interim Value will generally be negatively affected by increases in the expected volatility of index prices, interest rate increases, and by poor market performance. All other factors being equal, the Segment Interim Value would be lower the earlier a withdrawal or surrender is made during a Segment. Also, for all contracts using a Performance Cap Rate limiting factor, participation in upside performance for early withdrawals is pro-rated based on the period those amounts were invested in a Segment. This means you participate to a lesser extent in upside performance the earlier you take a withdrawal. |
| • | You cannot transfer out of a Segment prior to its maturity to another investment option. You can only make withdrawals out of a Segment or surrender your EQUI-VEST® contract. The amount you would receive would be calculated using the formula for the Segment Interim Value. |
Risks Related to Segments, Segment Returns, and Segment Type Holding Accounts
| • | We may, in our sole discretion, not offer certain Segments on one or more Segment Start Dates. |
• |
We may not offer new Segments. Therefore, a certain Segment may not be available for you to transfer your Segment Maturity Value into after the Segment Maturity Date. |
| • | We have the right to substitute an alternative index prior to Segment Maturity if the publication of the Index is discontinued or at our sole discretion we determine that our |
use of the Index should be discontinued or if the calculation of the Index is substantially changed. If we substitute an index for an existing Segment, we would not change the Segment Buffer or Performance Cap Rate. We would attempt to choose a substitute index that has a similar investment objective and risk profile to the replaced index. |
| • | The amounts held in the Segment Holding Account may earn a return that is less than the return you might have earned if those amounts were held in another investment option. |
| • | The level of risk you bear and your potential investment performance will differ depending on the Segments you choose. All of the reference Indices are price return indices, meaning that dividends are excluding from the performance of the Index. The performance of an Index is based on changes in the values of the securities or other instruments that comprise or define the Index. The securities and instruments comprising or defining the Indices are subject to a variety of investment risks, many of which are complicated and interrelated. These risks may affect capital markets generally, specific market segments, or specific issuers. The performance of the Indices may fluctuate, sometimes rapidly and unpredictably. Negative Index performance may cause you to lose money on your investment in the contract. The historical performance of an Index or a Segment of the SIO does not guarantee future results. It is impossible to predict whether an Index will perform positively or negatively over the course of a Segment Duration. |
• |
In the highly unlikely event we were forced to stop offering new Segments, contract owners would be limited to transferring or contributing to the other investment options. You could choose to surrender your contract, but you may be subject to withdrawal charges, taxes, and tax penalties, and if you purchase another retirement vehicle, it may have different features, fees, and risks than your annuity contract. If you are buying the annuity contract for the SIO, you should speak to your financial adviser as to whether this product is suitable for you. |
Risks Related to Indices
While it is not possible to invest directly in an Index, if you choose to allocate amounts to a Segment of the SIO, you are indirectly exposed to the investment risks associated with the applicable Index. Because each Index is comprised or defined by a collection of securities, each Index is largely exposed to market risk and issuer risk.
Market risk is the risk that market fluctuations may cause the value of a security to fluctuate, sometimes rapidly and unpredictably. Issuer risk is the risk that the value of an issuer’s securities may decline for reasons directly related to the issuer, as opposed to the market generally.
| • | S&P Price Return Index: The S&P 500 Price Return Index is comprised of equity securities issued by large-capitalization U.S. companies. In general, large-capitalization companies may be unable to respond quickly to new competitive challenges, and may not be able to attain the high growth rate of successful smaller companies. |
| • | Russell 2000 ® Price Return Index: The Russell 2000® Price Return Index is comprised of equity securities of small-capitalization U.S. companies. In general, the securities of small-capitalization companies may be more volatile and may involve more risk than the securities of larger companies. Small-capitalization companies are more likely to fail than larger companies. |
| • | MSCI EAFE Price Return Index: The MSCI EAFE Price Return Index is an equity index that captures large and mid-cap representation across developed markets around the world. The securities comprising the MSCI EAFE Price Return Index are subject to the risks related to investments in foreign markets (e.g. increased price volatility; changing currency exchange rates; and greater political, regulatory, and economic uncertainty). In general, foreign markets may be less liquid, more volatile, and subject to less government supervision than domestic markets. |
Risks Associated with the Fixed Maturity Options
An allocation to a fixed maturity option has various risks associated with it.
Please be aware that a market value adjustment could result in a significant loss of principal and previously credited interest. In certain extreme circumstances, it is theoretically possible to lose 100% of your investment. Specifically:
| • | If you make any withdrawal (including transfers, surrender or termination of your contract, or when we make deductions for charges) from a fixed maturity option before it matures, we will make a market value adjustment. The market value adjustment may be negative. |
| • | If there is a market value adjustment and interest rates have increased from the time that you originally allocated to a fixed maturity option to the time that you take the withdrawal (including transfers, surrender or termination of your contract, or when we make deductions for charges), the market value adjustment will be negative and will reduce your value in the fixed maturity option. |
| • | The amount of the market value adjustment, either up or down, will be greater the longer the time remaining until the fixed maturity option’s maturity date. |
| • | Therefore, it is possible that a negative market value adjustment could greatly reduce your value in the fixed maturity options, particularly in fixed maturity options with later maturity dates. |
If we deduct all or a portion of a fee or charge from a fixed maturity option, a market value adjustment will apply to that deduction from the fixed maturity option. If the market value adjustment is negative, it will reduce your value in the fixed maturity option.
No company other than us has any legal responsibility to pay amounts that the Company owes under the contract and fixed maturity option. An owner should look to the financial strength of the Company for its claims-paying ability.
Risk associated with taking an early withdrawal
The contract is not a short-term investment and is not appropriate for an investor who needs ready access to cash because the contract is designed to provide for the accumulation of retirement savings and income on a long-term basis. As such, you should not use the contract as a short-term investment or savings vehicle and you should consider whether investing in the contract is consistent with the purpose for which the investment is being considered.
Withdrawals could significantly reduce the minimum death benefit by an amount greater than the value withdrawn.
Withdrawals may be subject to Withdrawal Charges, negative Segment Interim Value adjustments (see
Risks associated with the Structured Investment Option (SIO)
), negative Market Value Adjustments (see Risks associated with the Fixed Maturity Options
), loss of interest and the possibility of adverse tax consequences. Possible fees on access to account value
We may apply fees if you access your account value during the accumulation period or surrender your contract. For example, in addition to possible tax consequences, you may incur fees for accessing your account value such as a withdrawal charge, transfer fee, third party transfer or exchange fee, annual administrative expense, base contract expense, and/or a charge for any optional benefits.
Availability by financial intermediary
Some financial intermediaries (e.g., selling broker-dealer firms) may not offer and/or may limit the offering of certain investment options, contract benefits, and other contract features based on issue age or other criteria established by the selling broker-dealer. For example, your financial professional may not recommend a particular investment option or contract benefit to you that is described in this Prospectus. Before you purchase the contract, you should discuss with your financial professional any limitations, restrictions, or other variations related to the investment options, contract benefits or other contract features available to you through your financial professional. If a particular feature that interests you is not recommended through your broker-dealer, you may want to contact us to explore its availability.
Business disruption, cybersecurity, and artificial intelligence (“AI”) technologies risks
We rely heavily on technology, including interconnected computer systems and data storage networks and digital communications, to conduct our variable product business. Because our variable product business is highly dependent upon the effective operation of our computer systems and those of our service providers and other business partners, our business is vulnerable to disruptions from utility outages, and susceptible to operational and information security risks resulting from information systems failure (e.g., hardware and software malfunctions), and cyberattacks. Cyber-attacks may be systemic (e.g., affecting the internet, cloud services, or other infrastructure) or targeted (e.g., failures in or breach of our systems or those of third parties on whom we rely, including ransomware and malware attacks). Cybersecurity risks include, among other things, the loss, theft, misuse, corruption and destruction of data maintained online or digitally, interference with or denial of service, attacks on our websites (or the websites of third parties on whom we rely), other operational disruption and unauthorized release, use or abuse of confidential customer information. The risk of cyber-attacks may be higher during periods of geopolitical turmoil. Due to the increasing sophistication of cyber-attacks, a cybersecurity breach could occur and persist for an extended period of time without detection. Systems failures and cyberattacks, as well as, any other catastrophic event, including natural and manmade disasters, public health emergencies, pandemic diseases, terrorist attacks, floods or severe storms affecting us, any third-party administrator, the underlying funds, intermediaries and other affiliated or third-party service providers may adversely affect us, our business operations and your account value and interfere with our ability to process contract transactions and calculate account values. Systems failures and cyberattacks may also interfere with our processing of contract transactions, including the processing of orders from our website or with the underlying funds, impact our ability to calculate account values and unit values and/or the underlying funds to be unable to calculate share values, cause the release or possible destruction of confidential customer and/or business information, impede order processing or cause other operational issues, subject us and/or our service providers and intermediaries to regulatory fines, litigation and financial losses and/or cause reputational damage. Cybersecurity risks may also impact the issuers of securities in which the underlying funds invest, which may cause the underlying funds to lose value. The preventative actions we take to reduce the frequency and severity of cybersecurity incidents and protect our computer systems may be insufficient to prevent a cybersecurity breach from impacting our operations or your contract value. There can be no assurance that we or the underlying funds or our service providers and intermediaries will be able to avoid cybersecurity breaches affecting your contract.
The development and deployment of AI tools and technologies, including generative AI, and its use and
anticipated use by us or by third parties on whom we rely, may increase our existing operational risks or create new operational risks that we are not currently anticipating. AI and generative AI may be misused by us or by third parties upon which we rely, and that risk is increased by the relative newness of the technology, the speed at which it is being adopted, and the uncertain and evolving policy and regulatory landscape governing its use. Such misuse could expose us to legal or regulatory risk. Because the generative AI technology is so new, many of the potential risks of generative AI are currently unknowable.
In addition, we are also exposed to risks related to natural and man-made disasters, including, but not limited to, storms, fires, floods, earthquakes, public health crises, malicious acts, and terrorist acts, or any other event, which could adversely affect our ability to conduct business. A natural or man-made disaster, including a pandemic such as COVID-19, could result in our workforce, and/or employees of service providers and/or third-party administrators, being compromised and unable or unwilling to fully perform their responsibilities, which could likewise result in interruptions in our service. This could interfere with our processing of contract transactions, including processing orders from owners and orders with the underlying funds, impact our ability to calculate contract value, or have other adverse impacts on our operations. These events may also negatively affect the our service providers and intermediaries, the underlying funds and issuers of securities in which the underlying funds invest, which may cause the funds underlying your contract to lose value. There can be no assurance that we or the underlying funds or our service providers and intermediaries will be able to avoid negative impacts associated with natural and man-made disasters.
Possible adverse tax consequences
The tax considerations associated with the contract vary and can be complicated. The applicable tax rules can differ, depending on the type of contract, whether TSA, EDC, Annuitant-Owned HR-10, Trusteed, SEP, SIMPLE IRA and SARSEP contracts. We cannot provide detailed information on all tax aspects of the contracts. Moreover, the tax aspects that apply to a particular person’s contract may vary depending on the facts applicable to that person. Tax rules may change without notice. We cannot predict whether, when, or how these rules could change. Any change could affect contracts purchased before the change. Congress may also consider further proposals to comprehensively reform or overhaul the United States tax and retirement systems, which if enacted, could affect the tax benefits of a contract. We cannot predict what, if any, legislation will actually be proposed or enacted. Before making contributions to your contract or taking other action related to your contract, you should consult with a tax professional to determine the tax implications of an investment in, and payments received under, the contract.
Risk associated with taking a loan
Loans will decrease your account value and death benefit, and loaned amounts will not participate in the investment experience of your investment options. There may be adverse tax consequences associated with taking a loan from your contract.
®
Price Return Index does not include dividends declared by any of the companies included in this Index,which will reduce Index performance.
FEES, EXPENSES, AND ADJUSTMENTS | ||||||||||
Are There Charges or Adjustments for Early Withdrawals? |
Yes. If amounts are removed from a fixed maturity option before the maturity date, there will be a market value adjustment which could greatly reduce the value in your fixed maturity option theoretically by up to 100% in extreme situations. For example, if you allocate $100,000 to a fixed maturity option and later withdraw the entire amount before the maturity date, you could lose up to $100,000 of your investment. This loss will be greater if you also have to pay a withdrawal charge, taxes and tax penalties. A market value adjustment will apply to withdrawals, transfers, surrender of your contract, or when we make deductions for charges from a fixed maturity option before the maturity date. For additional information about the charges for surrenders and early withdrawals see “Withdrawal charge” in “Charges under the contracts” under “Charges, expenses, and adjustments” in this prospectus. |
|||||||||
Are There Transaction Charges? |
Yes. For additional information about transaction charges see “Charges under the contracts” in “Charges, expenses, and adjustments” in this prospectus. |
|||||||||
Are There Ongoing Fees and Expenses? |
Yes. each year each year |
|||||||||
Annual Fee |
Minimum |
Maximum |
||||||||
Base Contracts (1) |
1.34% |
2.00% |
||||||||
Portfolio Company fees and expenses (2) |
0.54% |
3.04% |
||||||||
(1) Expressed as an annual percent of daily net assets in the variable investment options. (2) Expressed as an annual percentage of daily net assets in the Portfolio. This range is for the year ended December 31, 2025 and could change from year to year. Because your contract is customizable, the choices you make affect how much you will pay. To help you understand the cost of owning your contract, the following table shows the lowest and highest cost you could pay each year which could add withdrawal charges and market value adjustments that substantially increase costs. |
||||||||||
Lowest Annual Cost $1,737 |
Highest Annual Cost $4,038 | |||||||||
Assumes: • Investment of $100,000 • 5% annual appreciation • Least expensive combination of contract and Portfolio fees and expenses • No optional benefits • No sales charges • No additional contributions, transfers or withdrawals • No contract adjustments |
Assumes: • Investment of $100,000 • 5% annual appreciation • Most expensive combination of contract (Series 500), optional benefits and Portfolio fees and expenses • No sales charges • No additional contributions, transfers or withdrawals • No contract adjustments | |||||||||
For additional information about ongoing fees and expenses see “Fee table” in this prospectus. |
||||||||||
Yes.
If amounts are removed from a fixed maturity option before the maturity date, there will be a market value adjustment which could greatly reduce the value in your fixed maturity option theoretically by up to 100% in extreme situations. For example, if you allocate $100,000 to a fixed maturity option and later withdraw the entire amount before the maturity date, you could lose up to $100,000 of your investment. This loss will be greater if you also have to pay a withdrawal charge, taxes and tax penalties. A market value adjustment will apply to withdrawals, transfers, surrender of your contract, or when we make deductions for charges from a fixed maturity option before the maturity date.
For additional information about the charges for surrenders and early withdrawals see “Withdrawal charge” in “Charges under the contracts” under “Charges, expenses, and adjustments” in this prospectus.
Yes.
For additional information about transaction charges see “Charges under the contracts” in “Charges, expenses, and adjustments” in this prospectus.
Are There Ongoing Fees and Expenses? |
Yes. each year each year |
|||||||||
Annual Fee |
Minimum |
Maximum |
||||||||
Base Contracts (1) |
1.34% |
2.00% |
||||||||
Portfolio Company fees and expenses (2) |
0.54% |
3.04% |
||||||||
(1) Expressed as an annual percent of daily net assets in the variable investment options. (2) Expressed as an annual percentage of daily net assets in the Portfolio. This range is for the year ended December 31, 2025 and could change from year to year. Because your contract is customizable, the choices you make affect how much you will pay. To help you understand the cost of owning your contract, the following table shows the lowest and highest cost you could pay each year which could add withdrawal charges and market value adjustments that substantially increase costs. |
||||||||||
Lowest Annual Cost $1,737 |
Highest Annual Cost $4,038 | |||||||||
Assumes: • Investment of $100,000 • 5% annual appreciation • Least expensive combination of contract and Portfolio fees and expenses • No optional benefits • No sales charges • No additional contributions, transfers or withdrawals • No contract adjustments |
Assumes: • Investment of $100,000 • 5% annual appreciation • Most expensive combination of contract (Series 500), optional benefits and Portfolio fees and expenses • No sales charges • No additional contributions, transfers or withdrawals • No contract adjustments | |||||||||
For additional information about ongoing fees and expenses see “Fee table” in this prospectus. |
||||||||||
Assumes:
•
Investment of $100,000
•
5% annual appreciation
•
Least expensive combination of contract and Portfolio fees and expenses
•
No optional benefits
•
No sales charges
•
No additional contributions, transfers or withdrawals
•
No contract adjustments
Assumes:
•
Investment of $100,000
•
5% annual appreciation
•
Most expensive combination of contract (Series 500), optional benefits and Portfolio fees and expenses
•
No sales charges
•
No additional contributions, transfers or withdrawals
•
No contract adjustments
RISKS | ||
Is There a Risk of Loss from Poor Performance? |
Yes. | |
Is this a Short-Term Investment? |
No. | |
What Are the Risks Associated with the Investment options? |
An investment in the contract is subject to the risk of poor investment performance and can vary depending on the performance of the investment options available under the contract, (e.g., the Portfolios). Each investment option, including the guaranteed interest option and fixed maturity options has its own unique risks. You should review the investment options before making an investment decision. For additional information about the risks associated with investment options see “Fixed investment options”, “Guaranteed interest option” and “Portfolios of the Trusts” in “Purchasing the contract” in the prospectus, as well as, “Risks associated with the variable investment options”, and “Risks associated with the fixed maturity options” in “Principal Risks of investing in the contract. ”See also Appendix: “Investment options available under the contract” in this prospectus. | |
What Are the Risks Related to the Insurance Company? |
An investment in the contract is subject to the risks related to the Company. The Company is solely responsible to the contract owner for the contract’s account value and the optional benefits. The general obligations including the guaranteed interest option, fixed maturity options and any optional benefits under the contract are supported by our general account and are subject to our claims paying ability. An owner should look solely to our financial strength for our claims-paying ability. More information about the Company, including our financial strength ratings, may be obtained at www.equitable.com/about-us/financial-strength-ratings. For additional information about insurance company risks see “About the general account” in “More information” in this prospectus. | |
Yes.
Effective June 18, 2012, for certain contract series and types, we no longer accept contributions. For other contract series and types, including contracts issued in certain states, we currently continue to accept subsequent contributions subject to limitations. For more information, see “How you can contribute to your contract” in “Purchasing the contract” and Appendix: “State contract availability and/or variations of certain features and benefits” in this prospectus.
There are limits on contributions and transfers into and out of the guaranteed interest option, and restrictions or limitations with the DCA program. See “Allocating your contributions” in “Purchasing the Contract” and “Transferring your account value” in “Transferring your money among investment options in this prospectus” for more information.
For more information see “About the Separate Account” in “More information” in the prospectus.
You must choose one of the two investment methods: 1) Maximum investment option choice, or 2) Maximum transfer flexibility. For more information please see “Selecting your investment method” in this prospectus.
We will not accept allocations to a fixed maturity option if on the date the contribution or transfer is to be applied the rate to maturity is 3%. This means that at points in time there may be no fixed maturity options available. You can allocate your contributions to one or more of these fixed maturity options. However, you may not allocate more than one contribution to any one fixed maturity option.
Contributions and transfers into and out of the guaranteed interest option are limited.
For additional information about restrictions on investment options, see “Portfolios of the Trusts”, “Guaranteed interest option”, and “Fixed maturity options” in “Purchasing the Contract” and “Transferring your money among investment options” in this prospectus.
Yes.
At any time, we have the right to limit or terminate your contributions, allocations and transfers to any of the investment options.This contract includes a standard death benefit. Withdrawals could significantly reduce or terminate the death benefit.
For additional information about the optional benefits see “Benefits available under the contract” in the prospectus.
You should consult with a tax professional to determine the tax implications of an investment in, and payments received under, the contract. There is no additional tax benefit to you if the contract is purchased through a tax-qualified plan or individual retirement account (IRA). Withdrawals will be subject to ordinary income tax and may be subject to tax penalties. Generally, you are not taxed until you make a withdrawal from the contract.
For more information, see “Tax information” in this prospectus.
Some financial professionals may receive compensation for selling the contract to you, both in the form of commissions or in the form of contribution-based compensation. Financial professionals may also receive additional compensation for enhanced marketing opportunities and other services (commonly referred to as “marketing allowances”). This conflict of interest may influence the financial professional to recommend this contract over another investment.
For additional information about compensation to financial professionals see “Distribution of the contracts” in “More information” in this prospectus.
Some financial professionals may have a financial incentive to offer a new contract in place of the one you already own. You should only exchange your contract if you determine, after comparing the features, fees, and risks of both contracts, as well as any fees or penalties to terminate your existing contract, that it is preferable to purchase the new contract rather than continue to own your existing contract.
For additional information about exchanges see “Charge for third-party transfer or exchange” in “Charges, expenses, and adjustments” in this prospectus.
Fee table
The following tables describe the fees, expenses, and adjustments that you will pay when buying, owning, and surrendering, or making withdrawals from an investment option or from the contract. Please refer to your contract specifications page for information about the specific fees you will pay
each year
based on the investment options you have elected.
The first table describes fees and expenses that you will pay at the time that you buy the contract, surrender the contract, make certain withdrawals from an investment option or from the contract, or transfer account value between investment options.
Charges designed to approximate certain taxes that may be imposed on us, such as premium taxes in your state, may also apply.
Transaction Expenses |
||
| Sales Load Imposed on Purchases (as a percentage of purchase payments) | None | |
| Withdrawal Charge (as a percentage of contributions withdrawn) (1) |
6.00% | |
| Transfer Fee | None | |
| Third Party Transfer or Exchange Fee (2) |
$65 | |
| Special Service Charges (3) |
$90 |
| (1) | The charge percentage is deducted upon a withdrawal of amounts in excess of the 10% free withdrawal amount. Important exceptions and limitations may eliminate or reduce this charge. For a complete description of withdrawal charges, please see “Withdrawal Charge” in “Charges, expenses, and adjustments” in this prospectus. See Appendix, “State contract availability and/or variations of certain features and benefits” in this prospectus for more information. |
| (2) | This charge will never exceed 2% of the amount disbursed or transferred. |
| (3) | Unless you specify otherwise, this charge will be deducted from the amount you request. Special service charges include (1) express mail charge; and (2) wire transfer charge. The current maximum charge for each service is $90. We may discontinue these services at any time. |
The next table describes the adjustments, in addition to any transaction expenses, that apply if all or a portion of the account value is removed from an investment option or from the contract before the expiration of a specified period.
Adjustments |
||||
| Fixed Maturity Option Maximum Potential Loss Due to Market Value Adjustment (as a percentage of Account value withdrawn from the Fixed Maturity Option) (1) |
100% | |||
| (1) | A market value adjustment will apply to withdrawals, transfers, surrender of your contract, or when we make deductions for charges from a fixed maturity option before the maturity date. The actual amount of the Market Value Adjustment is determined by a formula that depends on, among other things, the difference between the rate to maturity that applies to the amount being withdrawn and the rate to maturity in effect at that time for new allocations to that same fixed maturity option, and the length of time remaining until the maturity date. In general, the maximum loss would occur if there is a total distribution for a fixed maturity option a significant time prior to the maturity date and interest rates have risen dramatically from the time that you originally allocate an amount to the fixed maturity option to the time that you take the withdrawal. See “Fixed maturity options” under “Purchasing the contract” for more information. |
The next table describes the fees and expenses that you will pay
each year
during the time that you own the contract (not including Portfolio fees and expenses).
Annual Contract Expenses |
||
| Annual Administrative Charge (1) |
$65 | |
| Base Contract Expenses (2) (as a percentage of daily net assets in the variable investment options) |
2.00% |
| (1) | The annual administrative charge is deducted from your account value on each contract date anniversary. The current charge is $30. If the contract is surrendered or annuitized or a death benefit is paid on any date other than the contract date anniversary, we will deduct a pro rata portion of the administrative charge for that year. For series 300, 400 and 500 contracts, during the first two contract years this charge, if it applies, is equal to the lesser of $30 or 2% of your account value, plus any amounts previously withdrawn during the contract year. Thereafter, the charge is $30 for each contract year. For series 100 and 200 contracts, the charge is equal to the lesser of $30 or 2% of your account value, plus any amounts previously withdrawn during the contract year. We may discontinue these services at any time. |
| (2) | The current Base Contract Expenses for Series 100 and 200 are: current charge 1.40% and maximum 1.49% for EQ/Common Stock and EQ/Money Market Options. For all other investment options the current charge and maximum is 1.34% for Series 100 and 200. For Series 300 the current charge is 1.34% and the maximum is 1.35%. For Series 400 the current charge is 1.34% and the maximum is 2.00%. For Series 500 the current charge is 1.45% and maximum is 2.00%. |
10
The next item shows the minimum and maximum total operating expenses charged by the underlying Portfolios that you may pay periodically during the time that you own the contract. Expenses shown may change over time and may be higher or lower in the future. A complete list of Portfolios available under the contract, including their annual expenses, may be found at the back of this document. See “Appendix: Investment options available under the contract.”
Annual Portfolio Expenses |
Minimum |
Maximum |
||||||
Annual Portfolio Expenses prior to Expense Limitation Arrangement (expenses that are deducted from Portfolio assets including management fees, 12b-1 fees, service fees and/or other expenses)* |
0.54 |
% |
3.04 |
% | ||||
* |
“Annual Portfolio Expenses” may be based, in part, on estimated amounts of such expenses. The expenses listed are for the year ended December 31, 2025. |
Examples
These Examples are intended to help you compare the cost of investing in the variable investment options with the cost of investing in other annuity contracts that offer variable investment options. The costs include transaction expenses, annual contract expenses, and annual Portfolio expenses.
These Examples assume all account value is allocated to the variable investment options. The examples do not reflect market value adjustments. Your costs could differ from those shown below if you invest in the fixed maturity options.
These examples assume that you invest $100,000 in the variable investment options for the time periods indicated. The Examples also assume that your investment has a 5% return
each year
and assumes the most expensive combination of annual Portfolio expenses and optional benefits available at their maximum charge.
Although your actual costs may be higher or lower, based on these assumptions, your costs would be:
EQUI-VEST
®
series 100 and 200 contracts — For IRA contracts
If you surrender your contract or annuitize (under a non-life option) at the end of the applicable time period |
If you do not surrender your contract | |||||||||||||
1 year |
3 years |
5 years |
10 years |
1 year |
3 years |
5 years |
10 years | |||||||
$10,170 |
$19,744 |
$29,365 |
$50,856 |
$4,757 |
$14,304 |
$23,899 |
$48,090 | |||||||
EQUI-VEST
®
series 100 and 200 contracts — For NQ contracts
If you surrender your contract or annuitize (under a non-life option) at the end of the applicable time period |
If you do not surrender your contract | |||||||||||||
1 year |
3 years |
5 years |
10 years |
1 year |
3 years |
5 years |
10 years | |||||||
$10,170 |
$19,744 |
$29,365 |
$48,090 |
$4,757 |
$14,304 |
$23,899 |
$48,090 | |||||||
EQUI-VEST
®
series 300 contracts
If you surrender your contract or annuitize (under a non-life option) at the end of the applicable time period |
If you do not surrender your contract | |||||||||||||
1 year |
3 years |
5 years |
10 years |
1 year |
3 years |
5 years |
10 years | |||||||
$10,031 |
$19,346 |
$28,734 |
$46,913 |
$4,610 |
$13,883 |
$23,228 |
$46,913 | |||||||
EQUI-VEST
®
series 400 contracts
If you surrender your contract or annuitize (under a non-life option) at the end of the applicable time period |
If you do not surrender your contract | |||||||||||||
1 year |
3 years |
5 years |
10 years |
1 year |
3 years |
5 years |
10 years | |||||||
$10,676 |
$21,183 |
$31,628 |
$52,230 |
$5,292 |
$15,830 |
$26,306 |
$52,230 | |||||||
EQUI-VEST
®
series 500 contracts
If you surrender your contract or annuitize (under a non-life option) at the end of the applicable time period |
If you do not surrender your contract | |||||||||||||
1 year |
3 years |
5 years |
10 years |
1 year |
3 years |
5 years |
10 years | |||||||
$1,737 |
$21,183 |
$31,628 |
$52,230 |
$5,292 |
$15,830 |
$26,306 |
$52,230 | |||||||
The first table describes fees and expenses that you will pay at the time that you buy the contract, surrender the contract, make certain withdrawals from an investment option or from the contract, or transfer account value between investment options.
Charges designed to approximate certain taxes that may be imposed on us, such as premium taxes in your state, may also apply.
Transaction Expenses |
||
| Sales Load Imposed on Purchases (as a percentage of purchase payments) | None | |
| Withdrawal Charge (as a percentage of contributions withdrawn) (1) |
6.00% | |
| Transfer Fee | None | |
| Third Party Transfer or Exchange Fee (2) |
$65 | |
| Special Service Charges (3) |
$90 |
| (1) | The charge percentage is deducted upon a withdrawal of amounts in excess of the 10% free withdrawal amount. Important exceptions and limitations may eliminate or reduce this charge. For a complete description of withdrawal charges, please see “Withdrawal Charge” in “Charges, expenses, and adjustments” in this prospectus. See Appendix, “State contract availability and/or variations of certain features and benefits” in this prospectus for more information. |
| (2) | This charge will never exceed 2% of the amount disbursed or transferred. |
| (3) | Unless you specify otherwise, this charge will be deducted from the amount you request. Special service charges include (1) express mail charge; and (2) wire transfer charge. The current maximum charge for each service is $90. We may discontinue these services at any time. |
The next table describes the adjustments, in addition to any transaction expenses, that apply if all or a portion of the account value is removed from an investment option or from the contract before the expiration of a specified period.
Adjustments |
||||
| Fixed Maturity Option Maximum Potential Loss Due to Market Value Adjustment (as a percentage of Account value withdrawn from the Fixed Maturity Option) (1) |
100% | |||
| (1) | A market value adjustment will apply to withdrawals, transfers, surrender of your contract, or when we make deductions for charges from a fixed maturity option before the maturity date. The actual amount of the Market Value Adjustment is determined by a formula that depends on, among other things, the difference between the rate to maturity that applies to the amount being withdrawn and the rate to maturity in effect at that time for new allocations to that same fixed maturity option, and the length of time remaining until the maturity date. In general, the maximum loss would occur if there is a total distribution for a fixed maturity option a significant time prior to the maturity date and interest rates have risen dramatically from the time that you originally allocate an amount to the fixed maturity option to the time that you take the withdrawal. See “Fixed maturity options” under “Purchasing the contract” for more information. |
The next table describes the fees and expenses that you will pay
each year
during the time that you own the contract (not including Portfolio fees and expenses).
Annual Contract Expenses |
||
| Annual Administrative Charge (1) |
$65 | |
| Base Contract Expenses (2) (as a percentage of daily net assets in the variable investment options) |
2.00% |
| (1) | The annual administrative charge is deducted from your account value on each contract date anniversary. The current charge is $30. If the contract is surrendered or annuitized or a death benefit is paid on any date other than the contract date anniversary, we will deduct a pro rata portion of the administrative charge for that year. For series 300, 400 and 500 contracts, during the first two contract years this charge, if it applies, is equal to the lesser of $30 or 2% of your account value, plus any amounts previously withdrawn during the contract year. Thereafter, the charge is $30 for each contract year. For series 100 and 200 contracts, the charge is equal to the lesser of $30 or 2% of your account value, plus any amounts previously withdrawn during the contract year. We may discontinue these services at any time. |
| (2) | The current Base Contract Expenses for Series 100 and 200 are: current charge 1.40% and maximum 1.49% for EQ/Common Stock and EQ/Money Market Options. For all other investment options the current charge and maximum is 1.34% for Series 100 and 200. For Series 300 the current charge is 1.34% and the maximum is 1.35%. For Series 400 the current charge is 1.34% and the maximum is 2.00%. For Series 500 the current charge is 1.45% and maximum is 2.00%. |
The next item shows the minimum and maximum total operating expenses charged by the underlying Portfolios that you may pay periodically during the time that you own the contract. Expenses shown may change over time and may be higher or lower in the future. A complete list of Portfolios available under the contract, including their annual expenses, may be found at the back of this document. See “Appendix: Investment options available under the contract.”
Annual Portfolio Expenses |
Minimum |
Maximum |
||||||
Annual Portfolio Expenses prior to Expense Limitation Arrangement (expenses that are deducted from Portfolio assets including management fees, 12b-1 fees, service fees and/or other expenses)* |
0.54 |
% |
3.04 |
% | ||||
* |
“Annual Portfolio Expenses” may be based, in part, on estimated amounts of such expenses. The expenses listed are for the year ended December 31, 2025. |
Examples
These Examples are intended to help you compare the cost of investing in the variable investment options with the cost of investing in other annuity contracts that offer variable investment options. The costs include transaction expenses, annual contract expenses, and annual Portfolio expenses.
These Examples assume all account value is allocated to the variable investment options. The examples do not reflect market value adjustments. Your costs could differ from those shown below if you invest in the fixed maturity options.
These examples assume that you invest $100,000 in the variable investment options for the time periods indicated. The Examples also assume that your investment has a 5% return
each year
and assumes the most expensive combination of annual Portfolio expenses and optional benefits available at their maximum charge.
Although your actual costs may be higher or lower, based on these assumptions, your costs would be:
EQUI-VEST
®
series 100 and 200 contracts — For IRA contracts
If you surrender your contract or annuitize (under a non-life option) at the end of the applicable time period |
If you do not surrender your contract | |||||||||||||
1 year |
3 years |
5 years |
10 years |
1 year |
3 years |
5 years |
10 years | |||||||
$10,170 |
$19,744 |
$29,365 |
$50,856 |
$4,757 |
$14,304 |
$23,899 |
$48,090 | |||||||
EQUI-VEST
®
series 100 and 200 contracts — For NQ contracts
If you surrender your contract or annuitize (under a non-life option) at the end of the applicable time period |
If you do not surrender your contract | |||||||||||||
1 year |
3 years |
5 years |
10 years |
1 year |
3 years |
5 years |
10 years | |||||||
$10,170 |
$19,744 |
$29,365 |
$48,090 |
$4,757 |
$14,304 |
$23,899 |
$48,090 | |||||||
EQUI-VEST
®
series 300 contracts
If you surrender your contract or annuitize (under a non-life option) at the end of the applicable time period |
If you do not surrender your contract | |||||||||||||
1 year |
3 years |
5 years |
10 years |
1 year |
3 years |
5 years |
10 years | |||||||
$10,031 |
$19,346 |
$28,734 |
$46,913 |
$4,610 |
$13,883 |
$23,228 |
$46,913 | |||||||
EQUI-VEST
®
series 400 contracts
If you surrender your contract or annuitize (under a non-life option) at the end of the applicable time period |
If you do not surrender your contract | |||||||||||||
1 year |
3 years |
5 years |
10 years |
1 year |
3 years |
5 years |
10 years | |||||||
$10,676 |
$21,183 |
$31,628 |
$52,230 |
$5,292 |
$15,830 |
$26,306 |
$52,230 | |||||||
EQUI-VEST
®
series 500 contracts
If you surrender your contract or annuitize (under a non-life option) at the end of the applicable time period |
If you do not surrender your contract | |||||||||||||
1 year |
3 years |
5 years |
10 years |
1 year |
3 years |
5 years |
10 years | |||||||
$1,737 |
$21,183 |
$31,628 |
$52,230 |
$5,292 |
$15,830 |
$26,306 |
$52,230 | |||||||
3.
Principal risks of investing in the contract The risks identified below are the principal risks of investing in the contract. The contract may be subject to additional risks other than those identified and described in this prospectus.
Risks associated with variable investment options
You take all the investment risk for amounts allocated to one or more of the subaccounts, which invest in Portfolios. If the subaccounts you select increase in value, then your account value goes up; if they decrease in value, your account value goes down. How much your account value goes up or down depends on the performance of the Portfolios in which your subaccounts invest. We do not guarantee the investment results of any Portfolio. An investment in the contract is subject to the risk of poor investment performance, and the value of your investment can vary depending on the performance of the selected Portfolio(s), each of which has its own unique risks. You should review the Portfolios before making an investment decision.
Insurance company risk
No company other than us has any legal responsibility to pay amounts that we owe under the contract. The general obligations and any Guaranteed benefits under the contract are supported by our general account and are subject to our claims paying ability. You should look solely to our financial strength for our claims-paying ability.
Risks Associated with the Fixed Maturity Options
An allocation to a fixed maturity option has various risks associated with it.
Please be aware that a market value adjustment could result in a significant loss of principal and previously credited interest. In certain extreme circumstances, it is theoretically possible to lose 100% of your investment. Specifically:
| • | If you make any withdrawal (including transfers, surrender or termination of your contract, or when we make deductions for charges) from a fixed maturity option before it matures, we will make a market value adjustment. The market value adjustment may be negative. |
| • | If there is a market value adjustment and interest rates have increased from the time that you originally allocated to a fixed maturity option to the time that you take the withdrawal (including transfers, surrender or termination of your contract, or when we make deductions for charges), the market value adjustment will be negative and will reduce your value in the fixed maturity option. |
| • | The amount of the market value adjustment, either up or down, will be greater the longer the time remaining until the fixed maturity option’s maturity date. |
| • | Therefore, it is possible that a negative market value adjustment could greatly reduce your value in the fixed maturity options, particularly in fixed maturity options with later maturity dates. |
If we deduct all or a portion of a fee or charge from a fixed maturity option, a market value adjustment will apply to that deduction from the fixed maturity option. If the market value adjustment is negative, it will reduce your value in the fixed maturity option.
No company other than us has any legal responsibility to pay amounts that the Company owes under the contract and fixed maturity option. An owner should look to the financial strength of the Company for its claims-paying ability.
Risk associated with taking an early withdrawal
The contract is not a short-term investment and is not appropriate for an investor who needs ready access to cash because the contract is designed to provide for the accumulation of retirement savings and income on a long-term basis. As such, you should not use the contract as a short-term investment or savings vehicle and you should consider whether investing in the contract is consistent with the purpose for which the investment is being considered.
Withdrawals could significantly reduce the minimum death benefit by an amount greater than the value withdrawn.
Withdrawals may be subject to Withdrawal Charges, negative Market Value Adjustments (see
Risks associated with the Fixed Maturity Options
), loss of interest and the possibility of adverse tax consequences. Insurance company risk
No company other than us has any legal responsibility to pay amounts that we owe under the contract including amounts allocated to the fixed maturity options. The general obligations and any Guaranteed benefits under the contract are supported by our general account and are subject to our claims paying ability. You should look solely to our financial strength for our claims-paying ability.
Possible fees on access to account value
We may apply fees if you access your account value during the accumulation period or surrender your contract. For example, in addition to possible tax consequences you may incur fees for accessing your account value such as a withdrawal charge, transfer fee, third party transfer or exchange fee, annual administrative expense, base contract expense, and/or a charge for any optional benefits.
Possible adverse tax consequences
The tax considerations associated with the contract vary and can be complicated. The applicable tax rules can differ,
depending on the type of contract, whether NQ, traditional IRA, Roth Advantage, Roth IRA or QP. We cannot provide detailed information on all tax aspects of the contracts. Moreover, the tax aspects that apply to a particular person’s contract may vary depending on the facts applicable to that person. Tax rules may change without notice. We cannot predict whether, when, or how these rules could change. Any change could affect contracts purchased before the change. Congress may also consider further proposals to comprehensively reform or overhaul the United States tax and retirement systems, which if enacted, could affect the tax benefits of a contract. We cannot predict what, if any, legislation will actually be proposed or enacted. Before making contributions to your contract or taking other action related to your contract, you should consult with a tax professional to determine the tax implications of an investment in, and payments received under, the contract.
Contract Changes Risk
We may, at any time, exercise our rights to limit or terminate your contributions, allocations and transfers to any of the variable investment options. We reserve the right, subject to compliance with laws that apply, to remove variable investment options from the Separate Account, to combine any two or more variable investment options, to restrict or eliminate any voting rights as to the Separate Account, to limit or terminate contributions or transfers into any of the variable investment options, and to limit the number of variable investment options you may select.
You should evaluate whether our ability to make the changes described above, and your ability to react to such changes, are appropriate based on your investment goals. When such changes occur, you should also evaluate whether those changes are appropriate based on your investment goals and, if not, you should evaluate your options under the Contract, which may be limited and may have negative consequences associated with them, as described in this section.
Availability by financial intermediary
Some financial intermediaries (e.g., selling broker-dealer firms) may not offer and/or may limit the offering of certain investment options, contract benefits, and other contract features based on issue age or other criteria established by the selling broker-dealer. For example, your financial professional may not recommend a particular investment option or contract benefit to you that is described in this Prospectus. Before you purchase the contract, you should discuss with your financial professional any limitations, restrictions, or other variations related to the investment options, contract benefits or other contract features available to you through your financial professional. If a particular feature that interests you is not recommended through your broker-dealer, you may want to contact us to explore its availability.
Risk of loss
All investments have risks to some degree and it is possible that you could lose money by investing in the contract. An investment in the contract is not a deposit with a bank and is not insured or guaranteed by the Federal Deposit Insurance Corporation or any other government agency.
Risk associated with taking a loan
Loans will decrease your account value and death benefit, and loaned amounts will not participate in the investment experience of your investment options. There may be adverse tax consequences associated with taking a loan from your contract.
Business disruption, cybersecurity, and artificial intelligence (“AI”) technologies risks
We rely heavily on technology, including interconnected computer systems and data storage networks and digital communications, to conduct our variable product business. Because our variable product business is highly dependent upon the effective operation of our computer systems and those of our service providers and other business partners, our business is vulnerable to disruptions from utility outages, and susceptible to operational and information security risksresulting from information systems failure (e.g., hardware and software malfunctions), and cyberattacks.
Cyber-attacks
may be systemic (e.g., affecting the internet, cloud services, or other infrastructure) or targeted (e.g., failures in or breach of our systems or those of third parties on whom we rely, including ransomware and malware attacks). Cybersecurity risks include, among other things, the loss, theft, misuse, corruption and destruction of data maintained online or digitally, interference with or denial of service, attacks on our websites (or the websites of third parties on whom we rely), other operational disruption and unauthorized release, use or abuse of confidential customer information. The risk of cyber-attacks may be higher during periods of geopolitical turmoil. Due to the increasing sophistication of cyber-attacks, a cybersecurity breach could occur and persist for an extended period of time without detection. Systems failures and cyberattacks, as well as, any other catastrophic event, including natural and manmade disasters, public health emergencies, pandemic diseases, terrorist attacks, floods or severe storms affecting us, any third-party administrator, the underlying funds, intermediaries and other affiliated or third-party service providers may adversely affect us, our business operations and your account value and interfere with our ability to process contract transactions and calculate account values. Systems failures and cyberattacks may also interfere with our processing of contract transactions, including the processing of orders from our website or with the underlying funds, impact our ability to calculate account values and unit values and/or the underlying funds to be unable to calculate share values, cause the release or possible destruction of confidential customer and/or business information, impede order processing or cause other operational issues, subject us and/or our service providers and intermediaries to regulatory fines, litigation and financial losses and/or cause reputational damage. Cybersecurity risks may also impact the issuers of securities in which the underlying funds invest, which may cause the underlying funds to lose value. The preventative actions we take to reduce the frequency and severity of cybersecurity incidents and protect our computer systems may be insufficient to prevent a cybersecurity breach from impacting our operations or your contract value. There can be no assurance that we or the underlying funds or our service providers and intermediaries will be able to avoid cybersecurity breaches affecting your contract.
The development and deployment of AI tools and technologies, including generative AI, and its use and anticipated use by us or by third parties on whom we rely, may increase our existing operational risks or create new operational risks that we are not currently anticipating. AI and generative AI may be misused by us or by third parties upon which we rely, and that risk is increased by the relative newness of the technology, the speed at which it is being adopted, and the uncertain and evolving policy and regulatory landscape governing its use. Such misuse could expose us to legal or regulatory risk. Because the generative AI technology is so new, many of the potential risks of generative AI are currently unknowable.
In addition, we are also exposed to risks related to natural and man-made disasters, including, but not limited to, storms, fires, floods, earthquakes, public health crises, malicious acts, and terrorist acts, or any other event, which could adversely affect our ability to conduct business. A natural or man-made disaster, including a pandemic such as COVID-19, could result in our workforce, and/or employees of service providers and/or third-party administrators, being compromised and unable or unwilling to fully perform their responsibilities, which could likewise result in interruptions in our service. This could interfere with our processing of contract transactions, including processing orders from owners and orders with the underlying funds, impact our ability to calculate contract value, or have other adverse impacts on our operations. These events may also negatively affect the our service providers and intermediaries, the underlying funds and issuers of securities in which the underlying funds invest, which may cause the funds underlying your contract to lose value. There can be no assurance that we or the underlying funds or our service providers and intermediaries will be able to avoid negative impacts associated with natural and man-made disasters.
What are your investment options under the contract?
Your investment options are the variable investment options, the guaranteed interest option and the fixed maturity options. We may, at any time, exercise our rights to change, limit or amend the number of investment options or to close a variable investment option to new contributions or transfers.
Variable investment options
Contract value allocated to one of the variable investment options will vary based on the investment performance of the underlying Portfolio in which the variable investment option invests. There is a risk of loss of the entire amount invested. You can lose your principal when investing in the variable investment options. In periods of poor market performance, the net return, after charges, expenses, and adjustments, may result in negative yields, including for the EQ/Money Market variable investment option. Subject to the terms of your contract, we may exercise our rights to limit or terminate your contributions and to limit the number of variable investment options you may elect.
You can choose from among the variable investment options, the guaranteed interest option and the fixed maturity options.
Portfolios of the Trusts
We offer both affiliated and unaffiliated Trusts, which in turn offer one or more Portfolios. Equitable Investment Management Group, LLC (“Equitable IMG”) is an affiliate of the Company and serves as the investment adviser of the EQ Advisors Trust (the “affiliated Trust”). For some affiliated Portfolios, Equitable IMG has entered into sub-advisory agreements with one or more other investment advisers (the “sub-advisers”) to carry out investment decisions for the Portfolios. As such, among other responsibilities, Equitable IMG oversees the activities of the sub-advisers with respect to the affiliated Trust and is responsible for retaining or discontinuing the services of those sub-advisers.
Information regarding each of the currently available Portfolios, their investment adviser(s) and/or sub-adviser(s), their current expenses, and their current performance is available in an appendix to the prospectus. See Appendix: “Investment options available under the contract.”
Each Portfolio has issued a prospectus that contains more detailed information about the Portfolio. You should consider the investment objectives, risks, and charges and expenses of the portfolios carefully before investing. In order to obtain copies of the portfolios’ prospectuses, you may call one of our customer service representatives at (877) 522 - 5035, or visit www.equitable.com/ICSR#EQH146648.
You should be aware that Equitable Advisors, LLC (Equitable Financial Advisors in Michigan and Tennessee), (“Equitable Advisors”) and Equitable Distributors, LLC (“Equitable
Distributors”) (together, the “Distributors”) directly or indirectly receive 12b-1 fees from affiliated Portfolios for providing certain distribution and/or shareholder support services. These
fees will not exceed 0.25% of the Portfolios’ average daily net assets. The affiliated Portfolios’ sub-advisers and/or their affiliates may also contribute to the cost of expenses for sales meetings or seminar sponsorships that may relate to the contracts and/or the sub-advisers’ respective Portfolios. In addition, Equitable IMG receives advisory fees and Equitable Investment Management, LLC, an affiliate of Equitable IMG, receives administration fees in connection with the services they provide to the Portfolios. As such, it is generally more profitable for us to offer affiliated Portfolios than to offer unaffiliated Portfolios.
The Company or the Distributors may directly or indirectly receive 12b-1 fees and additional payments from certain unaffiliated Portfolios, their advisers, sub-advisers, distributors or affiliates, for providing certain administrative, marketing, distribution and/or shareholder support services. These fees and payments range from 0% to 0.60% of the unaffiliated Portfolios’ average daily net assets. The Distributors may also receive payments from the advisers or sub-advisers of the unaffiliated Portfolios or their affiliates for certain distribution services, including expenses for sales meetings or seminar sponsorships that may relate to the contracts and/or the advisers’ respective Portfolios.
As a contract owner, you may bear the costs of some or all of these fees and payments through your indirect investment in the Portfolios. (See the Portfolios’ prospectuses for more information.) These fees and payments, as well as the Portfolios’ investment advisory fees and administration expenses, will reduce the underlying Portfolios’ investment returns. The Company and/or its affiliates may profit from these fees and payments. The Company considers the availability of these fees and payment arrangements during the selection process for the underlying Portfolios. These fees and payment arrangements may create an incentive for us to select Portfolios (and classes of shares of Portfolios) that pay us higher amounts.
Some affiliated Portfolios invest in other affiliated Portfolios (the “EQ Fund of Fund Portfolios”). The EQ Fund of Fund Portfolios offer contract owners a convenient opportunity to invest in other Portfolios that are managed and have been selected for inclusion in the EQ Fund of Fund Portfolios by Equitable IMG. Equitable Advisors, an affiliated broker-dealer of the Company, may promote the benefits of such Portfolios to contract owners and/or suggest that contract owners consider whether allocating some or all of their account value to such Portfolios is consistent with their desired investment objectives. In doing so, the Company, and/or its affiliates, may be subject to conflicts of interest insofar as the Company may derive greater revenues from the EQ Fund of Fund Portfolios than certain other Portfolios available to you under your contract. Please see “Allocating your contributions” in this section for more information about your role in managing your allocations.
As described in more detail in the Portfolio prospectuses, the EQ Managed Volatility Portfolios may utilize a proprietary volatility management strategy developed by Equitable IMG (the “EQ volatility management strategy”) and, in addition, certain EQ Fund of Fund Portfolios may invest in affiliated Portfolios that utilize this strategy. The EQ volatility management strategy employs
various volatility management techniques, such as the use of ETFs or futures and options, to reduce the Portfolio’s equity exposure during periods when certain market indicators indicate that market volatility is above specific thresholds set for the Portfolio. When market volatility is increasing above the specific thresholds set for a Portfolio utilizing the EQ volatility management strategy, the adviser of the Portfolio may reduce equity exposure. Although this strategy is intended to reduce the overall risk of investing in the Portfolio, it may not effectively protect the Portfolio from market declines and may increase its losses. Further, during such times, the Portfolio’s exposure to equity securities may be less than that of a traditional equity portfolio. This may limit the Portfolio’s participation in market gains and result in periods of underperformance, including those periods when the specified benchmark index is appreciating, but market volatility is high.
The EQ Managed Volatility Portfolios that include the EQ volatility management strategy as part of their investment objective and/or principal investment strategy, and the EQ Fund of Fund Portfolios that invest in Portfolios that use the EQ volatility management strategy, are identified in the Appendix: “Investment options available under the contract” by a “†”.
Portfolios that utilize the EQ volatility management strategy (or, in the case of certain EQ Fund of Fund Portfolios, invest in other Portfolios that use the EQ volatility management strategy) are designed to reduce the overall volatility of your account value and provide you with risk-adjusted returns over time. During rising markets, the EQ volatility management strategy, however, could result in your account value rising less than would have been the case had you been invested in a Portfolio that does not utilize the EQ volatility management strategy (or, in the case of the EQ Fund of Fund Portfolios, invest exclusively in other Portfolios that do not use the EQ volatility management strategy). Conversely, investing in investment options that use the EQ volatility management strategy may be helpful in a declining market when high market volatility triggers a reduction in the investment option’s equity exposure because during these periods of high volatility, the risk of losses from investing in equity securities may increase. In these instances, your account value may decline less than would have been the case had you not been invested in investment options that use the EQ volatility management strategy. Please see the underlying Portfolio prospectuses for more information in general, as well as more information about the EQ volatility management strategy. See also Appendix “Investment options available under the contract” for more information.
Certain other affiliated Portfolios, as well as unaffiliated Portfolios, may utilize volatility management techniques (including Fund of Fund Portfolios that invest in other Portfolios that utilize volatility management techniques) that differ from the EQ volatility management strategy. Such techniques could also impact your Total account value and guaranteed benefit(s), if any, in the same manner described above.
Please see the Portfolio prospectuses for more information in general, as well as more information about the Portfolio’s objective, strategies, and volatility management techniques. See also Appendix “Investment options available under the contract” for more information. Asset Transfer Program.
Portfolio allocations in certain of our variable annuity contracts with guaranteed benefits are subject to our Asset Transfer Program (ATP) feature. The ATP helps us manage our financial exposure in connection with providing certain guaranteed benefits, by using predetermined mathematical formulas to move account value between the EQ/Ultra Conservative Strategy Portfolio (an investment option utilized solely by the ATP) and the other Portfolios offered under those contracts. You should be aware that operation of the predetermined mathematical formulas underpinning the ATP has the potential to adversely impact the Portfolios, including their performance, risk profile and expenses. This means that Portfolio investments in contracts with no ATP feature, such as yours, could still be adversely impacted. Particularly during times of high market volatility, if the ATP triggers substantial asset flows into and out of a Portfolio, it could have the following effects on all contract owners invested in that Portfolio:
| (a) | By requiring a Portfolio sub-adviser to buy and sell large amounts of securities at inopportune times, a Portfolio’s investment performance and the ability of the sub-adviser to fully implement the Portfolio’s investment strategy could be negatively affected; and |
| (b) | By generating higher turnover in its securities or other assets than it would have experienced without being impacted by the ATP, a Portfolio could incur higher operating expense ratios and transaction costs than comparable funds. In addition, even Portfolios structured as funds-of-funds that are not available for investment by contract owners who are subject to the ATP could also be impacted by the ATP if those Portfolios invest in underlying funds that are themselves subject to significant asset turnover caused by the ATP. Because the ATP formulas generate unique results for each contract, not all contract owners who are subject to the ATP will be affected by operation of the ATP in the same way. On any particular day on which the ATP is activated, some contract owners may have a portion of their account value transferred to the EQ/Ultra Conservative Strategy Portfolio investment option and others may not. If the ATP causes significant transfers of total account value out of one or more Portfolios, any resulting negative effect on the performance of those Portfolios will be experienced to a greater extent by a contract owner (with or without the ATP) invested in those Portfolios whose account value was not subject to the transfers. |
Fixed investment options
Information regarding each currently offered fixed investment option, including its name, its term and its minimum guaranteed interest rate is available in an appendix to this prospectus. See Appendix “Investment options available under the contract”.
Guaranteed interest option
The guaranteed interest option is a fixed option that is part of our general account and pays interest at guaranteed rates. We discuss our general account in “More information” in this Prospectus.
We assign an interest rate to each amount allocated to the guaranteed interest option. This rate is guaranteed for a specified period. The rate may be different depending upon certain factors including the type and series of your contract and when the allocation is made. Therefore, different interest rates may apply to different amounts in the guaranteed interest option.
We credit interest daily to amounts in the guaranteed interest option. The minimum rate may vary depending on when your contract is issued but it will be shown on the data page for your contract and will never be less than 1.0%.
We set current interest rates periodically, according to our procedures that we have in effect at the time. All interest rates are effective annual rates, but before deduction of annual administrative charges or any withdrawal charges.
We reserve the right to limit contributions to the guaranteed interest option. See “Allocating your contributions” in this section for more information.
There is no market value adjustment deduction in connection with any transfer of account value out of the guaranteed interest option due to changes in interest rates. A withdrawal from the certificate itself, however, may result in a withdrawal charge. For more information, see “Withdrawal charge” under “Charges, expenses, and adjustments” in this prospectus.
Fixed maturity options
The fixed maturity option is part of our general account and pays interest at guaranteed rates. The guaranteed minimum We discuss our general account in “More information” in this prospectus. We offer fixed maturity options with maturity dates generally ranging from one to ten years. The minimum guaranteed rate of interest is 3%. If you make any withdrawals (including transfers, surrender or termination of your contract, or when we make deductions for charges) from a fixed maturity option before it matures, we will make a market value adjustment, which will increase or decrease any fixed maturity amount you have in that fixed maturity option. Please see “Fixed maturity options” later in this section for more information.
Selecting your investment method for variable investment options
You must choose one of the following methods for selecting your variable investment options:
| • | Maximum investment options choice. |
| • | Maximum transfer flexibility. |
Please see options A and B in the investment options chart in the Appendix: “Investment options available under the contract” in this prospectus.
Temporary removal of transfer restrictions that apply to the investment methods.
From time to time, we may remove certain restrictions that apply to your investment method. If we do so, we will tell you. For example, if you elect the “Maximum investment options choice” method, for a limited time, there will be no restrictions on the amount you can transfer out of the guaranteed interest option listed in group “A.” If you elect the “Maximum transfer flexibility” method, for a limited time, you will be able to use the fixed income variable investment options listed in group “B” as well as the fixed maturity options.
We will also tell you at least 45 days in advance of the day that we intend to reimpose the transfer restrictions. When we reimpose the transfer restrictions, if you elect the “Maximum investment options choice” method, limits on transfers out of the guaranteed interest option will again apply. If you elect the “Maximum transfer flexibility” method, you will no longer be permitted to allocate new contributions to, or transfer amounts into the variable investment options in group “B” (including through our rebalancing program) or the fixed maturity options. However, amounts that are in any investment options that are not available under “Maximum transfer flexibility” can remain in these options.
Please see options A and B in the investment options chart in the Appendix: “Investment options available under the contract” in this prospectus.
The Target Date Allocation investment options (which invest in the corresponding Target Date Allocation portfolios) are expected to invest more heavily in fixed income securities as they approach their respective target dates, and thereafter. See Appendix: “Investment options available under the contract” for a list of the Target Date Allocation portfolios. As each Target Date Allocation investment option reaches its respective target date, we reserve the right to make it a group “B” investment option. Please note that if you select the “Maximum transfer flexibility” method, and you allocate any contributions or account value to any of the Target Date Allocation investment options, you will be deemed to have changed to the “Maximum investment options choice” method. This change to your investment method will occur when you change your allocation instruction to include a Target Date Allocation investment option or when you make a transfer to a Target Date Allocation investment option that has been reassigned. We will notify you of this change in writing. Please note that if this occurs, the
number of variable investment options available to you will increase. In other words, the “B” investment options will be available to you. However, your ability to transfer out of the guaranteed interest option will be limited.
If you select the “Maximum transfer flexibility” method but have not included any of the Target Date Allocation investment options among your allocations, you will not be changed to the alternate method but those options will no longer be available to you.
You may currently choose from any of the investment options available under your investment method. In all cases, if any of the options listed in B in the chart in the Appendix: “Investment options available under the contract” are selected, you will be subject to the restrictions on transfers out of the guaranteed interest option that apply under the “Maximum investment options choice” investment method.
Fixed maturity options
We offer fixed maturity options with maturity dates generally ranging from one to ten years. The minimum guaranteed rate of interest is 3%. We will not accept allocations to a fixed maturity option if on the date the contribution or transfer is to be applied the rate to maturity (e.g., the crediting rate) is 3%. This means that at points in time there may be no fixed maturity options available. You can allocate your contributions to one or more of these fixed maturity options. However, you may not allocate more than one contribution to any one fixed maturity option. These amounts become part of a non-unitized separate account. They will accumulate interest at the “rate to maturity” for each fixed maturity option. The total amount you allocate to and accumulate in each fixed maturity option is called the “fixed maturity amount.” The fixed maturity options may not be available in all or all states. See Appendix: “State contract availability and/or variations of certain features and benefits” for more information. See also “Charges, expenses, and adjustments” in this prospectus for information on withdrawal charges when amounts are allocated to the fixed maturity options.
The rate to maturity you will receive for each fixed maturity option is the rate to maturity in effect for new contributions allocated to that fixed maturity option on the date we apply your contribution.
On the maturity date of a fixed maturity option, your fixed maturity amount, assuming you have not made any withdrawals or transfers, will equal your contribution to that fixed maturity option plus interest, at the rate to maturity for that contribution. This is the fixed maturity option’s “maturity value.” Before maturity, the current value we will report for your fixed maturity amount will reflect a market value adjustment. Your current value will reflect the market value adjustment that we would make if you were to withdraw all of your fixed maturity amounts on the date of the report. We call this your “market adjusted amount.”
Fixed maturity options and maturity dates.
maturity years ranging from one through ten. Not all of these fixed maturity options will be available for annuitant ages 76 and above. See “Allocating your contributions” in this prospectus for more information. in this prospectus. As fixed maturity options expire, we expect to add maturity years so that generally ten fixed maturity options are available at any time.
If a fixed maturity option is scheduled to mature on June 15th and June 15th is a non-business day, that fixed maturity option will mature on the prior business day.
We will not accept allocations to a fixed maturity option if on the date the contribution is to be applied:
| • | you previously allocated a contribution or made a transfer to the same fixed maturity option; or |
| • | the rate to maturity is 3%; or |
| • | the fixed maturity option’s maturity date is within 45 days; or |
| • | the fixed maturity option’s maturity date is later than the date annuity payments are to begin. |
Contributions allocated to a fixed maturity option will receive the rate to maturity in effect for that fixed maturity option on that business day.
Your choices at the maturity date.
| (a) | transfer the maturity value into another available fixed maturity option, or into any of the variable investment options; or |
| (b) | withdraw the maturity value (there may be a withdrawal charge). |
The rates to maturity are determined weekly. Current rates to maturity for the fixed maturity options can be obtained from your financial professional or us. Please see “How to reach us” for detailed information on how to reach us.
If we do not receive your choice on or before the fixed maturity option’s maturity date, we will automatically transfer your maturity value into the next available fixed maturity option (or another investment option if we are required to do so by any state regulation). We may change our procedures in the future.
Market value adjustment.
| (a) | the difference between the rate to maturity that applies to the amount being withdrawn and the rate to maturity in effect at that time for new allocations to that same fixed maturity option, and |
| (b) | the length of time remaining until the maturity date. |
In general, if interest rates rise from the time that you originally allocate an amount to a fixed maturity option to the time that you take a withdrawal, the market value adjustment will be negative. Likewise, if interest rates drop at the end of that time, the market value adjustment will be positive. Also, the amount of the market value adjustment, either up or down, will be greater the longer the time remaining until the fixed maturity option’s maturity date. Therefore, it is possible that the market value adjustment could greatly reduce your value in the fixed maturity options, particularly in the fixed maturity options with later maturity dates. You could lose a significant amount of money due to a market value adjustment if amounts are removed from a fixed maturity option prior to maturity.
Rates to maturity and price per $100 of maturity value
We can determine the amount required to be allocated to one or more fixed maturity options in order to produce
specified maturity values. For example, we can tell you how much you need to allocate per $100 of maturity value.
The rates to maturity are determined weekly. The rates in the table below are illustrative only and will most likely differ from the rates applicable at time of purchase. Current rates to maturity can be obtained from your financial professional or us. Please see “How to reach us” for detailed information on how to reach us.
The rates to maturity for new allocations and the related price per $100 of maturity value are as shown below:
Fixed Maturity Options with June 15th Maturity Date of Maturity Year |
Rate to Maturity as of February 15, 2026 |
Price Per $100 of Maturity Value | ||
2026 |
3.00% (2) |
$99.03 | ||
2027 |
3.00% (2) |
$96.15 | ||
2028 |
3.00% (2) |
$93.34 | ||
2029 |
3.00% (2) |
$90.63 | ||
2030 |
3.00% (2) |
$87.99 | ||
2031 |
3.00% (2) |
$85.43 | ||
2032 |
3.00% (2) |
$82.93 | ||
2033 (1) |
3.00% (2) |
$80.53 | ||
2034 (1) |
3.00% (2) |
$78.19 | ||
2035 (1) |
3.05% |
$75.57 |
(1) |
Not available in Oregon. |
| (2) | Since these rates to maturity are 3%, no amounts could have been allocated to these options. |
How we determine the market value adjustment
We use the following procedure to calculate the market value adjustment (up or down) we make if you withdraw all
of your value from a fixed maturity option before its maturity date.
| (1) | We determine the market adjusted amount on the date of the withdrawal as follows: |
| (a) | We determine the fixed maturity amount that would be payable on the maturity date, using the rate to maturity for the fixed maturity option. |
| (b) | We determine the period remaining in your fixed maturity option (based on the withdrawal date) and convert it to fractional years based on a 365-day year. For example, three years and 12 days becomes 3.0329. |
| (c) | We determine the current rate to maturity that applies on the withdrawal date to new allocations to the same fixed maturity option. |
| (d) | We determine the present value of the fixed maturity amount payable at the maturity date, using the period determined in (b) and the rate determined in (c). |
| (2) | We determine the fixed maturity amount as of the current date. |
| (3) | We subtract (2) from the result in (1)(d). The result is the market value adjustment applicable to such fixed maturity option, which may be positive or negative. |
Your market adjusted amount is the present value of the maturity value discounted at the rate to maturity in effect for new contributions to that same fixed maturity option on the date of the calculation.
If you withdraw only a portion of the amount in a fixed maturity option, the market value adjustment will be a percentage of the market value adjustment that would have applied if you had withdrawn the entire value in that fixed maturity option. This percentage is equal to the percentage of the value in the fixed maturity option that you are withdrawing. Any withdrawal charges that are deducted from a fixed maturity option will result in a market value adjustment calculated in the same way. See “Appendix: Market value adjustment example” in the Statement of Additional Information for an example.
For purposes of calculating the rate to maturity for new allocations to a fixed maturity option (see (1)(c) above), we use the rate we have in effect for new allocations to that fixed maturity option. We use this rate even if new allocations to that option would not be accepted at that time. This rate will not be less than 3%. If we do not have a rate to maturity in effect for a fixed maturity option to which the “current rate to maturity” in (1)(c) above would apply, we will use the rate at the next closest maturity date. If we are no longer offering new fixed maturity options, the “current rate to maturity” will be determined in accordance with our procedures then in effect. We reserve the right to add up to 0.50% to the current rate in (1)(c) above for purposes of calculating the market value adjustment only.
Allocating your contributions
Once you have made your investment method choice, you may allocate your contributions to one or more, or all of the investment options that you have chosen, subject to any restrictions under the investment method you chose. However, you may not allocate more than one contribution to any one fixed maturity option. If the annuitant is age 76 or older, you may only allocate contributions to fixed maturity options with maturities of five years or less. Allocations must be in whole percentages and you may change your allocation percentages at any time. However, the total of your allocations must equal 100%. Additional contributions are allocated according to instructions on file unless you provide us with new instructions. Once your contributions are allocated to the investment options, they become part of your account value. We discuss account value in “Determining your contract’s value” in this prospectus. After your contract is issued, you may request that we add or eliminate any variable investment options that result in transfer restrictions. We reserve the right to deny your request. See “Transferring your money among investment options” in this prospectus.
The contract is between you and the Company. The contract is not an investment advisory account, and the Company is not providing any investment advice or managing the allocations under your contract. In the absence of a specific written arrangement to the contrary, you, as the owner of the contract, have the sole authority to make investment allocations and other decisions under the contract. Your Equitable Advisors, LLC (“Equitable Advisors”) financial professional is acting as a broker-dealer registered representative, and is not authorized to act as an investment advisor or to manage the allocations under your contract. If your financial professional is a registered representative with a broker-dealer other than Equitable Advisors, you should speak with him/her regarding any different arrangements that may apply.
Your right to cancel within a certain number of days
This is provided for informational purposes only. Since the contracts are no longer available to new purchasers, this cancellation provision is no longer applicable.
If for any reason you are not satisfied with your contract, you may return it to us for a refund. To exercise this cancellation right you must mail the contract directly to our processing office within 10 days after you receive it. In some states, this “free look” period may be longer.
For contributions allocated to the variable investment options, your refund will equal your contributions, reflecting any investment gain or loss that also reflects the daily charges we deduct. For contributions allocated to the fixed maturity options, your refund will equal the amount of the contribution allocated to the fixed maturity options reflecting any positive or negative market value adjustments. Some states require that we refund the full amount of your contribution (not including any investment gain or loss, interest, or market value adjustment). For contributions allocated to the guaranteed interest option, your refund will equal the amount of the contribution. For an IRA contract returned to us within seven days after you receive it, we are required to refund the full amount of your contribution. When required by applicable law to return the full amount of your contribution, we will return the greater of your contribution or your contract’s cash value.
Fixed maturity options
We offer fixed maturity options with maturity dates generally ranging from one to ten years. The minimum guaranteed rate of interest is 3%. We will not accept allocations to a fixed maturity option if on the date the contribution or transfer is to be applied the rate to maturity (e.g., the crediting rate) is 3%. This means that at points in time there may be no fixed maturity options available. You can allocate your contributions to one or more of these fixed maturity options. However, you may not allocate more than one contribution to any one fixed maturity option. These amounts become part of a non-unitized separate account. They will accumulate interest at the “rate to maturity” for each fixed maturity option. The total amount you allocate to and accumulate in each fixed maturity option is called the “fixed maturity amount.” The fixed maturity options may not be available in all or all states. See Appendix: “State contract availability and/or variations of certain features and benefits” for more information. See also “Charges, expenses, and adjustments” in this prospectus for information on withdrawal charges when amounts are allocated to the fixed maturity options.
The rate to maturity you will receive for each fixed maturity option is the rate to maturity in effect for new contributions allocated to that fixed maturity option on the date we apply your contribution.
Your choices at the maturity date.
| (a) | transfer the maturity value into another available fixed maturity option, or into any of the variable investment options; or |
| (b) | withdraw the maturity value (there may be a withdrawal charge). |
Market Value Adjustments
If you make any withdrawals (including transfers, surrender or termination of your contract, or when we make deductions for charges) from a fixed maturity option before it matures, we will make a market value adjustment, which will increase or decrease any fixed maturity amount you have in that fixed maturity option. The market value adjustment for amounts withdrawn from a fixed maturity option before maturity could result in up to a 100% loss of your investment in the fixed maturity option in extreme situations. The amount of the adjustment will depend on two factors:
| (a) | the difference between the rate to maturity that applies to the amount being withdrawn and the rate to maturity in effect at that time for new allocations to that same fixed maturity option, and |
| (b) | the length of time remaining until the maturity date. |
In general, if interest rates rise from the time that you originally allocate an amount to a fixed maturity option to the time that you take a withdrawal, the market value adjustment will be negative. Likewise, if interest rates drop at the end of that time,
the market value adjustment will be positive. Also, the amount of the market value adjustment, either up or down, will be greater the longer the time remaining until the fixed maturity option’s maturity date. Therefore, it is possible that the market value adjustment could greatly reduce your value in the fixed maturity options, particularly in the fixed maturity options with later maturity dates. For more information about the market value adjustment, including examples illustrating the operation of the market value adjustment, please see the Statement of Additional Information.
The market value adjustment transfers risk from us to you to protect us from losses on our investments supporting the fixed maturity options if amounts are removed prematurely.
You can obtain the market value adjustment for the fixed maturity options in which you invest by calling (800) 628-6673. This value can fluctuate daily, and the current value quoted may differ from the actual market value adjustment at the time of a transaction. Please see “How to reach us” for more information.
2.
Benefits available under the contract Summary of Benefits
The following tables summarize important information about the benefits available under the contract.
Death Benefits
This death benefit is available during the accumulation phase:
Name of Benefit |
Purpose |
Standard/ Optional |
Annual Fee |
Brief Description of Restrictions/ Limitations | ||||||
Max |
Current | |||||||||
| Death Benefit | Guarantees beneficiaries will receive a benefit at least equal to your contributions less adjusted withdrawals. | Standard | No Additional Charge |
• Withdrawals could significantly reduce or terminate benefit | ||||||
Other Benefits
These other benefits are available during the accumulation phase:
Name of Benefit |
Purpose |
Standard/ Optional |
Annual Fee |
Brief Description of Restrictions/ Limitations | ||||||
Max |
Current | |||||||||
Rebalancing Option I (1) and Option II(2) |
Periodically rebalance to your desired asset mix. | Optional | No Charge | • Not generally available with Dollar Cost Averaging • Investment simplifier automatic options are not available with rebalancing option II | ||||||
Dollar Cost Averaging and Investment Simplifier |
Transfer account value to selected investment options on a regular basis to potentially reduce the impact of market volatility. | Optional | No Charge | • Not generally available with Rebalancing | ||||||
| (1) | Option I allows you to rebalance your account value among the variable investment options. |
| (2) | Option II allows you to rebalance your account value among the variable investment options and the guaranteed interest option. |
About Death Benefits
Payment of Death Benefit
You designate your beneficiary when you apply for your contract. You may change your beneficiary at any time while the contract is in force and the owner and annuitant are alive. The change will be effective as of the date the written request is executed, whether or not you are living on the date the change is received at our processing office. We are not responsible for any beneficiary change request that we do not receive. We will send you a written confirmation when we receive your request.
Death benefit
The death benefit is equal to the greater of (i) your account value (without adjustment for any otherwise applicable negative market value adjustment) as of the date we receive satisfactory proof of the annuitant’s death, any required instructions for the method of payment, information and forms necessary to effect payment and (ii) the “minimum death benefit.” The minimum death benefit is equal to your total contributions, adjusted for withdrawals, withdrawal charges, and taxes that apply. There is no additional charge for this death benefit.
If your surviving spouse rolls the death benefit proceeds over into a contract issued by us, the death proceeds will remain invested in this contract until your spouse’s contract is issued and the amount of the death benefit will be calculated as of the date we receive all requirements necessary to issue your spouse’s new contract. The amount of the death benefit will be calculated to equal the greater of (i) your account value (without adjustment for any otherwise applicable negative market value adjustment) as of the date that your spouse’s contract is issued, and (ii) the “minimum death benefit” as of the date of your death. This means that the death benefit proceeds could vary up or down, based on investment performance, until your spouse’s new contract is issued.
How withdrawals affect the minimum death benefit
Depending upon contract series, contract date and the state where your contract is issued, each withdrawal you make will reduce the amount of your current minimum death benefit on a pro rata basis. Reduction on a pro rata basis means that we calculate the percentage of your current account value that is being withdrawn (including the amount of any withdrawal charge deducted from the contract) and we reduce your current minimum death benefit by that same percentage. For example, if your account value is $30,000, and you withdraw $12,000 you have withdrawn 40% of your account value. If your minimum death benefit was $40,000 before the withdrawal, it would be reduced by $16,000 ($40,000 x .40) and your new minimum death benefit after the withdrawal would be $24,000 ($40,000-$16,000). As this example shows,
the pro rata reduction of the death benefit can be greater than the dollar amount of the withdrawal
. Check with your financial professional. Effect of the annuitant’s death
If the annuitant dies before the annuity payments begin, we will pay the death benefit to your beneficiary.
Generally, the death of the annuitant terminates the contract. However, if you are both the owner and the annuitant and your spouse is the sole primary beneficiary, the contract can be continued as discussed below under “Successor owner and annuitant.” Only a spouse who is the sole primary beneficiary can be a successor owner/ annuitant. The determination of spousal status is made under applicable state law; however, in the event of a conflict between federal and state law, we follow federal rules. A beneficiary may be able to have limited ownership as discussed under “Beneficiary continuation option” below.
Successor Owner and Annuitant: traditional IRA, QP IRA, NQ and Roth IRA contracts (may not be available in all states for some series).
If you are the owner and annuitant and your spouse is the sole primary beneficiary, your spouse may elect upon your death to continue the contract as the owner/annuitant and no death benefit is payable until the surviving spouse’s death. If your surviving spouse decides to continue the contract, as of the date we receive satisfactory proof of death, any required instructions, information and forms necessary to effect the successor owner/annuitant feature, we will increase the account value to equal your minimum death benefit, if such death benefit is greater than such account value. The increase in the account value will be allocated to the investment options according to the allocation percentages we have on file for your contract. Thereafter, withdrawal charges will no longer apply to contributions made before your death. Withdrawal charges will apply if additional contributions are made. These additional contributions will be withdrawn only after all other amounts have been withdrawn. For series 100 and 200 IRA contracts, withdrawal charges will no longer apply and additional contributions may no longer be made. The minimum death benefit will continue to apply.
When an NQ contract owner dies before the annuitant
Under certain conditions after the original owner’s death, the owner changes for purposes of receiving federal tax law required distributions from your contract. When you are not the annuitant under an NQ contract and you die before annuity payments begin, unless you specify otherwise, we will automatically make the beneficiary your successor owner. If you do not want this beneficiary also to be the successor owner, you should name a specific successor owner. You may name a successor at any time while the contract is in force and the owner and annuitant are alive by sending satisfactory notice to our processing office.
Unless the surviving spouse of the owner who has died is the successor owner for this purpose, the entire interest in the contract must be distributed under the following rules:
| • | The cash value of the contract must be fully paid to the successor owner (new owner) within five years after your death. |
| • | The successor owner may instead elect to receive the cash value as a life annuity (or payments for a period certain of not longer than the new owner’s life expectancy). Payments must begin within one year after the non-annuitant owner’s death. Unless this alternative is elected, we will pay any cash value five years after your death. |
If the surviving spouse is the successor owner, the spouse may elect to continue the contract. No distributions are required as long as the surviving spouse and annuitant are living. The account value must be distributed no later than 5 years after the spouse’s death.
How death benefit payment is made
We will pay the death benefit to the beneficiary in the form of the annuity payout option you have chosen, if the option is permitted under federal tax rules in effect after your death.
If you have not chosen an annuity payout option as of the time of the annuitant’s death, the beneficiary will receive the death benefit in a single sum. However, subject to any exceptions in the contract, our rules and any applicable requirements under federal income tax rules, the beneficiary may elect to apply the death benefit to one or more annuity payout options we offer at the time. See “Your annuity payout options” under “Accessing your money” earlier in this Prospectus. Please note that any annuity payout option chosen may not extend beyond the life expectancy of the beneficiary.
If the beneficiary is a natural person (i.e., not an entity such as a corporation or a trust) and so elects, death benefit proceeds can be paid through the “Equitable Access Account,” which is a draft account that works in certain respects like an interest-bearing checking account. In that case, we will send the beneficiary a draftbook, and the beneficiary will have immediate access to the proceeds by writing a draft for all or part of the amount of the death benefit proceeds. The Company will retain the funds until a draft is presented for payment. Interest on the Equitable Access Account is earned from the date we establish the account until the account is closed by your beneficiary or by us if the account balance falls below the minimum balance requirement, which is currently $1,000. The Equitable Access Account is part of the Company’s general account and is subject to the claims of our creditors. We will receive any investment earnings during the period such amounts remain in the general account. The Equitable Access Account is not a bank account or a checking account and it is not insured by the FDIC. Funds held by insurance companies in the general account are guaranteed by the respective state guaranty association.
Beneficiary continuation option for traditional IRA, QP IRA, Roth IRA and Roth Advantage contracts
Upon your death under a traditional IRA, QP IRA, Roth IRA, or Roth Advantage contract, your beneficiary may generally elect to keep the contract with your name on it and receive distributions under the contract instead of receiving the death benefit in a single sum. The beneficiary continuation option may not be available in all states for some series. Depending on the beneficiary, this option may be restricted or may no longer be available for deaths after December 31, 2019, due to the changes made by the Setting Every Community Up for Retirement Enhancement Act (“SECURE Act”) enacted at the end of 2019. We may be required in certain cases to pay benefits faster under existing contracts.
If eligible, your beneficiary can elect to receive payments over your beneficiary’s life expectancy (determined in the calendar year after your death and determined on a term certain basis). This feature must be elected by September 30th of the year following the calendar year of your death and before any other inconsistent election is made. Beneficiaries who do not make a timely election will not be eligible for this option. These payments must begin no later than December 31st of the calendar year after the year of your death. If the election is made, then as of the date we receive satisfactory proof of death, any required instructions, information and forms necessary to effect the beneficiary continuation option feature, we will increase the account value to equal the applicable death benefit if such death benefit is greater then such account value.
For deaths after December 31, 2019, only specified individuals who are “eligible designated beneficiaries” or “EDBs” may generally stretch post-death payments over the beneficiary’s life expectancy. See “required minimum distributions after your death” in this prospectus under “Tax Information.” Individual beneficiaries who do not have EDB status (including beneficiaries named by the original beneficiary to receive any remaining interest after the death of the original beneficiary) must take out any remaining interest in the IRA or plan within 10 years of the applicable death in accordance with federal tax rules.
Under the beneficiary continuation option:
| • | The contract continues with your name on it for the benefit of your beneficiary. |
| • | This feature is only available if the beneficiary is an individual. Certain trusts with only individual beneficiaries will be treated as individuals for this purpose. |
| • | If there is more than one beneficiary, each beneficiary’s share will be separately accounted for. It will be distributed over the beneficiary’s own life expectancy, if payments over life expectancy are chosen by an eligible beneficiary. |
| • | The minimum amount that is required in order to elect the beneficiary continuation option is $5,000 for each beneficiary. |
| • | The beneficiary may make transfers among the investment options, but no additional contributions will be permitted. |
| • | The minimum death benefit provision will no longer be in effect. |
| • | The beneficiary may choose at any time to withdraw all or a portion of the account value and no withdrawal charges will apply. Any partial withdrawal must be at least $300. |
| • | Your beneficiary will have the right to name a beneficiary to receive any remaining interest in the contract. |
| • | Upon the death of your beneficiary, the following distribution rules will apply to the subsequent beneficiary |
named by your beneficiary: (1) if your beneficiary is an EDB or you died on or before December 31, 2019, the subsequent beneficiary must withdraw any remaining amount within ten years of your beneficiary’s death in accordance with federal tax rules; or (2) if your beneficiary is not an EDB, the subsequent beneficiary must withdraw any remaining amount within 10 years of your death in accordance with federal tax rules. The option elected will be processed when we receive satisfactory proof of death, any required instructions for the method of payment and any required information and forms necessary to effect payment. |
Beneficiary continuation option for series 400 NQ contracts only
This feature (also known as inherited annuity), may only be elected when the NQ contract owner dies before the date annuity payments are to begin, whether or not the owner and the annuitant are the same person. If the owner and annuitant are different and the owner dies before the annuitant, for purposes of this discussion, “beneficiary” refers to the successor owner. For a discussion of successor owner, see “When an NQ contract owner dies before the annuitant” earlier in this section.
This feature must be elected within 9 months following the date of your death and before any other inconsistent election is made. Beneficiaries who do not make a timely election will not be eligible for this option.
Generally, payments will be made once a year to the beneficiary over the beneficiary’s life expectancy, determined on a term certain basis and in the year payments start. These payments must begin no later than one year after the date of your death and are referred to as “scheduled payments.” The beneficiary may choose the
“5-year
rule” instead of scheduled payments over life expectancy. If the beneficiary chooses the 5-year
rule, there will be no scheduled payments. Under the 5-year
rule, the beneficiary may take withdrawals as desired, but the entire account value must be fully withdrawn by the fifth anniversary of your death. Under the beneficiary continuation option for NQ contracts (regardless of whether the owner and annuitant are the same person):
| • | This feature is only available if the beneficiary is an individual. It is not available for any entity such as a trust, even if all of the beneficiaries of the trust are individuals. |
| • | The contract continues with your name on it for the benefit of your beneficiary. |
| • | If there is more than one beneficiary, each beneficiary’s share will be separately accounted for. It will be distributed over the respective beneficiary’s own life expectancy, if scheduled payments are chosen. |
| • | The minimum amount that is required in order to elect the beneficiary continuation option is $5,000 for each beneficiary. |
| • | The beneficiary may make transfers among the investment options but no additional contributions will be permitted. |
| • | The minimum death benefit will no longer be in effect. |
| • | If the beneficiary chooses the “5-year rule,” withdrawals may be made at any time. If the beneficiary instead chooses scheduled payments, the beneficiary may also take withdrawals, in addition to scheduled payments, at any time. |
| • | Any partial withdrawal must be at least $300. |
| • | Your beneficiary will have the right to name a beneficiary to receive any remaining interest in the contract on the beneficiary’s death. |
| • | Upon the death of your beneficiary, the beneficiary that he or she has named has the option to either continue taking scheduled payments based on the remaining life expectancy of the deceased beneficiary (if scheduled payments were chosen) or to receive any remaining interest in the contract in a lump sum. We will pay any remaining interest in the contract in a lump sum if your beneficiary elects the 5-year rule. The option elected will be processed when we receive satisfactory proof of death, any required instructions for the method of payment and any required information and forms necessary to effect payment. |
If you are both the owner and annuitant:
| • | As of the date we receive satisfactory proof of death, any required instructions, information and forms necessary to effect the beneficiary continuation option feature, we will increase the account value to equal the applicable death benefit if such death benefit is greater than such account value. The increase in account value will be allocated to the investment options according to the allocation percentages we have on file for your contract. |
| • | No withdrawal charges will apply to any withdrawals by the beneficiary. |
If the owner and annuitant are not the same person:
| • | If the beneficiary continuation option is elected, the beneficiary automatically becomes the new annuitant of the contract, replacing the existing annuitant. |
| • | The account value will not be reset to the death benefit amount. |
| • | The withdrawal charge schedule and free withdrawal amount on the contract will continue to be applied to any withdrawal or surrender other than scheduled payments. |
| • | We do not impose a withdrawal charge on scheduled payments except if, when added to any withdrawals previously taken in the same contract year, including for this purpose a contract surrender, the total amount of withdrawals and scheduled payments exceeds the free withdrawal amount. See “Withdrawal charge” in “Charges, expenses, and adjustments” earlier in this Prospectus. |
If a contract is jointly owned:
| • | The surviving owner supersedes any other named beneficiary and may elect the beneficiary continuation option. |
| • | If the deceased joint owner was also the annuitant, see “If you are both the owner and annuitant” above. |
| • | If the deceased joint owner was not the annuitant, see “If the owner and annuitant are not the same person” above. |
Other Benefits
Investment simplifier
Our Investment simplifier program allows you to choose from two automatic options for transferring amounts from the guaranteed interest option to the variable investment options. The transfer options are the “fixed-dollar option” and the “interest sweep.” You may select one or the other but not both. If you elect to use rebalancing option II (discussed below), you may not choose either of the investment simplifier options.
Fixed-dollar option.
Under this option, you may elect to have a fixed-dollar amount transferred out of the guaranteed interest option and into the variable investment options of your choice on a monthly basis. You can specify the number of monthly transfers or instruct us to continue to make monthly transfers until all available amounts in the guaranteed interest option have been transferred out.
In order to elect the fixed-dollar option, you must have a minimum of $5,000 in the guaranteed interest option on the
date we receive your election form at our processing office. You also must elect to transfer at least $50 per month. The fixed-dollar option is subject to the guaranteed interest option transfer limitation described above.
Interest sweep.
Under the interest sweep, we will make transfers on a monthly basis from amounts in the guaranteed interest option. The amount we will transfer will be the interest credited to amounts you have in the guaranteed interest option from the last business day of the prior month to the last business day of the current month. You must have at least $7,500 in the guaranteed interest option on the date we receive your election and on the last business day of each month thereafter to participate in the interest sweep option.
The fixed-dollar option and interest sweep feature are forms of dollar-cost averaging. Dollar-cost averaging allows you to gradually allocate amounts to the variable investment options by periodically transferring approximately the same dollar amount to the variable investment options you select. This will cause you to purchase more units if the unit’s value is low and fewer units if the unit’s value is high. Therefore, you may get a lower average cost per unit over the long term. This plan of investing, however, does not guarantee that you will earn a profit or be protected against losses.
When your participation in the investment simplifier will end.
Your participation in the investment simplifier option will end:
| • | Under the fixed-dollar option, when either the number of designated monthly transfers have been completed or the amount you have available in the guaranteed interest option has been transferred out. |
| • | Under the interest sweep, when the amount you have in the guaranteed interest option falls below $7,500 (determined on the last business day of the month) for two months in a row. |
| • | Under either option, on the date we receive at our processing office, your written request to cancel automatic transfers, or on the date your contract terminates. |
Rebalancing your account value
Our rebalancing program offers two options that you can use to automatically reallocate your account value. Option I permits reallocation among the variable investment options only and option II permits reallocation among the variable investment options and the guaranteed interest option. To enroll in the asset rebalancing program, you must notify us in writing by completing our asset rebalancing form, instructing us:
| (a) | in whole percentages only, the percentage you want invested in each variable investment option (and the guaranteed interest option, if applicable), and |
| (b) | how often you want the rebalancing to occur (quarterly, semi-annually, or annually). |
While your rebalancing program is in effect, we will transfer amounts among each variable investment option (and the guaranteed interest option, if applicable), so that the percentage of your account value that you specify is invested in each option at the end of each rebalancing date. Your entire account value in the variable investment options (and guaranteed interest option, if applicable) must be included in the rebalancing program. Currently, we permit rebalancing of up to 20 investment options. Transfer restrictions out of the guaranteed interest option may apply in accordance with the last two bullets under “Transferring your account value” above in this section. The initial transfer under the rebalancing program (based on your account value as of the day before the program is established) is not permitted to cause the transfer restrictions to be violated, and any rebalancing election that would be a violation of the transfer restrictions will not be put into effect. However, if the program can be established, once it is in effect, the transfer restrictions will be waived for the rebalancing transfers.
Rebalancing does not assure a profit or protect against loss. You should periodically review your allocation percentages as your needs change. You may want to discuss the rebalancing program with your financial professional and/or financial adviser before electing the program.
To be eligible, you must have (i) at least $5,000 of account value in the variable investment options for option I, or (ii) at least $5,000 of account value in the variable investment options and the guaranteed interest option, combined for
option II. Rebalancing is not available for amounts you have allocated in the fixed maturity options. We may waive this $5,000 requirement.
If you elect to use option II, you may not choose either of the investment simplifier automatic options.
You may elect or terminate the rebalancing program at any time. You may also change your allocations under the program at any time. Once enrolled in the rebalancing program, it will remain in effect until you instruct us in writing to terminate the program. Requesting an investment option transfer while enrolled in our rebalancing program will not automatically change your allocation instructions for rebalancing your account value. This means that upon the next scheduled rebalancing, we will transfer amounts among your investment options pursuant to the allocation instructions previously on file for your program. Changes to your allocation instructions for the rebalancing program (or termination of your enrollment in the program) must be in writing and sent to our processing office.
Summary of Benefits
The following tables summarize important information about the benefits available under the contract.
Death Benefits
This death benefit is available during the accumulation phase:
Name of Benefit |
Purpose |
Standard/ Optional |
Annual Fee |
Brief Description of Restrictions/ Limitations | ||||||
Max |
Current | |||||||||
| Death Benefit | Guarantees beneficiaries will receive a benefit at least equal to your contributions less adjusted withdrawals. | Standard | No Additional Charge |
• Withdrawals could significantly reduce or terminate benefit | ||||||
Other Benefits
These other benefits are available during the accumulation phase:
Name of Benefit |
Purpose |
Standard/ Optional |
Annual Fee |
Brief Description of Restrictions/ Limitations | ||||||
Max |
Current | |||||||||
Rebalancing Option I (1) and Option II(2) |
Periodically rebalance to your desired asset mix. | Optional | No Charge | • Not generally available with Dollar Cost Averaging • Investment simplifier automatic options are not available with rebalancing option II | ||||||
Dollar Cost Averaging and Investment Simplifier |
Transfer account value to selected investment options on a regular basis to potentially reduce the impact of market volatility. | Optional | No Charge | • Not generally available with Rebalancing | ||||||
| (1) | Option I allows you to rebalance your account value among the variable investment options. |
| (2) | Option II allows you to rebalance your account value among the variable investment options and the guaranteed interest option. |
Appendix: Investment options available under the contract
(a) Variable investment options
The following is a list of Portfolio Companies available under the contract. More information about the Portfolio Companies is available in the prospectuses for the Portfolio Companies, which may be amended from time to time and can be found online at www.equitable.com/ICSR#EQH146648. You can request this information at no cost by calling (877) 522-5035 or by sending an email request to EquitableFunds@dfinsolutions.com.
The current expenses and performance information below reflects fee and expenses of the Portfolios, but do not reflect the other fees and expenses that your contract may charge. Expenses would be higher and performance would be lower if these other charges were included. Each Portfolio’s past performance is not necessarily an indication of future performance.
Affiliated Portfolio Companies:
Current Expenses |
Average Annual Total Returns (as of 12/31/2025) |
|||||||||||||||||
TYPE |
Portfolio Company — Investment Adviser; Sub-Adviser(s), as applicable |
1 year |
5 year |
10 year |
||||||||||||||
Specialty |
1290 VT Convertible Securities — Equitable Investment Management Group, LLC (“EIMG”) ; SSGA Funds Management, Inc. |
0.90% |
^ |
15.79% |
2.91% |
8.89% |
||||||||||||
Equity |
1290 VT Equity Income — EIMG; Barrow, Hanley, Mewhinney & Strauss, LLC d/b/a Barrow Hanley Global Investors |
0.95% |
^ |
13.04% |
11.25% |
8.85% |
||||||||||||
Specialty |
1290 VT GAMCO Mergers & Acquisitions — EIMG; GAMCO Asset Management, Inc. |
1.29% |
^ |
15.91% |
7.70% |
5.38% |
||||||||||||
Equity |
1290 VT GAMCO Small Company Value — EIMG; GAMCO Asset Management, Inc. |
1.05% |
12.82% |
11.24% |
10.77% |
|||||||||||||
Fixed Income |
1290 VT High Yield Bond — EIMG; AXA Investment Managers US Inc., Post Advisory Group, LLC |
1.02% |
^ |
7.54% |
3.92% |
5.41% |
||||||||||||
Equity |
1290 VT Small Cap Value — EIMG; BlackRock Investment Management, LLC, Horizon Kinetics Asset Management LLC |
1.23% |
^ |
6.11% |
13.44% |
11.19% |
||||||||||||
Equity |
1290 VT SmartBeta Equity ESG — EIMG; AXA Investment Managers US Inc. |
1.10% |
13.95% |
10.21% |
10.74% |
|||||||||||||
Equity |
1290 VT Socially Responsible — EIMG; BlackRock Investment Management, LLC |
0.90% |
17.23% |
13.04% |
13.83% |
|||||||||||||
Equity |
EQ/2000 Managed Volatility† — EIMG; AllianceBernstein L.P., BlackRock Investment Management, LLC |
0.84% |
9.32% |
4.40% |
8.33% |
|||||||||||||
Equity |
EQ/400 Managed Volatility† — EIMG; AllianceBernstein L.P., BlackRock Investment Management, LLC |
0.85% |
^ |
3.31% |
7.06% |
9.21% |
||||||||||||
Equity |
EQ/500 Managed Volatility† — EIMG; AllianceBernstein L.P., BlackRock Investment Management, LLC |
0.80% |
13.33% |
12.43% |
13.15% |
|||||||||||||
Asset Allocation |
EQ/AB Dynamic Moderate Growth Δ — EIMG ; AllianceBernstein L.P. |
1.13% |
13.46% |
6.31% |
6.12% |
|||||||||||||
Equity |
EQ/AB Small Cap Growth — EIMG; AllianceBernstein L.P. |
0.92% |
9.21% |
3.43% |
10.10% |
|||||||||||||
Asset Allocation |
EQ/Aggressive Allocation† — EIMG |
1.15% |
12.97% |
7.79% |
9.47% |
|||||||||||||
Asset Allocation |
EQ/Aggressive Growth Strategy† — EIMG |
1.01% |
12.17% |
7.61% |
9.04% |
|||||||||||||
Asset Allocation |
EQ/All Asset Growth Allocation — EIMG |
1.25% |
^ |
17.18% |
7.12% |
8.28% |
||||||||||||
Equity |
EQ/American Century Mid Cap Value — EIMG; American Century Investment Management, Inc. |
1.00% |
^ |
8.72% |
8.64% |
— |
||||||||||||
Asset Allocation |
EQ/Balanced Strategy† — EIMG |
0.97% |
10.05% |
4.68% |
6.08% |
|||||||||||||
Equity |
EQ/Capital Group Research — EIMG; Capital International, Inc. |
0.95% |
^ |
19.83% |
13.80% |
15.00% |
||||||||||||
Equity |
EQ/ClearBridge Large Cap Growth ESG — EIMG; ClearBridge Investments, LLC |
1.00% |
^ |
7.69% |
10.47% |
13.63% |
||||||||||||
Equity |
EQ/ClearBridge Select Equity Managed Volatility† — EIMG; BlackRock Investment Management, LLC, ClearBridge Investments, LLC |
1.06% |
^ |
7.66% |
8.42% |
12.21% |
||||||||||||
Equity |
EQ/Common Stock Index — EIMG; AllianceBernstein L.P. |
0.67% |
^ |
16.30% |
12.50% |
13.54% |
||||||||||||
Asset Allocation |
EQ/Conservative Allocation† — EIMG |
1.00% |
^ |
7.48% |
1.74% |
3.11% |
||||||||||||
Asset Allocation |
EQ/Conservative Growth Strategy† — EIMG |
0.97% |
9.32% |
3.76% |
5.10% |
|||||||||||||
Asset Allocation |
EQ/Conservative Strategy† — EIMG |
0.95% |
7.86% |
1.93% |
3.12% |
|||||||||||||
Asset Allocation |
EQ/Conservative-Plus Allocation† — EIMG |
1.09% |
9.06% |
3.38% |
4.94% |
|||||||||||||
Current Expenses |
Average Annual Total Returns (as of 12/31/2025) |
|||||||||||||||||
TYPE |
Portfolio Company — Investment Adviser; Sub-Adviser(s), as applicable |
1 year |
5 year |
10 year |
||||||||||||||
Fixed Income |
EQ/Core Bond Index (1) — EIMG ; SSGA Funds Management, Inc. |
0.62% |
^ |
6.43% |
0.35% |
1.70% |
||||||||||||
Fixed Income |
EQ/Core Plus Bond — EIMG; Brandywine Global Investment Management, LLC, Loomis, Sayles & Company, L.P. |
0.93% |
^ |
8.53% |
-0.74% |
2.16% |
||||||||||||
Equity |
EQ/Emerging Markets Equity PLUS — EIMG; AllianceBernstein L.P., EARNEST Partners, LLC |
1.20% |
^ |
33.46% |
4.64% |
7.73% |
||||||||||||
Equity |
EQ/Equity 500 Index — EIMG; AllianceBernstein L.P. |
0.53% |
^ |
17.24% |
13.79% |
14.16% |
||||||||||||
Equity |
EQ/Fidelity Institutional AM ® Large Cap — EIMG ; FIAM LLC |
0.87% |
^ |
18.34% |
13.86% |
— |
||||||||||||
Equity |
EQ/Franklin Small Cap Value Managed Volatility† — EIMG; BlackRock Investment Management, LLC, Franklin Mutual Advisers, LLC |
1.05% |
^ |
7.06% |
6.11% |
8.71% |
||||||||||||
Equity |
EQ/Global Equity Managed Volatility† — EIMG; BlackRock Investment Management, LLC |
1.08% |
^ |
19.14% |
8.33% |
9.47% |
||||||||||||
Equity |
EQ/Goldman Sachs Mid Cap Value — EIMG; Goldman Sachs Asset Management L.P. |
1.09% |
^ |
9.22% |
9.66% |
— |
||||||||||||
Fixed Income |
EQ/Intermediate Government Bond (1) — EIMG ; SSGA Funds Management, Inc. |
0.62% |
^ |
5.51% |
0.30% |
1.14% |
||||||||||||
Equity |
EQ/International Core Managed Volatility† — EIMG; BlackRock Investment Management, LLC |
1.06% |
26.12% |
7.52% |
7.48% |
|||||||||||||
Equity |
EQ/International Equity Index — EIMG; AllianceBernstein L.P. |
0.72% |
^ |
31.53% |
9.91% |
8.07% |
||||||||||||
Equity |
EQ/International Managed Volatility† — EIMG; AllianceBernstein L.P., BlackRock Investment Management, LLC |
0.86% |
25.90% |
7.28% |
6.92% |
|||||||||||||
Equity |
EQ/International Value Managed Volatility† — EIMG; BlackRock Investment Management, LLC, Harris Associates LP |
1.04% |
26.66% |
7.75% |
6.77% |
|||||||||||||
Equity |
EQ/Invesco Comstock — EIMG; Invesco Advisers, Inc. |
1.00% |
^ |
16.93% |
14.99% |
11.71% |
||||||||||||
Equity |
EQ/Invesco Global — EIMG; Invesco Advisers, Inc. |
1.10% |
^ |
15.40% |
6.95% |
10.59% |
||||||||||||
Specialty |
EQ/Invesco Global Real Assets — EIMG; Invesco Advisers, Inc. |
1.16% |
15.93% |
7.11% |
— |
|||||||||||||
Equity |
EQ/Janus Enterprise — EIMG; Janus Henderson Investors US LLC |
1.04% |
8.05% |
7.06% |
10.61% |
|||||||||||||
Equity |
EQ/JPMorgan Growth Stock — EIMG; J.P. Morgan Investment Management Inc. |
0.96% |
^ |
14.76% |
9.43% |
14.08% |
||||||||||||
Equity |
EQ/JPMorgan Value Opportunities — EIMG; J.P. Morgan Investment Management Inc. |
0.95% |
15.40% |
12.77% |
12.08% |
|||||||||||||
Equity |
EQ/Large Cap Core Managed Volatility† — EIMG; BlackRock Investment Management, LLC |
0.88% |
10.88% |
12.03% |
12.83% |
|||||||||||||
Equity |
EQ/Large Cap Growth Index — EIMG; AllianceBernstein L.P. |
0.71% |
17.74% |
14.51% |
17.26% |
|||||||||||||
Equity |
EQ/Large Cap Growth Managed Volatility† — EIMG; BlackRock Investment Management, LLC |
0.87% |
11.06% |
11.64% |
15.01% |
|||||||||||||
Equity |
EQ/Large Cap Value Index — EIMG; AllianceBernstein L.P. |
0.74% |
15.04% |
10.52% |
9.77% |
|||||||||||||
Equity |
EQ/Large Cap Value Managed Volatility† — EIMG; AllianceBernstein L.P. |
0.86% |
10.62% |
9.69% |
9.56% |
|||||||||||||
Equity |
EQ/Lazard Emerging Markets Equity — EIMG; Lazard Asset Management LLC |
1.35% |
^ |
42.06% |
10.84% |
— |
||||||||||||
Equity |
EQ/Loomis Sayles Growth — EIMG; Loomis, Sayles & Company, L.P. |
1.03% |
^ |
13.08% |
12.72% |
15.87% |
||||||||||||
Equity |
EQ/MFS International Growth — EIMG; Massachusetts Financial Services Company d/b/a MFS Investment Management |
1.10% |
^ |
20.90% |
6.90% |
9.61% |
||||||||||||
Equity |
EQ/MFS International Intrinsic Value — EIMG; Massachusetts Financial Services Company d/b/a MFS Investment Management |
1.15% |
^ |
32.95% |
6.99% |
— |
||||||||||||
Equity |
EQ/MFS Mid Cap Focused Growth — EIMG; Massachusetts Financial Services Company d/b/a MFS Investment Management |
1.10% |
^ |
5.60% |
5.09% |
— |
||||||||||||
Specialty |
EQ/MFS Technology — EIMG; Massachusetts Financial Services Company d/b/a MFS Investment Management |
1.10% |
16.24% |
12.06% |
— |
|||||||||||||
Specialty |
EQ/MFS Utilities Series — EIMG; Massachusetts Financial Services Company d/b/a MFS Investment Management |
1.05% |
^ |
14.65% |
7.33% |
— |
||||||||||||
Equity |
EQ/Mid Cap Index — EIMG; AllianceBernstein L.P. |
0.64% |
^ |
6.80% |
8.42% |
9.99% |
||||||||||||
Equity |
EQ/Mid Cap Value Managed Volatility† — EIMG; BlackRock Investment Management, LLC |
0.97% |
4.98% |
7.62% |
8.20% |
|||||||||||||
Asset Allocation |
EQ/Moderate Allocation† — EIMG |
1.08% |
10.20% |
4.12% |
5.77% |
|||||||||||||
Asset Allocation |
EQ/Moderate Growth Strategy† — EIMG |
0.98% |
10.83% |
5.67% |
7.08% |
|||||||||||||
Asset Allocation |
EQ/Moderate-Plus Allocation† — EIMG |
1.11% |
11.50% |
5.88% |
7.67% |
|||||||||||||
Cash/Cash Equivalent |
EQ/Money Market* — EIMG; Dreyfus, a division of Mellon Investments Corporation |
0.67% |
3.66% |
2.79% |
1.73% |
|||||||||||||
Current Expenses |
Average Annual Total Returns (as of 12/31/2025) |
|||||||||||||||||
TYPE |
Portfolio Company — Investment Adviser; Sub-Adviser(s), as applicable |
1 year |
5 year |
10 year |
||||||||||||||
Equity |
EQ/Morgan Stanley Small Cap Growth — EIMG; BlackRock Investment Management, LLC, Morgan Stanley Investment Management, Inc. |
1.15% |
^ |
7.39% |
-0.01% |
12.95% |
||||||||||||
Fixed Income |
EQ/PIMCO Global Real Return — EIMG; Pacific Investment Management Company LLC |
2.74% |
^ |
5.52% |
-0.90% |
2.48% |
||||||||||||
Fixed Income |
EQ/PIMCO Ultra Short Bond — EIMG; Pacific Investment Management Company LLC |
0.80% |
^ |
4.47% |
2.93% |
2.32% |
||||||||||||
Fixed Income |
EQ/Quality Bond PLUS — EIMG; AllianceBernstein L.P., Pacific Investment Management Company LLC |
0.83% |
6.29% |
-0.17% |
1.31% |
|||||||||||||
Equity |
EQ/Small Company Index — EIMG; AllianceBernstein L.P. |
0.63% |
12.57% |
6.16% |
9.44% |
|||||||||||||
Equity |
EQ/Value Equity — EIMG; Aristotle Capital Management, LLC |
0.91% |
11.01% |
8.65% |
8.47% |
|||||||||||||
Specialty |
EQ/Wellington Energy — EIMG; Wellington Management Company LLP |
1.19% |
^ |
12.17% |
17.90% |
— |
||||||||||||
Asset Allocation |
Equitable Conservative Growth MF/ETF Portfolio — EIMG |
1.10% |
^ |
12.03% |
4.95% |
6.85% |
||||||||||||
Asset Allocation |
Equitable Growth MF/ETF — EIMG |
1.15% |
^ |
14.37% |
— |
— |
||||||||||||
Asset Allocation |
Equitable Moderate Growth MF/ETF — EIMG |
1.10% |
^ |
13.43% |
— |
— |
||||||||||||
Equity |
Multimanager Aggressive Equity — EIMG; AllianceBernstein L.P. |
0.99% |
16.32% |
11.47% |
15.67% |
|||||||||||||
Fixed Income |
Multimanager Core Bond (1) — EIMG ; BlackRock Financial Management, Inc., DoubleLine Capital LP, Pacific Investment Management Company LLC, SSGA Funds Management, Inc. |
0.93% |
^ |
7.11% |
-0.27% |
1.72% |
||||||||||||
Specialty |
Multimanager Technology — EIMG; AllianceBernstein L.P., FIAM LLC, Wellington Management Company LLP |
1.23% |
^ |
25.87% |
12.46% |
19.41% |
||||||||||||
Asset Allocation |
Target 2015 Allocation — EIMG |
1.10% |
^ |
9.41% |
2.84% |
5.08% |
||||||||||||
Asset Allocation |
Target 2025 Allocation — EIMG |
1.10% |
^ |
13.12% |
5.57% |
7.41% |
||||||||||||
Asset Allocation |
Target 2035 Allocation — EIMG |
1.05% |
15.70% |
7.50% |
8.95% |
|||||||||||||
Asset Allocation |
Target 2045 Allocation — EIMG |
1.03% |
16.81% |
8.58% |
9.86% |
|||||||||||||
Asset Allocation |
Target 2055 Allocation — EIMG |
1.10% |
^ |
17.90% |
9.51% |
10.81% |
||||||||||||
^ |
This Portfolio’s annual expenses reflect temporary fee reductions. |
Δ |
Certain other affiliated Portfolios, as well as unaffiliated Portfolios, may utilize volatility management techniques (including Fund of Fund Portfolios that invest in other Portfolios that utilize volatility management techniques) that differ from the EQ volatility management strategy. Affiliated Portfolios that utilize these volatility management techniques are identified in the chart by a “ Δ ”. Any such unaffiliated Portfolio is not identified in the chart. See “Portfolios of the Trusts” for more information regarding volatility management. |
† |
EQ Managed Volatility Portfolios that include the EQ volatility management strategy as part of their investment objective and/or principal investment strategy, and the EQ/affiliated Fund of Fund Portfolios that invest in Portfolios that use the EQ volatility management strategy, are identified in the chart by a “†“. See “Portfolios of the Trusts” for more information regarding volatility management. |
* |
The Portfolio operates as a “government money market fund.” The Portfolio will invest at least 99.5% of its total assets in U.S. government securities, cash, and/or repurchase agreements that are fully collateralized by U.S. government securities or cash. |
(1) |
Effective on or about June 29, 2026, and subject to shareholder approval, SSGA Funds Management, Inc. will be replaced as a sub-adviser to the Portfolio (or an allocated portion thereof) with AllianceBernstein L.P. |
Unaffiliated Portfolio Companies:
Current Expenses |
Average Annual Total Returns (as of 12/31/2025) |
|||||||||||||||||
TYPE |
Portfolio Company — Investment Adviser; Sub-Adviser(s), as applicable |
1 year |
5 year |
10 year |
||||||||||||||
Fixed Income |
American Funds Insurance Series ® The Bond Fund of America® — Capital Research and Management Company |
0.72% |
^ |
6.98% |
-0.38% |
2.11% |
||||||||||||
Fixed Income |
Fidelity ® VIP Investment Grade Bond Portfolio — Fidelity Management and Research Company (FMR) |
0.62% |
6.93% |
-0.21% |
2.45% |
|||||||||||||
Equity |
MFS ® Massachusetts Investors Growth Stock Portfolio — Massachusetts Financial Services Company |
0.97% |
^ |
9.61% |
9.74% |
13.98% |
||||||||||||
Fixed Income |
Nomura VIP High Income Series — Delaware Management Company; Nomura Corporate Research and Asset Management Inc. |
0.97% |
7.17% |
3.73% |
5.56% |
|||||||||||||
Specialty |
VanEck VIP Global Resources Fund — Van Eck Associates Corporation |
1.32% |
36.17% |
10.24% |
8.06% |
|||||||||||||
^ |
This Portfolio’s annual expenses reflect temporary fee reductions. |
(b) Fixed investment options
The following is a list of Fixed investment options currently available under the contract. We may change the features of the Fixed investment options listed below, offer new Fixed investment options, and terminate existing Fixed investment options. We will provide you with written notice before doing so.
72
Note: If amounts are removed from a Fixed investment options before the end of its term, we may apply a market value adjustment. This may result in a significant reduction in your account value.
Name |
Term |
Minimum Guaranteed Rate of Interest | ||
| Guaranteed Interest Option | N/A | 1.0% | ||
| Fixed Maturity Options | 1 year to 10 years | 3.0% | ||
| Dollar cost averaging (the “DCA program”) | N/A | N/A |
For more information, please see “Fixed Maturity Options” under “Purchasing the Contract” and “Market Value Adjustment” under “Charges, Fees, and Adjustments” in this prospectus.
Investment Options: The following are Investment Options A and B, as referred to in the “Selecting your investment method” section in “Purchasing the contract” in this prospectus.
Investments Options A | ||
Guaranteed Interest Option | ||
1290 VT Equity Income |
EQ/Invesco Global | |
1290 VT GAMCO Mergers & Acquisitions |
EQ/Invesco Global Real Assets | |
1290 VT GAMCO Small Company Value |
EQ/Janus Enterprise | |
1290 VT Small Cap Value |
EQ/JPMorgan Value Opportunities | |
1290 VT SmartBeta Equity ESG |
EQ/Large Cap Core Managed Volatility | |
1290 VT Socially Responsible |
EQ/Large Cap Growth Index | |
EQ/2000 Managed Volatility |
EQ/Large Cap Growth Managed Volatility | |
EQ/400 Managed Volatility |
EQ/Large Cap Value Index | |
EQ/500 Managed Volatility |
EQ/Large Cap Value Managed Volatility | |
EQ/AB Dynamic Moderate Growth |
EQ/Lazard Emerging Markets Equity | |
EQ/AB Small Cap Growth |
EQ/Loomis Sayles Growth | |
EQ/Aggressive Growth Strategy |
EQ/MFS International Growth | |
EQ/All Asset Growth Allocation |
EQ/MFS International Intrinsic Value | |
EQ/American Century Mid Cap Value |
EQ/MFS Mid Cap Focused Growth | |
EQ/Balanced Strategy |
EQ/MFS Technology | |
EQ/Capital Group Research |
EQ/MFS Utilities Series | |
EQ/ClearBridge Large Cap Growth ESG |
EQ/Mid Cap Index | |
EQ/ClearBridge Select Equity Managed Volatility |
EQ/Mid Cap Value Managed Volatility | |
EQ/Common Stock Index |
EQ/Moderate Growth Strategy | |
EQ/Conservative Growth Strategy |
EQ/Morgan Stanley Small Cap Growth | |
EQ/Conservative Strategy |
EQ/Small Company Index | |
EQ/Emerging Markets Equity PLUS |
EQ/T. Rowe Price Growth Stock | |
EQ/Equity 500 Index |
EQ/Value Equity | |
EQ/Fidelity Institutional AM ® |
EQ/Wellington Energy | |
EQ/Franklin Small Cap Value Managed Volatility |
Equitable Conservative Growth MF/ETF | |
EQ/Global Equity Managed Volatility |
Equitable Growth MF/ETF | |
EQ/Goldman Sachs Mid Cap Value |
Equitable Moderate Growth MF/ETF | |
EQ/International Core Managed Volatility |
MFS ® | |
EQ/International Equity Index |
Multimanager Aggressive Equity | |
EQ/International Managed Volatility |
Multimanager Technology | |
EQ/International Value Managed Volatility |
VanEck VIP Global Resources Fund | |
EQ/Invesco Comstock |
||
Investments Options B | ||
1290 VT Convertible Securities |
EQ/PIMCO Global Real Return | |
1290 VT High Yield Bond |
EQ/PIMCO Ultra Short Bond | |
American Funds Insurance Series ® ® |
EQ/Quality Bond PLUS | |
EQ/Core Bond Index |
Fidelity ® | |
EQ/Intermediate Government Bond |
Multimanager Core Bond | |
EQ/Money Market |
Nomura VIP High Income Series | |
ITEM 31A. Information about Contracts with Index-Linked Options and Fixed Options Subject to a Contract Adjustment.
| (a) | For any Contract with Index-Linked Options and/or Fixed Options subject to a Contract Adjustment offered through this registration statement, provide the information required by the following table as of December 31 of the prior calendar year. |
Name of the Contract |
Number of Contracts outstanding |
Total value attributable to the Index- Linked Option and/or Fixed Option subject to a Contract Adjustment |
Number of Contracts sold during the prior calendar year |
Gross premiums received during the prior calendar year |
Amount of Contract value redemmed during the prior year |
Combination Contract (Yes/No) |
||||||||||||||||||
EQUI-VEST (Employer-Sponsored Retirement Plans) |
19,456 | $ | 2,961 | 0 | $ | 4,394,610 | $ | 116,330,335 | Yes | |||||||||||||||
EQUI-VEST (Series 100-500) |
13,858 | $ | 2,098,190 | 0 | $ | 34,419,972 | $ | 61,043,124 | Yes | |||||||||||||||
| (b) | See Exhibit (27)(r) Historical Current Limits on Index Gains. |
Equitable Investment Management Group, LLC (“EIMG”)
SSGA Funds Management, Inc.
Barrow, Hanley, Mewhinney & Strauss, LLC d/b/a Barrow Hanley Global Investors
GAMCO Asset Management, Inc.
GAMCO Asset Management, Inc.
AXA Investment Managers US Inc., Post Advisory Group, LLC
BlackRock Investment Management, LLC, Horizon Kinetics Asset Management LLC
AXA Investment Managers US Inc.
BlackRock Investment Management, LLC
AllianceBernstein L.P., BlackRock Investment Management, LLC
AllianceBernstein L.P., BlackRock Investment Management, LLC
AllianceBernstein L.P., BlackRock Investment Management, LLC
EQ/AB Dynamic Moderate Growth
EIMG
AllianceBernstein L.P.
AllianceBernstein L.P.
American Century Investment Management, Inc.
Capital International, Inc.
ClearBridge Investments, LLC
BlackRock Investment Management, LLC, ClearBridge Investments, LLC
AllianceBernstein L.P.
EQ/Core Bond Index
EIMG
SSGA Funds Management, Inc.
Brandywine Global Investment Management, LLC, Loomis, Sayles & Company, L.P.
AllianceBernstein L.P., EARNEST Partners, LLC
AllianceBernstein L.P.
EQ/Fidelity Institutional AM
®
Large Cap
EIMG
FIAM LLC
BlackRock Investment Management, LLC, Franklin Mutual Advisers, LLC
BlackRock Investment Management,
LLC
LLC
Goldman Sachs Asset Management L.P.
EQ/Intermediate Government Bond
EIMG
SSGA Funds Management, Inc.
BlackRock Investment Management, LLC
AllianceBernstein L.P.
AllianceBernstein L.P., BlackRock Investment Management, LLC
BlackRock Investment Management, LLC, Harris Associates LP
Invesco Advisers, Inc.
Invesco Advisers, Inc.
Invesco Advisers, Inc.
Janus Henderson Investors US LLC
J.P. Morgan Investment Management Inc.
J.P. Morgan Investment Management Inc.
BlackRock Investment Management, LLC
AllianceBernstein L.P.
BlackRock Investment Management, LLC
AllianceBernstein L.P.
AllianceBernstein L.P.
Lazard Asset Management LLC
Loomis, Sayles & Company, L.P.
Massachusetts Financial Services Company
d/b/a MFS Investment Management
d/b/a MFS Investment Management
Massachusetts Financial Services Company d/b/a MFS Investment Management
Massachusetts Financial Services Company d/b/a MFS Investment Management
Massachusetts Financial Services Company d/b/a MFS Investment Management
Massachusetts Financial Services Company d/b/a MFS Investment Management
AllianceBernstein L.P.
BlackRock Investment Management, LLC
Dreyfus, a division of Mellon Investments Corporation
BlackRock Investment Management, LLC, Morgan Stanley Investment Management, Inc.
Pacific Investment Management Company LLC
Pacific Investment Management Company LLC
AllianceBernstein L.P., Pacific Investment Management Company LLC
AllianceBernstein L.P.
Aristotle Capital Management, LLC
Wellington Management Company LLP
AllianceBernstein L.P.
Multimanager Core Bond
EIMG
BlackRock Financial Management, Inc., DoubleLine Capital LP, Pacific Investment Management Company LLC, SSGA Funds Management, Inc.
AllianceBernstein L.P., FIAM LLC, Wellington Management Company LLP
American Funds Insurance Series
®
The Bond Fund of America®
Capital Research and Management Company
Fidelity
®
VIP Investment Grade Bond PortfolioFidelity Management and Research Company (FMR)
MFS
®
Massachusetts Investors Growth Stock PortfolioMassachusetts Financial Services Company
Nomura Corporate Research and Asset Management Inc.
•
Withdrawals could significantly reduce or terminate benefit
Option I
(1)
and Option II(2)
•
Not generally available with Dollar Cost Averaging
•
Investment simplifier automatic options are not available with rebalancing option II
Option I
(1)
and Option II(2)
and Investment Simplifier
•
Not generally available with Rebalancing
and Investment Simplifier
| (a) | the difference between the rate to maturity that applies to the amount being withdrawn and the rate to maturity in effect at that time for new allocations to that same fixed maturity option, and |
| (b) | the length of time remaining until the maturity date. |
Yes.
Risk of loss
All investments have risks to some degree and it is possible that you could lose money by investing in the contract. An investment in the contract is not a deposit with a bank and is not insured or guaranteed by the Federal Deposit Insurance Corporation or any other government agency.
No.
An investment in the contract is subject to the risk of poor investment performance and can vary depending on the performance of the investment options available under the contract, (e.g., the Portfolios). Each investment option, including the guaranteed interest option and fixed maturity options has its own unique risks. You should review the investment options before making an investment decision.
For additional information about the risks associated with investment options see “Fixed investment options”, “Guaranteed interest option” and “Portfolios of the Trusts” in “Purchasing the contract” in the prospectus, as well as, “Risks associated with the variable investment options”, and “Risks associated with the fixed maturity options” in “Principal Risks of investing in the contract. ”See also Appendix: “Investment options available under the contract” in this prospectus.
An investment in the contract is subject to the risks related to the Company. The Company is solely responsible to the contract owner for the contract’s account value and the optional benefits. The general obligations including the guaranteed interest option, fixed maturity options and any optional benefits under the contract are supported by our general account and are subject to our claims paying ability. An owner should look solely to our financial strength for our claims-paying ability. More information about the Company, including our financial strength ratings, may be obtained at www.equitable.com/about-us/financial-strength-ratings.
For additional information about insurance company risks see “About the general account” in “More information” in this prospectus.
Insurance company risk
No company other than us has any legal responsibility to pay amounts that we owe under the contract. The general obligations and any Guaranteed benefits under the contract are supported by our general account and are subject to our claims paying ability. You should look solely to our financial strength for our claims-paying ability.
Insurance company risk
No company other than us has any legal responsibility to pay amounts that we owe under the contract including amounts allocated to the fixed maturity options. The general obligations and any Guaranteed benefits under the contract are supported by our general account and are subject to our claims paying ability. You should look solely to our financial strength for our claims-paying ability.
Contract Changes Risk
We may, at any time, exercise our rights to limit or terminate your contributions, allocations and transfers to any of the variable investment options. We reserve the right, subject to compliance with laws that apply, to remove variable investment options from the Separate Account, to combine any two or more variable investment options, to restrict or eliminate any voting rights as to the Separate Account, to limit or terminate contributions or transfers into any of the variable investment options, and to limit the number of variable investment options you may select.
You should evaluate whether our ability to make the changes described above, and your ability to react to such changes, are appropriate based on your investment goals. When such changes occur, you should also evaluate whether those changes are appropriate based on your investment goals and, if not, you should evaluate your options under the Contract, which may be limited and may have negative consequences associated with them, as described in this section.
Risks Associated with the Fixed Maturity Options
An allocation to a fixed maturity option has various risks associated with it.
Please be aware that a market value adjustment could result in a significant loss of principal and previously credited interest. In certain extreme circumstances, it is theoretically possible to lose 100% of your investment. Specifically:
| • | If you make any withdrawal (including transfers, surrender or termination of your contract, or when we make deductions for charges) from a fixed maturity option before it matures, we will make a market value adjustment. The market value adjustment may be negative. |
| • | If there is a market value adjustment and interest rates have increased from the time that you originally allocated to a fixed maturity option to the time that you take the withdrawal (including transfers, surrender or termination of your contract, or when we make deductions for charges), the market value adjustment will be negative and will reduce your value in the fixed maturity option. |
| • | The amount of the market value adjustment, either up or down, will be greater the longer the time remaining until the fixed maturity option’s maturity date. |
| • | Therefore, it is possible that a negative market value adjustment could greatly reduce your value in the fixed maturity options, particularly in fixed maturity options with later maturity dates. |
If we deduct all or a portion of a fee or charge from a fixed maturity option, a market value adjustment will apply to that deduction from the fixed maturity option. If the market value adjustment is negative, it will reduce your value in the fixed maturity option.
No company other than us has any legal responsibility to pay amounts that the Company owes under the contract and fixed maturity option. An owner should look to the financial strength of the Company for its claims-paying ability.
Risk associated with taking an early withdrawal
The contract is not a short-term investment and is not appropriate for an investor who needs ready access to cash because the contract is designed to provide for the accumulation of retirement savings and income on a long-term basis. As such, you should not use the contract as a short-term investment or savings vehicle and you should consider whether investing in the contract is consistent with the purpose for which the investment is being considered.
Withdrawals could significantly reduce the minimum death benefit by an amount greater than the value withdrawn.
Withdrawals may be subject to Withdrawal Charges, negative Market Value Adjustments (see
Risks associated with the Fixed Maturity Options
), loss of interest and the possibility of adverse tax consequences. Possible fees on access to account value
We may apply fees if you access your account value during the accumulation period or surrender your contract. For example, in addition to possible tax consequences you may incur fees for accessing your account value such as a withdrawal charge, transfer fee, third party transfer or exchange fee, annual administrative expense, base contract expense, and/or a charge for any optional benefits.
Availability by financial intermediary
Some financial intermediaries (e.g., selling broker-dealer firms) may not offer and/or may limit the offering of certain investment options, contract benefits, and other contract features based on issue age or other criteria established by the selling broker-dealer. For example, your financial professional may not recommend a particular investment option or contract benefit to you that is described in this Prospectus. Before you purchase the contract, you should discuss with your financial professional any limitations, restrictions, or other variations related to the investment options, contract benefits or other contract features available to you through your financial professional. If a particular feature that interests you is not recommended through your broker-dealer, you may want to contact us to explore its availability.
Business disruption, cybersecurity, and artificial intelligence (“AI”) technologies risks
We rely heavily on technology, including interconnected computer systems and data storage networks and digital communications, to conduct our variable product business. Because our variable product business is highly dependent upon the effective operation of our computer systems and those of our service providers and other business partners, our business is vulnerable to disruptions from utility outages, and susceptible to operational and information security risksresulting from information systems failure (e.g., hardware and software malfunctions), and cyberattacks.
Cyber-attacks
may be systemic (e.g., affecting the internet, cloud services, or other infrastructure) or targeted (e.g., failures in or breach of our systems or those of third parties on whom we rely, including ransomware and malware attacks). Cybersecurity risks include, among other things, the loss, theft, misuse, corruption and destruction of data maintained online or digitally, interference with or denial of service, attacks on our websites (or the websites of third parties on whom we rely), other operational disruption and unauthorized release, use or abuse of confidential customer information. The risk of cyber-attacks may be higher during periods of geopolitical turmoil. Due to the increasing sophistication of cyber-attacks, a cybersecurity breach could occur and persist for an extended period of time without detection. Systems failures and cyberattacks, as well as, any other catastrophic event, including natural and manmade disasters, public health emergencies, pandemic diseases, terrorist attacks, floods or severe storms affecting us, any third-party administrator, the underlying funds, intermediaries and other affiliated or third-party service providers may adversely affect us, our business operations and your account value and interfere with our ability to process contract transactions and calculate account values. Systems failures and cyberattacks may also interfere with our processing of contract transactions, including the processing of orders from our website or with the underlying funds, impact our ability to calculate account values and unit values and/or the underlying funds to be unable to calculate share values, cause the release or possible destruction of confidential customer and/or business information, impede order processing or cause other operational issues, subject us and/or our service providers and intermediaries to regulatory fines, litigation and financial losses and/or cause reputational damage. Cybersecurity risks may also impact the issuers of securities in which the underlying funds invest, which may cause the underlying funds to lose value. The preventative actions we take to reduce the frequency and severity of cybersecurity incidents and protect our computer systems may be insufficient to prevent a cybersecurity breach from impacting our operations or your contract value. There can be no assurance that we or the underlying funds or our service providers and intermediaries will be able to avoid cybersecurity breaches affecting your contract.
The development and deployment of AI tools and technologies, including generative AI, and its use and anticipated use by us or by third parties on whom we rely, may increase our existing operational risks or create new operational risks that we are not currently anticipating. AI and generative AI may be misused by us or by third parties upon which we rely, and that risk is increased by the relative newness of the technology, the speed at which it is being adopted, and the uncertain and evolving policy and regulatory landscape governing its use. Such misuse could expose us to legal or regulatory risk. Because the generative AI technology is so new, many of the potential risks of generative AI are currently unknowable.
In addition, we are also exposed to risks related to natural and man-made disasters, including, but not limited to, storms, fires, floods, earthquakes, public health crises, malicious acts, and terrorist acts, or any other event, which could adversely affect our ability to conduct business. A natural or man-made disaster, including a pandemic such as COVID-19, could result in our workforce, and/or employees of service providers and/or third-party administrators, being compromised and unable or unwilling to fully perform their responsibilities, which could likewise result in interruptions in our service. This could interfere with our processing of contract transactions, including processing orders from owners and orders with the underlying funds, impact our ability to calculate contract value, or have other adverse impacts on our operations. These events may also negatively affect the our service providers and intermediaries, the underlying funds and issuers of securities in which the underlying funds invest, which may cause the funds underlying your contract to lose value. There can be no assurance that we or the underlying funds or our service providers and intermediaries will be able to avoid negative impacts associated with natural and man-made disasters.
Possible adverse tax consequences
The tax considerations associated with the contract vary and can be complicated. The applicable tax rules can differ,
depending on the type of contract, whether NQ, traditional IRA, Roth Advantage, Roth IRA or QP. We cannot provide detailed information on all tax aspects of the contracts. Moreover, the tax aspects that apply to a particular person’s contract may vary depending on the facts applicable to that person. Tax rules may change without notice. We cannot predict whether, when, or how these rules could change. Any change could affect contracts purchased before the change. Congress may also consider further proposals to comprehensively reform or overhaul the United States tax and retirement systems, which if enacted, could affect the tax benefits of a contract. We cannot predict what, if any, legislation will actually be proposed or enacted. Before making contributions to your contract or taking other action related to your contract, you should consult with a tax professional to determine the tax implications of an investment in, and payments received under, the contract.
Risk associated with taking a loan
Loans will decrease your account value and death benefit, and loaned amounts will not participate in the investment experience of your investment options. There may be adverse tax consequences associated with taking a loan from your contract.
Risks associated with variable investment options
You take all the investment risk for amounts allocated to one or more of the subaccounts, which invest in Portfolios. If the subaccounts you select increase in value, then your account value goes up; if they decrease in value, your account value goes down. How much your account value goes up or down depends on the performance of the Portfolios in which your subaccounts invest. We do not guarantee the investment results of any Portfolio. An investment in the contract is subject to the risk of poor investment performance, and the value of your investment can vary depending on the performance of the selected Portfolio(s), each of which has its own unique risks. You should review the Portfolios before making an investment decision.
| [1] | Expressed as an annual percent of daily net assets in the variable investment options. |
| [2] | Expressed as an annual percentage of daily net assets in the Portfolio. This range is for the year ended December 31, 2025 and could change from year to year. |
| [3] | The charge percentage is deducted upon a withdrawal of amounts in excess of the 10% free withdrawal amount. Important exceptions and limitations may eliminate or reduce this charge. For a complete description of withdrawal charges, please see “Withdrawal Charge” in “Charges, expenses, and adjustments” in this prospectus. For certain contracts issued in New York, a different maximum withdrawal charge may apply. See Appendix: “State contract availability and/or variations of certain features and benefits” in the prospectus for more information. |
| [4] | Because the end-of-term downside protection provided by a Segment Buffer does not apply to the Segment Interim Value, it is theoretically possible that you could lose up to 100% of your investment and previously credited interest in certain extreme scenarios. |
| [5] | We use the Segment Interim Values for your Segments of the SIO if you have an Interim Value Transaction. The actual amount of the Segment Interim Value calculation is determined by a formula that depends on, among other things, the Segment Buffer and how the Index has performed since the Segment Start Date. The maximum loss would occur if there is a total distribution for a Segment at a time when the Index price has declined to zero. If you surrender or cancel your variable annuity contract, die, transfer or make a withdrawal from a Segment before the Segment Maturity Date, the Segment Buffer will not necessarily apply to the extent it would on the Segment Maturity Date, and any upside performance will be limited to a percentage lower than the Performance Cap Rate. See “Structured Investment Option” under “Purchasing the contract” for more information. |
| [6] | A market value adjustment will apply to withdrawals, transfers, surrender of your contract, or when we make deductions for charges from a fixed maturity option before the maturity date. The actual amount of the Market Value Adjustment is determined by a formula that depends on, among other things, the difference between the rate to maturity that applies to the amount being withdrawn and the rate to maturity in effect at that time for new allocations to that same fixed maturity option, and the length of time remaining until the maturity date. It is theoretically possible that you could lose up to 100% of your investment and previously credited interest in certain extreme scenarios. In general, the maximum loss would occur if there is a total distribution for a fixed maturity option a significant time prior to the maturity date and interest rates have risen dramatically from the time that you originally allocate an amount to the fixed maturity option to the time that you take the withdrawal. See “Fixed maturity options” under “Purchasing the contract” for more information. |
| [7] | The annual administrative charge is deducted from your account value on each contract date anniversary. The current charge is $30. If the contract is surrendered or annuitized or a death benefit is paid on any date other than the contract date anniversary, we will deduct a pro rata portion of the administrative charge for that year. For series 300 and 400 contracts, during the first two contract years this charge, if it applies, is equal to the lesser of $30 or 2% of your account value, plus any amounts previously withdrawn during the contract year. Thereafter, the charge is $30 for each contract year. For series 100 and 200 contracts, the charge is equal to the lesser of $30 or 2% of your account value, plus any prior withdrawals during the contract year. We may discontinue these services at any time. |
| [8] | The current Base Contract Expenses for Series 100 and 200 are: 1.40% for EQ/Common Stock and EQ/Money Market Options and 1.34% for all other investment options. For Series 300 the current charge is 1.34%. For Series 400 the current charge is 1.34%. |
| [9] | “Annual Portfolio Expenses” may be based, in part, on estimated amounts of such expenses. The expenses listed are for the year ended December 31, 2025. |
| [10] | This Portfolio’s annual expenses reflect temporary fee reductions. |
| [11] | EQ Managed Volatility Portfolios that include the EQ volatility management strategy as part of their investment objective and/or principal investment strategy, and the EQ/affiliated Fund of Fund Portfolios that invest in Portfolios that use the EQ volatility management strategy, are identified in the chart by a “†“. See “Portfolios of the Trusts” for more information regarding volatility management. |
| [12] | Certain other affiliated Portfolios, as well as unaffiliated Portfolios, may utilize volatility management techniques (including Fund of Fund Portfolios that invest in other Portfolios that utilize volatility management techniques) that differ from the EQ volatility management strategy. Affiliated Portfolios that utilize these volatility management techniques are identified in the chart by a “Δ”. Any such unaffiliated Portfolio is not identified in the chart. See “Portfolios of the Trusts” for more information regarding volatility management. |
| [13] | Effective on or about June 29, 2026, and subject to shareholder approval, SSGA Funds Management, Inc. will be replaced as a sub-adviser to the Portfolio (or an allocated portion thereof) with AllianceBernstein L.P. |
| [14] | The Portfolio operates as a “government money market fund.” The Portfolio will invest at least 99.5% of its total assets in U.S. government securities, cash, and/or repurchase agreements that are fully collateralized by U.S. government securities or cash. |
| [15] | Option I allows you to rebalance your account value among the variable investment options. |
| [16] | Option II allows you to rebalance your account value among the variable investment options and the guaranteed interest option. |
| [17] | Unless you specify otherwise, this charge will be deducted from the amount you request. Special service charges include (1) express mail charge; and (2) wire transfer charge. The current maximum charge for each service is $90. We may discontinue these services at any time. |
| [18] | In no event will the net loan interest charge exceed 2.00%. We charge interest on loans under your contract but also credit you interest on your loan reserve account. Our net loan interest charge is determined by the excess between the interest rate we charge over the interest rate we credit. See “Loans under TSA, governmental employer EDC and Corporate Trusteed contracts” under “Accessing your money” in the prospectus for more information on how the loan interest is calculated and for restrictions that may apply. |
| [19] | This charge will never exceed 2% of the amount disbursed or transferred. |
| [20] | Each reference Index is a “price return index,” not a “total return index,” and therefore does not reflect dividends paid on the securities composing the Index. This will reduce the Index return and cause the Index to underperform a direct investment in the securities composing the Index. |
| [21] | 5% in the State of New York. |
| [22] | The charge percentage is deducted upon a withdrawal of amounts in excess of the 10% free withdrawal amount. Important exceptions and limitations may eliminate or reduce this charge. For a complete description of withdrawal charges, please see “Withdrawal Charge” in “Charges, expenses, and adjustments” in this prospectus. See Appendix, “State contract availability and/or variations of certain features and benefits” in this prospectus for more information. |
| [23] | A market value adjustment will apply to withdrawals, transfers, surrender of your contract, or when we make deductions for charges from a fixed maturity option before the maturity date. The actual amount of the Market Value Adjustment is determined by a formula that depends on, among other things, the difference between the rate to maturity that applies to the amount being withdrawn and the rate to maturity in effect at that time for new allocations to that same fixed maturity option, and the length of time remaining until the maturity date. In general, the maximum loss would occur if there is a total distribution for a fixed maturity option a significant time prior to the maturity date and interest rates have risen dramatically from the time that you originally allocate an amount to the fixed maturity option to the time that you take the withdrawal. See “Fixed maturity options” under “Purchasing the contract” for more information. |
| [24] | The annual administrative charge is deducted from your account value on each contract date anniversary. The current charge is $30. If the contract is surrendered or annuitized or a death benefit is paid on any date other than the contract date anniversary, we will deduct a pro rata portion of the administrative charge for that year. For series 300, 400 and 500 contracts, during the first two contract years this charge, if it applies, is equal to the lesser of $30 or 2% of your account value, plus any amounts previously withdrawn during the contract year. Thereafter, the charge is $30 for each contract year. For series 100 and 200 contracts, the charge is equal to the lesser of $30 or 2% of your account value, plus any amounts previously withdrawn during the contract year. We may discontinue these services at any time. |