On March 18, 2026, the shareholders of Innovator IBDÒ 50 ETF, a series of Innovator ETFs Trust, a Delaware statutory trust (the “Predecessor Trust”) that is registered as an open-end management investment company, approved an Agreement and Plan of Reorganization (the “Plan”) by and between the Predecessor Trust, on behalf of the Predecessor Fund, and the Trust, on behalf of the Fund, pursuant to which the Predecessor Fund would: (i) transfer all of its assets to the Fund in exchange solely for newly issued shares of the Fund and the Fund’s assumption of all of the liabilities of the Predecessor Fund; and (ii) immediately distribute such newly issued shares of the Fund to shareholders of the Predecessor Fund (the “Reorganization”).
As a result of the Reorganization, the Fund has assumed the performance history of the Predecessor Fund. The Fund is a continuation of the Predecessor Fund and, therefore adopts the performance information of the Predecessor Fund (as shown below), which was managed by Innovator Capital Management, LLC. The Predecessor Fund commenced operations on April 8, 2015.
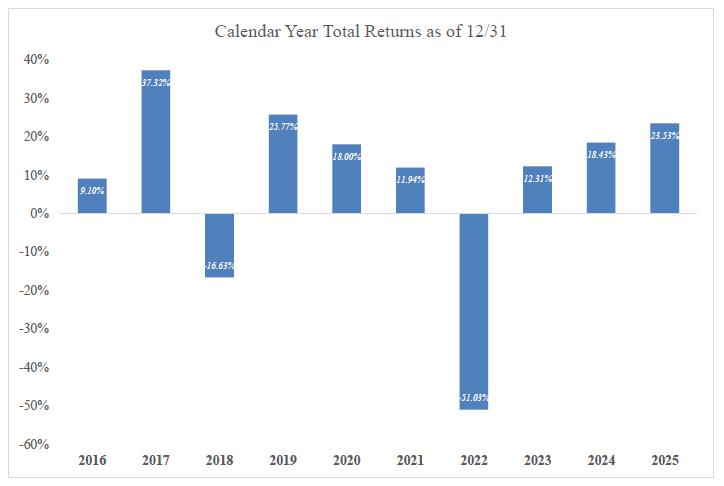
The Fund’s highest quarterly return was 23.20% (quarter ended June 30, 2020) and the Fund’s lowest quarterly return was (31.23)% (quarter ended June 30, 2022).
| Average Annual Total Return as of December 31, 2025 | ||||
| CapForce IBD® 50 ETF | 1 Year | 5 Years | 10 years | Since Inception (4/8/15) |
| Return Before Taxes | 23.53% | -2.07% | 5.26% | 3.72% |
| Return After Taxes on Distributions | 22.89% | -2.46% | 5.04% | 3.53% |
| Return After Taxes on Distributions and Sale of Fund Shares | 13.96% | -1.72% | 4.11% | 2.86% |
| IBD® 50 Index (reflects no deduction for fees, expenses or taxes) | 24.06% | -1.38% | ||
| S&P 500® Total Return Index (reflects no deduction for fees, expenses or taxes) | 17.88% | 14.42% | 14.82% | 13.71% |
| (1) | On November 20, 2017, the Predecessor Fund began tracking the IBD® 50 Index. Because the IBD® 50 Index had an inception date of October 27, 2017, performance information is not included above. |
| (2) | Performance data is not available for all the periods shown in the table for the index because performance data does not exist for the entire period. |
The Fund’s past performance (before and after taxes) is not necessarily an indication of how the Fund will perform in the future.
Returns before taxes do not reflect the effects of any income or capital gains taxes. All after-tax returns are calculated using the historical highest individual federal marginal income tax rates and do not reflect the impact of any state or local tax. Returns after taxes on distributions reflect the taxed return on the payment of dividends and capital gains.
Your own actual after-tax returns will depend on your specific tax situation and may differ from what is shown here. After-tax returns are not relevant to investors who hold Shares in tax-deferred accounts such as individual retirement accounts (IRAs) or employee-sponsored retirement plans.
On March 18, 2026, the shareholders of Innovator IBDÒ Breakout Opportunities ETF, a series of Innovator ETFs Trust, a Delaware statutory trust (the “Predecessor Trust”) that is registered as an open-end management investment company, approved an Agreement and Plan of Reorganization (the “Plan”) by and between the Predecessor Trust, on behalf of the Predecessor Fund, and the Trust, on behalf of the Fund, pursuant to which the Predecessor Fund would: (i) transfer all of its assets to the Fund in exchange solely for newly issued shares of the Fund and the Fund’s assumption of all of the liabilities of the Predecessor Fund; and (ii) immediately distribute such newly issued shares of the Fund to shareholders of the Predecessor Fund (the “Reorganization”).
As a result of the Reorganization, the Fund has assumed the performance history of the Predecessor Fund. The Fund is a continuation of the Predecessor Fund and, therefore adopts the performance information of the Predecessor Fund (as shown below), which was managed by Innovator Capital Management, LLC. The Predecessor Fund commenced operations on September 12, 2018.
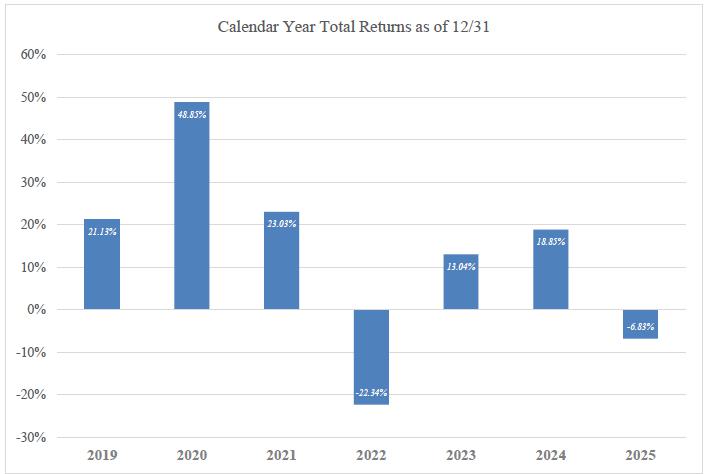
The Fund’s performance information is accessible on the Fund’s website at capforceetf.com.
The Fund’s highest quarterly return was 32.61% (quarter ended December 31, 2020) and the Fund’s lowest quarterly return was (20.54)% (quarter ended June 30, 2022).
| Average Annual Total Return as of December 31, 2025 | |||
| CapForce IBD® Breakout Opportunities ETF | 1 Year | 5 Years | Since Inception (9/12/18) |
| Return Before Taxes | -6.83% | 3.65% | 5.79% |
| Return After Taxes on Distributions | -6.95% | 3.37% | 5.59% |
| Return After Taxes on Distributions and Sale of Fund Shares | -4.04% | 2.71% | 7.15% |
| IBD® Breakout Stocks Index (reflects no deduction for fees, expenses or taxes) | -5.68% | 5.00% | 7.15% |
| S&P 500® Total Return Index (reflects no deduction for fees, expenses or taxes) | 17.88% | 14.42% | 14.37% |
The Fund’s past performance (before and after taxes) is not necessarily an indication of how the Fund will perform in the future.
Returns before taxes do not reflect the effects of any income or capital gains taxes. All after-tax returns are calculated using the historical highest individual federal marginal income tax rates and do not reflect the impact of any state or local tax. Returns after taxes on distributions reflect the taxed return on the payment of dividends and capital gains.
Your own actual after-tax returns will depend on your specific tax situation and may differ from what is shown here. After-tax returns are not relevant to investors who hold Shares in tax-deferred accounts such as individual retirement accounts (IRAs) or employee-sponsored retirement plans.