v3.26.1
Performance Management
Dec. 31, 2025
Allspring Variable Trust - Class 1 | VT Discovery All Cap Growth Fund  
Prospectus [Line Items]  
Bar Chart and Performance Table [Heading] Performance
Performance Narrative [Text Block]
The following information provides some indication of the risks of investing in the Fund by showing changes in the Fund’s performance from year to year. The Fund’s average annual total returns are compared to the performance of one or more indices. Past performance is no guarantee of future results. Current month-end performance is available on the Fund’s website at allspringglobal.com.
The performance for the Fund does not reflect fees charged by VLI Policies or VA Contracts. If it did, returns would be lower.
Performance Past Does Not Indicate Future [Text] Past performance is no guarantee of future results.
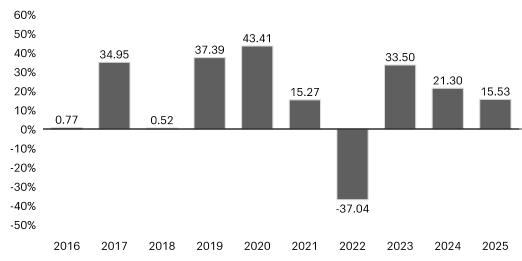
Performance Information Illustrates Variability of Returns [Text] The following information provides some indication of the risks of investing in the Fund by showing changes in the Fund’s performance from year to year.
Bar Chart [Table]
image
Bar Chart Closing [Text Block]
Highest Quarter:
June 30, 2020
+31.20%
Lowest Quarter:
June 30, 2022
-25.99%
Year-to-date total return as of March 31, 2026 is -9.36%
Performance Table Heading Average Annual Total Returns for the periods ended 12/31/2025
Performance Table Does Reflect Sales Loads The performance for the Fund does not reflect fees charged by VLI Policies or VA Contracts. If it did, returns would be lower.
Performance [Table]
Average Annual Total Returns for the periods ended 12/31/2025
 
INCEPTION DATE OF SHARE CLASS
1 YEAR
5 YEAR
10 YEAR
Class 1
3/6/1997
15.53%
6.31%
13.84%
Russell 3000® Growth Index (reflects no deduction for fees, expenses, or taxes)
 
18.15%
14.59%
17.59%
Russell 3000® Index (reflects no deduction for fees, expenses, or taxes)
 
17.15%
13.15%
14.29%
Performance Availability Website Address [Text] allspringglobal.com
Allspring Variable Trust - Class 1 | VT Discovery All Cap Growth Fund | 1  
Prospectus [Line Items]  
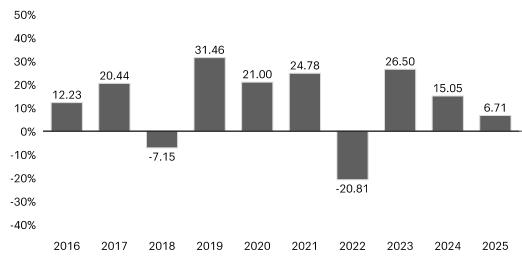
Bar Chart [Heading] Calendar Year Total Returns for Class 1 shares as of 12/31 each year
Year to Date Return, Label [Optional Text] Year-to-date total return as of March 31, 2026 is -9.36%
Bar Chart, Year to Date Return (9.36%)
Bar Chart, Year to Date Return, Date Mar. 31, 2026
Highest Quarterly Return, Label [Optional Text] Highest Quarter: June 30, 2020
Highest Quarterly Return 31.20%
Highest Quarterly Return, Date Jun. 30, 2020
Lowest Quarterly Return, Label [Optional Text] Lowest Quarter: June 30, 2022
Lowest Quarterly Return (25.99%)
Lowest Quarterly Return, Date Jun. 30, 2022
Allspring Variable Trust - Class 1 | VT Opportunity Fund  
Prospectus [Line Items]  
Bar Chart and Performance Table [Heading] Performance
Performance Narrative [Text Block]
The following information provides some indication of the risks of investing in the Fund by showing changes in the Fund’s performance from year to year. The Fund’s average annual total returns are compared to the performance of one or more indices. Past performance is no guarantee of future results. Current month-end performance is available on the Fund’s website at allspringglobal.com.
The performance for the Fund does not reflect fees charged by VLI Policies or VA Contracts. If it did, returns would be lower.
Performance Past Does Not Indicate Future [Text] Past performance is no guarantee of future results.
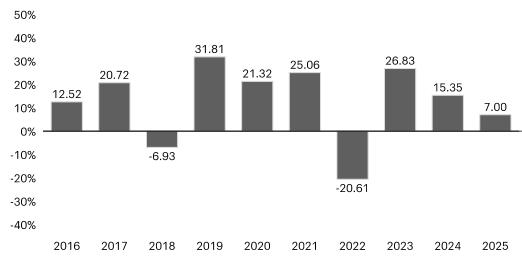
Performance Information Illustrates Variability of Returns [Text] The following information provides some indication of the risks of investing in the Fund by showing changes in the Fund’s performance from year to year.
Bar Chart [Table]
image
Bar Chart Closing [Text Block]
Highest Quarter:
June 30, 2020
+21.55%
Lowest Quarter:
March 31, 2020
-21.72%
Year-to-date total return as of March 31, 2026 is -5.80%
Performance Table Heading Average Annual Total Returns for the periods ended 12/31/2025
Performance Table Does Reflect Sales Loads The performance for the Fund does not reflect fees charged by VLI Policies or VA Contracts. If it did, returns would be lower.
Performance [Table]
Average Annual Total Returns for the periods ended 12/31/2025
 
INCEPTION DATE OF SHARE CLASS
1 YEAR
5 YEAR
10 YEAR
Class 1
8/26/2011
7.00%
9.22%
12.13%
Russell 3000® Index (reflects no deduction for fees, expenses, or taxes)
 
17.15%
13.15%
14.29%
Performance Availability Website Address [Text] allspringglobal.com
Allspring Variable Trust - Class 1 | VT Opportunity Fund | 1  
Prospectus [Line Items]  
Bar Chart [Heading] Calendar Year Total Returns for Class 1 shares as of 12/31 each year
Year to Date Return, Label [Optional Text] Year-to-date total return as of March 31, 2026 is -5.80%
Bar Chart, Year to Date Return (5.80%)
Bar Chart, Year to Date Return, Date Mar. 31, 2026
Highest Quarterly Return, Label [Optional Text] Highest Quarter: June 30, 2020
Highest Quarterly Return 21.55%
Highest Quarterly Return, Date Jun. 30, 2020
Lowest Quarterly Return, Label [Optional Text] Lowest Quarter: March 31, 2020
Lowest Quarterly Return (21.72%)
Lowest Quarterly Return, Date Mar. 31, 2020
Allspring Variable Trust - Class 1 | VT Small Cap Growth Fund  
Prospectus [Line Items]  
Bar Chart and Performance Table [Heading] Performance
Performance Narrative [Text Block]
The following information provides some indication of the risks of investing in the Fund by showing changes in the Fund’s performance from year to year. The Fund’s average annual total returns are compared to the performance of one or more indices. Past performance is no guarantee of future results. Current month-end performance is available on the Fund’s website at allspringglobal.com.
The performance for the Fund does not reflect fees charged by VLI Policies or VA Contracts. If it did, returns would be lower.
Performance Past Does Not Indicate Future [Text] Past performance is no guarantee of future results.
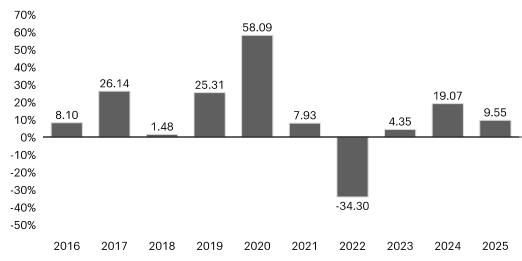
Performance Information Illustrates Variability of Returns [Text] The following information provides some indication of the risks of investing in the Fund by showing changes in the Fund’s performance from year to year.
Bar Chart [Table]
image
Bar Chart Closing [Text Block]
Highest Quarter:
June 30, 2020
+42.28%
Lowest Quarter:
June 30, 2022
-24.60%
Year-to-date total return as of March 31, 2026 is -4.06%
Performance Table Heading Average Annual Total Returns for the periods ended 12/31/2025
Performance Table Does Reflect Sales Loads The performance for the Fund does not reflect fees charged by VLI Policies or VA Contracts. If it did, returns would be lower.
Performance [Table]
Average Annual Total Returns for the periods ended 12/31/2025
 
INCEPTION DATE OF SHARE CLASS
1 YEAR
5 YEAR
10 YEAR
Class 1
7/16/2010
9.55%
-0.70%
10.22%
Russell 2000® Growth Index (reflects no deduction for fees, expenses, or taxes)
 
13.01%
3.18%
9.57%
Russell 3000® Index (reflects no deduction for fees, expenses, or taxes)
 
17.15%
13.15%
14.29%
Performance Availability Website Address [Text] allspringglobal.com
Allspring Variable Trust - Class 1 | VT Small Cap Growth Fund | 1  
Prospectus [Line Items]  
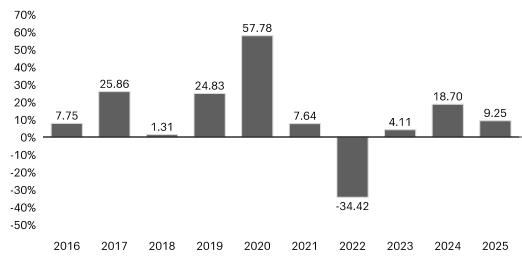
Bar Chart [Heading] Calendar Year Total Returns for Class 1 shares as of 12/31 each year
Year to Date Return, Label [Optional Text] Year-to-date total return as of March 31, 2026 is -4.06%
Bar Chart, Year to Date Return (4.06%)
Bar Chart, Year to Date Return, Date Mar. 31, 2026
Highest Quarterly Return, Label [Optional Text] Highest Quarter: June 30, 2020
Highest Quarterly Return 42.28%
Highest Quarterly Return, Date Jun. 30, 2020
Lowest Quarterly Return, Label [Optional Text] Lowest Quarter: June 30, 2022
Lowest Quarterly Return (24.60%)
Lowest Quarterly Return, Date Jun. 30, 2022
Allspring Variable Trust - Class 2 | VT Discovery All Cap Growth Fund  
Prospectus [Line Items]  
Bar Chart and Performance Table [Heading] Performance
Performance Narrative [Text Block]
The following information provides some indication of the risks of investing in the Fund by showing changes in the Fund’s performance from year to year. The Fund’s average annual total returns are compared to the performance of one or more indices. Past performance is no guarantee of future results. Current month-end performance is available on the Fund’s website at allspringglobal.com.
The performance for the Fund does not reflect fees charged by VLI Policies or VA Contracts. If it did, returns would be lower.
Performance Past Does Not Indicate Future [Text] Past performance is no guarantee of future results.
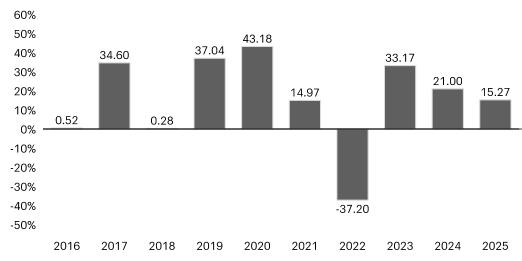
Performance Information Illustrates Variability of Returns [Text] The following information provides some indication of the risks of investing in the Fund by showing changes in the Fund’s performance from year to year.
Bar Chart [Table]
image
Bar Chart Closing [Text Block]
Highest Quarter:
June 30, 2020
+31.13%
Lowest Quarter:
June 30, 2022
-26.00%
Year-to-date total return as of March 31, 2026 is -9.44%
Performance Table Heading Average Annual Total Returns for the periods ended 12/31/2025
Performance Table Does Reflect Sales Loads The performance for the Fund does not reflect fees charged by VLI Policies or VA Contracts. If it did, returns would be lower.
Performance [Table]
Average Annual Total Returns for the periods ended 12/31/2025
 
INCEPTION DATE OF SHARE CLASS
1 YEAR
5 YEAR
10 YEAR
Class 2
7/31/2002
15.27%
6.04%
13.57%
Russell 3000® Growth Index (reflects no deduction for fees, expenses, or taxes)
 
18.15%
14.59%
17.59%
Russell 3000® Index (reflects no deduction for fees, expenses, or taxes)
 
17.15%
13.15%
14.29%
Performance Availability Website Address [Text] allspringglobal.com
Allspring Variable Trust - Class 2 | VT Discovery All Cap Growth Fund | 2  
Prospectus [Line Items]  
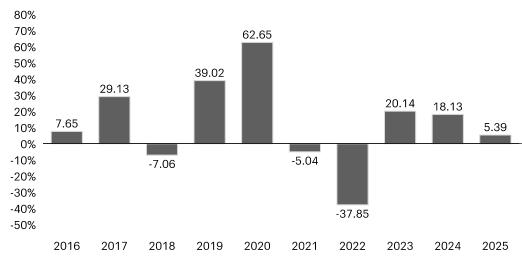
Bar Chart [Heading] Calendar Year Total Returns for Class 2 shares as of 12/31 each year
Year to Date Return, Label [Optional Text] Year-to-date total return as of March 31, 2026 is -9.44%
Bar Chart, Year to Date Return (9.44%)
Bar Chart, Year to Date Return, Date Mar. 31, 2026
Highest Quarterly Return, Label [Optional Text] Highest Quarter: June 30, 2020
Highest Quarterly Return 31.13%
Highest Quarterly Return, Date Jun. 30, 2020
Lowest Quarterly Return, Label [Optional Text] Lowest Quarter: June 30, 2022
Lowest Quarterly Return (26.00%)
Lowest Quarterly Return, Date Jun. 30, 2022
Allspring Variable Trust - Class 2 | VT Opportunity Fund  
Prospectus [Line Items]  
Bar Chart and Performance Table [Heading] Performance
Performance Narrative [Text Block]
The following information provides some indication of the risks of investing in the Fund by showing changes in the Fund’s performance from year to year. The Fund’s average annual total returns are compared to the performance of one or more indices. Past performance is no guarantee of future results. Current month-end performance is available on the Fund’s website at allspringglobal.com.
The performance for the Fund does not reflect fees charged by VLI Policies or VA Contracts. If it did, returns would be lower.
Performance Past Does Not Indicate Future [Text] Past performance is no guarantee of future results.
Performance Information Illustrates Variability of Returns [Text] The following information provides some indication of the risks of investing in the Fund by showing changes in the Fund’s performance from year to year.
Bar Chart [Table]
image
Bar Chart Closing [Text Block]
Highest Quarter:
June 30, 2020
+21.51%
Lowest Quarter:
March 31, 2020
-21.78%
Year-to-date total return as of March 31, 2026 is -5.84%
Performance Table Heading Average Annual Total Returns for the periods ended 12/31/2025
Performance Table Does Reflect Sales Loads The performance for the Fund does not reflect fees charged by VLI Policies or VA Contracts. If it did, returns would be lower.
Performance [Table]
Average Annual Total Returns for the periods ended 12/31/2025
 
INCEPTION DATE OF SHARE CLASS
1 YEAR
5 YEAR
10 YEAR
Class 2
5/8/1992
6.71%
8.94%
11.85%
Russell 3000® Index (reflects no deduction for fees, expenses, or taxes)
 
17.15%
13.15%
14.29%
Performance Availability Website Address [Text] allspringglobal.com
Allspring Variable Trust - Class 2 | VT Opportunity Fund | 2  
Prospectus [Line Items]  
Bar Chart [Heading] Calendar Year Total Returns for Class 2 shares as of 12/31 each year
Year to Date Return, Label [Optional Text] Year-to-date total return as of March 31, 2026 is -5.84%
Bar Chart, Year to Date Return (5.84%)
Bar Chart, Year to Date Return, Date Mar. 31, 2026
Highest Quarterly Return, Label [Optional Text] Highest Quarter: June 30, 2020
Highest Quarterly Return 21.51%
Highest Quarterly Return, Date Jun. 30, 2020
Lowest Quarterly Return, Label [Optional Text] Lowest Quarter: March 31, 2020
Lowest Quarterly Return (21.78%)
Lowest Quarterly Return, Date Mar. 31, 2020
Allspring Variable Trust - Class 2 | VT Small Cap Growth Fund  
Prospectus [Line Items]  
Bar Chart and Performance Table [Heading] Performance
Performance Narrative [Text Block]
The following information provides some indication of the risks of investing in the Fund by showing changes in the Fund’s performance from year to year. The Fund’s average annual total returns are compared to the performance of one or more indices. Past performance is no guarantee of future results. Current month-end performance is available on the Fund’s website at allspringglobal.com.
The performance for the Fund does not reflect fees charged by VLI Policies or VA Contracts. If it did, returns would be lower.
Performance Past Does Not Indicate Future [Text] Past performance is no guarantee of future results.
Performance Information Illustrates Variability of Returns [Text] The following information provides some indication of the risks of investing in the Fund by showing changes in the Fund’s performance from year to year.
Bar Chart [Table]
image
Bar Chart Closing [Text Block]
Highest Quarter:
June 30, 2020
+42.19%
Lowest Quarter:
June 30, 2022
-24.69%
Year-to-date total return as of March 31, 2026 is -4.17%
Performance Table Heading Average Annual Total Returns for the periods ended 12/31/2025
Performance Table Does Reflect Sales Loads The performance for the Fund does not reflect fees charged by VLI Policies or VA Contracts. If it did, returns would be lower.
Performance [Table]
Average Annual Total Returns for the periods ended 12/31/2025
 
INCEPTION DATE OF SHARE CLASS
1 YEAR
5 YEAR
10 YEAR
Class 2
5/1/1995
9.25%
-0.96%
9.94%
Russell 2000® Growth Index (reflects no deduction for fees, expenses, or taxes)
 
13.01%
3.18%
9.57%
Russell 3000® Index (reflects no deduction for fees, expenses, or taxes)
 
17.15%
13.15%
14.29%
Performance Availability Website Address [Text] allspringglobal.com
Allspring Variable Trust - Class 2 | VT Small Cap Growth Fund | 2  
Prospectus [Line Items]  
Bar Chart [Heading] Calendar Year Total Returns for Class 2 shares as of 12/31 each year
Year to Date Return, Label [Optional Text] Year-to-date total return as of March 31, 2026 is -4.17%
Bar Chart, Year to Date Return (4.17%)
Bar Chart, Year to Date Return, Date Mar. 31, 2026
Highest Quarterly Return, Label [Optional Text] Highest Quarter: June 30, 2020
Highest Quarterly Return 42.19%
Highest Quarterly Return, Date Jun. 30, 2020
Lowest Quarterly Return, Label [Optional Text] Lowest Quarter: June 30, 2022
Lowest Quarterly Return (24.69%)
Lowest Quarterly Return, Date Jun. 30, 2022
Allspring Variable Trust - Class 2 | VT Discovery SMID Cap Growth Fund  
Prospectus [Line Items]  
Bar Chart and Performance Table [Heading] Performance
Performance Narrative [Text Block]
The following information provides some indication of the risks of investing in the Fund by showing changes in the Fund’s performance from year to year. The Fund’s average annual total returns are compared to the performance of one or more indices. Past performance is no guarantee of future results. Current month-end performance is available on the Fund’s website at allspringglobal.com.
The performance for the Fund does not reflect fees charged by VLI Policies or VA Contracts. If it did, returns would be lower.
Performance Past Does Not Indicate Future [Text] Past performance is no guarantee of future results.
Performance Information Illustrates Variability of Returns [Text] The following information provides some indication of the risks of investing in the Fund by showing changes in the Fund’s performance from year to year.
Bar Chart [Table]
image
Bar Chart Closing [Text Block]
Highest Quarter:
June 30, 2020
+35.94%
Lowest Quarter:
June 30, 2022
-25.29%
Year-to-date total return as of March 31, 2026 is -5.50%
Performance Table Heading Average Annual Total Returns for the periods ended 12/31/2025
Performance Table Does Reflect Sales Loads The performance for the Fund does not reflect fees charged by VLI Policies or VA Contracts. If it did, returns would be lower.
Performance [Table]
Average Annual Total Returns for the periods ended 12/31/2025
 
INCEPTION DATE OF SHARE CLASS
1 YEAR
5 YEAR
10 YEAR
Class 2
5/8/1992
5.39%
-2.46%
9.94%
Russell 2500™ Growth Index (reflects no deduction for fees, expenses, or taxes)
 
10.31%
2.98%
10.55%
Russell 3000® Index (reflects no deduction for fees, expenses, or taxes)
 
17.15%
13.15%
14.29%
Performance Availability Website Address [Text] allspringglobal.com
Allspring Variable Trust - Class 2 | VT Discovery SMID Cap Growth Fund | 2  
Prospectus [Line Items]  
Bar Chart [Heading] Calendar Year Total Returns for Class 2 shares as of 12/31 each year
Year to Date Return, Label [Optional Text] Year-to-date total return as of March 31, 2026 is -5.50%
Bar Chart, Year to Date Return (5.50%)
Bar Chart, Year to Date Return, Date Mar. 31, 2026
Highest Quarterly Return, Label [Optional Text] Highest Quarter: June 30, 2020
Highest Quarterly Return 35.94%
Highest Quarterly Return, Date Jun. 30, 2020
Lowest Quarterly Return, Label [Optional Text] Lowest Quarter: June 30, 2022
Lowest Quarterly Return (25.29%)
Lowest Quarterly Return, Date Jun. 30, 2022
Allspring Variable Trust - Class 2 | VT Index Asset Allocation Fund  
Prospectus [Line Items]  
Bar Chart and Performance Table [Heading] Performance
Performance Narrative [Text Block]
The following information provides some indication of the risks of investing in the Fund by showing changes in the Fund’s performance from year to year. The Fund’s average annual total returns are compared to the performance of one or more indices. Past performance is no guarantee of future results. Current month-end performance is available on the Fund’s website at allspringglobal.com.
The performance for the Fund does not reflect fees charged by VLI Policies or VA Contracts. If it did, returns would be lower.
Performance Past Does Not Indicate Future [Text] Past performance is no guarantee of future results.
Performance Information Illustrates Variability of Returns [Text] The following information provides some indication of the risks of investing in the Fund by showing changes in the Fund’s performance from year to year.
Bar Chart [Table]
image
Bar Chart Closing [Text Block]
Highest Quarter:
June 30, 2020
+12.65%
Lowest Quarter:
June 30, 2022
-11.57%
Year-to-date total return as of March 31, 2026 is -2.71%
Performance Table Heading Average Annual Total Returns for the periods ended 12/31/2025
Performance Table Does Reflect Sales Loads The performance for the Fund does not reflect fees charged by VLI Policies or VA Contracts. If it did, returns would be lower.
Performance [Table]
Average Annual Total Returns for the periods ended 12/31/2025
 
INCEPTION DATE OF SHARE CLASS
1 YEAR
5 YEAR
10 YEAR
Class 2
4/15/1994
11.48%
7.54%
8.99%
Index Asset Allocation Blended Index (reflects no deduction for fees, expenses, or taxes)1
 
13.30%
8.22%
9.55%
Russell 3000® Index (reflects no deduction for fees, expenses, or taxes)
 
17.15%
13.15%
14.29%
Bloomberg U.S. Aggregate Bond Index (reflects no deduction for fees, expenses, or taxes)
 
7.30%
-0.36%
2.01%
[1]
Performance Availability Website Address [Text] allspringglobal.com
Allspring Variable Trust - Class 2 | VT Index Asset Allocation Fund | 2  
Prospectus [Line Items]  
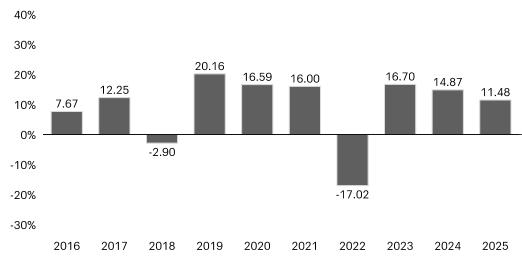
Bar Chart [Heading] Calendar Year Total Returns for Class 2 shares as of 12/31 each year
Year to Date Return, Label [Optional Text] Year-to-date total return as of March 31, 2026 is -2.71%
Bar Chart, Year to Date Return (2.71%)
Bar Chart, Year to Date Return, Date Mar. 31, 2026
Highest Quarterly Return, Label [Optional Text] Highest Quarter: June 30, 2020
Highest Quarterly Return 12.65%
Highest Quarterly Return, Date Jun. 30, 2020
Lowest Quarterly Return, Label [Optional Text] Lowest Quarter: June 30, 2022
Lowest Quarterly Return (11.57%)
Lowest Quarterly Return, Date Jun. 30, 2022
[1]
1. Source:  Allspring Funds Management, LLC. The Index Asset Allocation Blended Index is composed 60% of the S&P 500 Index and 40% of the Bloomberg U.S. Treasury Index. Prior to April 1, 2015, the Index Asset Allocation Blended Index was composed 60% of the S&P 500 Index and 40% of the Bloomberg U.S. Treasury 20+ Year Index. You cannot invest directly in an index.