Prior to April 24, 2017, the Fund was managed by JNAM and implemented its investment strategy directly through a sub-adviser. Effective April 24, 2017, the Fund operates as a “feeder fund” of the Master Fund. Performance prior to April 24, 2017 reflects the Fund’s results when its investment strategy was implemented by a sub-adviser rather than via investment in the Master Fund. For the period from April 24, 2017 through December 31, 2017, the Fund’s performance information set forth below is the performance of the Master Fund (adjusted to reflect the fees of the Class A and Class I shares of the Fund, as applicable). For periods following January 1, 2018, the Fund’s performance information set forth below is the performance of the Feeder Fund.
The performance information shown provides some indication of the risks of investing in the Fund by showing changes in the Fund’s performance from year to year and by showing how the Fund’s average annual returns compared with those of a broad-based securities market index and an additional index that the Adviser believes more closely reflects the market segments in which the Fund invests. Performance results include the effect of expense waiver/reduction arrangements for some or all of the periods shown. If such arrangements had not been in place, performance for those periods would have been lower. The Fund’s past performance is not necessarily an indication of how the Fund will perform in the future.
The returns shown in the bar chart and table do not include charges that will be imposed by variable insurance products. If these amounts were reflected, returns would be less than those shown.
Consistent with the Fund’s principal investment strategies, the Fund uses the 60% S&P 500 Index/40% Bloomberg U.S. Aggregate Index as the Fund’s secondary benchmark.
Consistent with the Fund’s principal investment strategies, the Fund uses the Bloomberg U.S. Aggregate Index as the Fund’s tertiary benchmark.
Annual Total Returns as of December 31
Class A
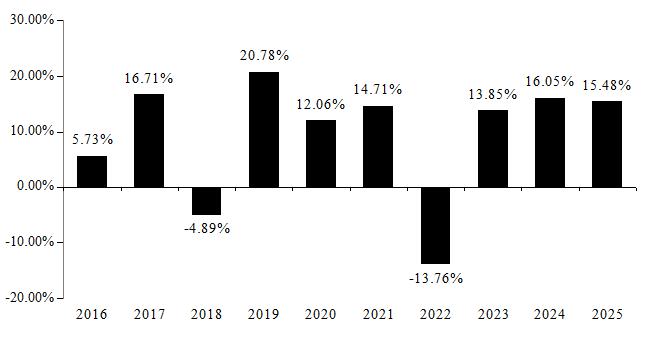
Best Quarter (ended 6/30/2020): 13.67%; Worst Quarter (ended 3/31/2020): -13.59%
Annual Total Returns as of December 31
Class I
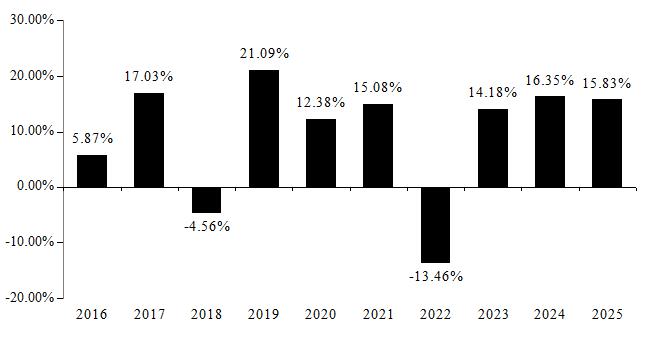
Best Quarter (ended 6/30/2020): 13.79%; Worst Quarter (ended 3/31/2020): -13.54%
| Average Annual Total Returns as of 12/31/2025 | ||||||
| 1 year | 5 year | 10 year | ||||
| JNL/American Funds Balanced Fund (Class A) | 15.48 | % | 8.58 | % | 9.14 | % |
| S&P 500 Index (reflects no deduction for fees, expenses, or taxes) | 17.88 | % | 14.42 | % | 14.82 | % |
| 60% S&P 500 Index, 40% Bloomberg U.S. Aggregate Index (reflects no deduction for fees, expenses, or taxes) | 13.70 | % | 8.47 | % | 9.78 | % |
| Bloomberg U.S. Aggregate Index (reflects no deduction for fees, expenses, or taxes) | 7.30 | % | -0.36 | % | 2.01 | % |
| Average Annual Total Returns as of 12/31/2025 | ||||||
| 1 year | 5 year | 10 year | ||||
| JNL/American Funds Balanced Fund (Class I) | 15.83 | % | 8.91 | % | 9.45 | % |
| S&P 500 Index (reflects no deduction for fees, expenses, or taxes) | 17.88 | % | 14.42 | % | 14.82 | % |
| 60% S&P 500 Index, 40% Bloomberg U.S. Aggregate Index (reflects no deduction for fees, expenses, or taxes) | 13.70 | % | 8.47 | % | 9.78 | % |
| Bloomberg U.S. Aggregate Index (reflects no deduction for fees, expenses, or taxes) | 7.30 | % | -0.36 | % | 2.01 | % |
The performance information shown provides some indication of the risks of investing in the Fund by showing changes
in the Fund’s performance from year to year and by showing how the Fund’s average annual returns compared with those of a
broad-based securities market index. Performance results include the effect of expense waiver/reduction arrangements for some or all of
the periods shown. If such arrangements had not been in place, performance for those periods would have been lower. The Fund’s past
performance is not necessarily an indication of how the Fund will perform in the future.
The returns shown in the bar chart and table do not include charges that will be imposed by variable insurance products. If these amounts were reflected, returns would be less than those shown.
Annual Total Returns as of December 31
Class A
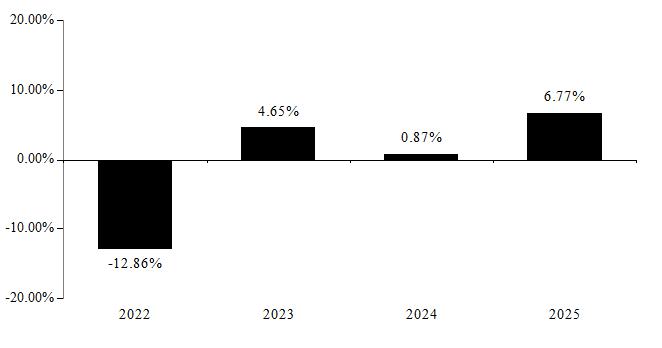
Best Quarter (ended 12/31/2023): 6.59%; Worst Quarter (ended 3/31/2022): -5.34%
Annual Total Returns as of December 31
Class I
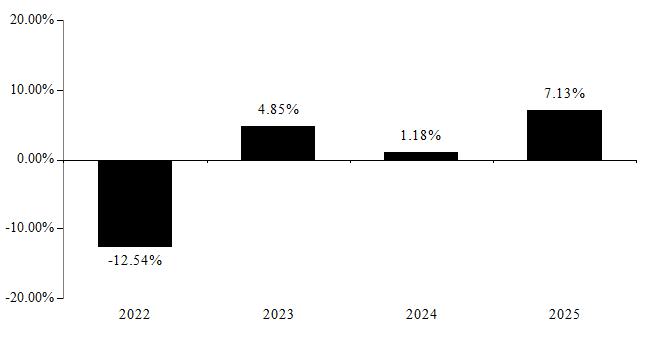
Best Quarter (ended 12/31/2023): 6.66%; Worst Quarter (ended 3/31/2022): -5.23%
| Average Annual Total Returns as of 12/31/2025 | ||||
| 1 year | Life of Fund (April 26, 2021) | |||
| JNL/American Funds Bond Fund of America Fund (Class A) | 6.77 | % | -0.15 | % |
| Bloomberg U.S. Aggregate Index (reflects no deduction for fees, expenses, or taxes) | 7.30 | % | 0.14 | % |
| Average Annual Total Returns as of 12/31/2025 | ||||
| 1 year | Life of Class (April 26, 2021) | |||
| JNL/American Funds Bond Fund of America Fund (Class I) | 7.13 | % | 0.15 | % |
| Bloomberg U.S. Aggregate Index (reflects no deduction for fees, expenses, or taxes) | 7.30 | % | 0.14 | % |
The performance information shown
provides some indication of the risks of investing in the Fund by showing changes in the Fund’s performance from year to year
and by showing how the Fund’s average annual returns compared with those of a broad-based securities market index and an
additional index that the Adviser believes more closely reflects the market segments in which the Fund invests. Performance results
include the effect of expense waiver/reduction arrangements for some or all of the periods shown. If such arrangements had not been
in place, performance for those periods would have been lower. The Fund’s past performance is not necessarily an indication of
how the Fund will perform in the future.
The returns shown in the bar chart and table do not include charges that will be imposed by variable insurance products. If these amounts were reflected, returns would be less than those shown.
Annual Total Returns as of December 31
Class A
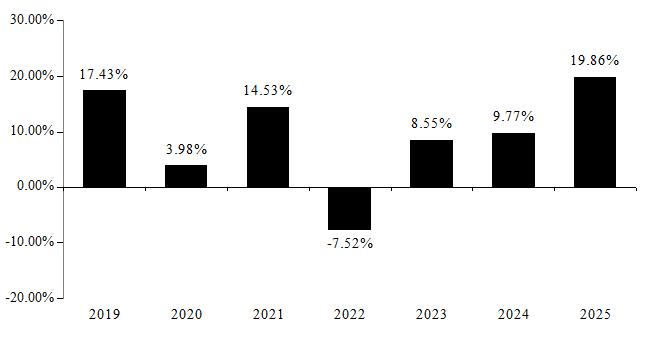
Best Quarter (ended 12/31/2022): 11.14%; Worst Quarter (ended 3/31/2020): -14.93%
Annual Total Returns as of December 31
Class I
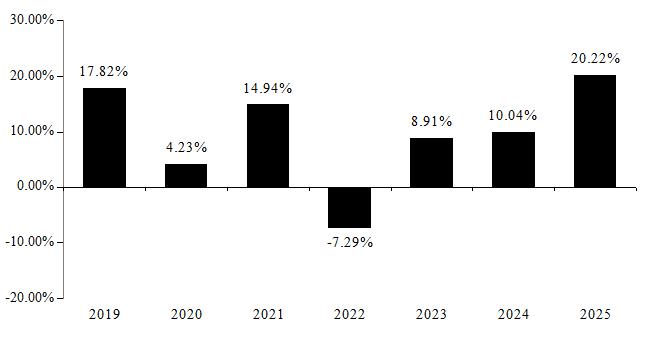
Best Quarter (ended 12/31/2022): 11.17%; Worst Quarter (ended 3/31/2020): -14.94%
| Average Annual Total Returns as of 12/31/2025 | ||||||
| 1 year | 5 year | Life of Fund (August 13, 2018) | ||||
| JNL/American Funds Capital Income Builder Fund (Class A) | 19.86 | % | 8.63 | % | 7.77 | % |
| Morningstar Global Target Market Exposure Index (Net) (reflects no deduction for fees, expenses, or taxes) | 22.23 | % | 11.20 | % | 11.41 | % |
| 70% Morningstar Global Target Market Exposure Index (Net), 30% Bloomberg U.S. Aggregate Index (reflects no deduction for fees, expenses, or taxes) | 17.66 | % | 7.73 | % | 8.75 | % |
| Bloomberg U.S. Aggregate Index (reflects no deduction for fees, expenses, or taxes) | 7.30 | % | -0.36 | % | 2.03 | % |
| Average Annual Total Returns as of 12/31/2025 | ||||||
| 1 year | 5 year | Life of Class (August 13, 2018) | ||||
| JNL/American Funds Capital Income Builder Fund (Class I) | 20.22 | % | 8.95 | % | 8.10 | % |
| Morningstar Global Target Market Exposure Index (Net) (reflects no deduction for fees, expenses, or taxes) | 22.23 | % | 11.20 | % | 11.41 | % |
| 70% Morningstar Global Target Market Exposure Index (Net), 30% Bloomberg U.S. Aggregate Index (reflects no deduction for fees, expenses, or taxes) | 17.66 | % | 7.73 | % | 8.75 | % |
| Bloomberg U.S. Aggregate Index (reflects no deduction for fees, expenses, or taxes) | 7.30 | % | -0.36 | % | 2.03 | % |
The performance information shown provides some indication of the risks of investing in the Fund by showing changes in the Fund’s performance from year to year and by showing how the Fund’s average annual returns compared with those of a broad-based securities market index. Performance results include the effect of expense waiver/reduction arrangements for some or all of the periods shown. If such arrangements had not been in place, performance for those periods would have been lower. The Fund’s past performance is not necessarily an indication of how the Fund will perform in the future.
The returns shown in the bar chart and table do not include charges that will be imposed by variable insurance products. If these amounts were reflected, returns would be less than those shown.
The performance data includes the performance of the JNL/American Funds Global Growth Fund, then a series of the Jackson Variable Series Trust, for periods before the Fund’s registration statement became effective.
Annual Total Returns as of December 31
Class A
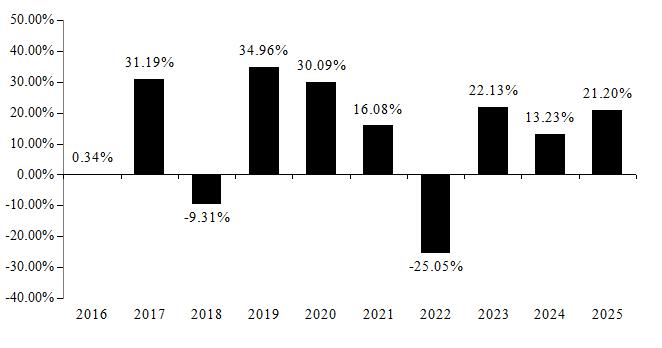
Best Quarter (ended 6/30/2020): 24.25%; Worst Quarter (ended 6/30/2022): -16.74%
Annual Total Returns as of December 31
Class I
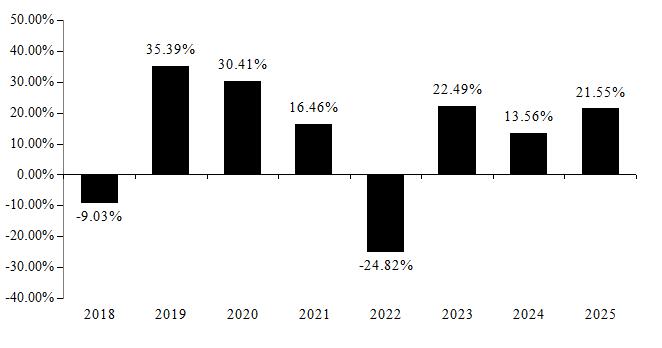
Best Quarter (ended 6/30/2020): 24.29%; Worst Quarter (ended 6/30/2022): -16.66%
| Average Annual Total Returns as of 12/31/2025 | ||||||
| 1 year | 5 year | 10 year | ||||
| JNL/American Funds Global Growth Fund (Class A) | 21.20 | % | 7.84 | % | 11.82 | % |
| Morningstar Global Target Market Exposure Index (Net) (reflects no deduction for fees, expenses, or taxes) | 22.23 | % | 11.20 | % | 11.70 | % |
| Average Annual Total Returns as of 12/31/2025 | ||||||
| 1 year | 5 year | Life of Class (September 25, 2017) | ||||
| JNL/American Funds Global Growth Fund (Class I) | 21.55 | % | 8.16 | % | 11.69 | % |
| Morningstar Global Target Market Exposure Index (Net) (reflects no deduction for fees, expenses, or taxes) | 22.23 | % | 11.20 | % | 11.15 | % |
The performance information shown provides some indication of the risks of investing in the Fund by showing changes in the Fund’s performance from year to year and by showing how the Fund’s average annual returns compared with those of a broad-based securities market index. Performance results include the effect of expense waiver/reduction arrangements for some or all of the periods shown. If such arrangements had not been in place, performance for those periods would have been lower. The Fund’s past performance is not necessarily an indication of how the Fund will perform in the future.
The returns shown in the bar chart and table do not include charges that will be imposed by variable insurance products. If these amounts were reflected, returns would be less than those shown.
The performance data includes the performance of the JNL/American Funds Growth Fund, then a series of the Jackson Variable Series Trust, for periods before the Fund’s registration statement became effective.
Annual Total Returns as of December 31
Class A
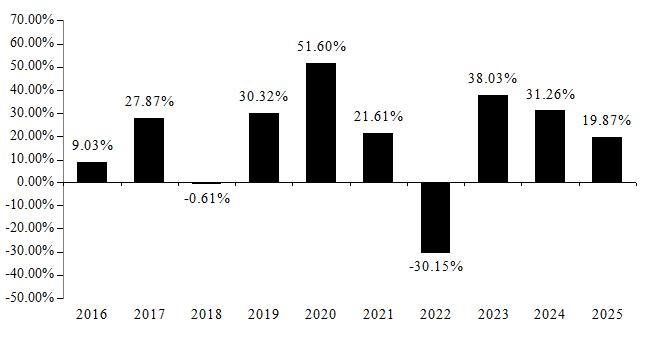
Best Quarter (ended 6/30/2020): 28.54%; Worst Quarter (ended 6/30/2022): -23.11%
Annual Total Returns as of December 31
Class I
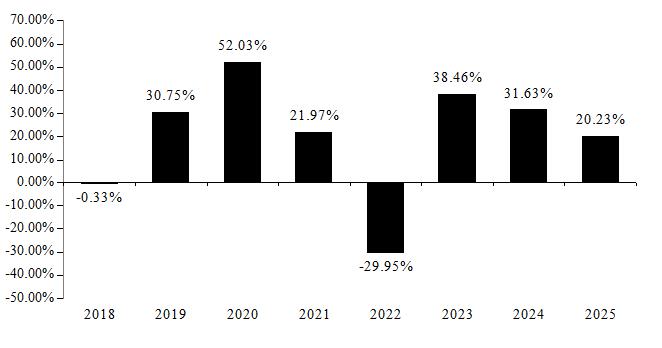
Best Quarter (ended 6/30/2020): 28.63%; Worst Quarter (ended 6/30/2022): -23.07%
| Average Annual Total Returns as of 12/31/2025 | ||||||
| 1 year | 5 year | 10 year | ||||
| JNL/American Funds Growth Fund (Class A) | 19.87 | % | 13.03 | % | 17.58 | % |
| S&P 500 Index (reflects no deduction for fees, expenses, or taxes) | 17.88 | % | 14.42 | % | 14.82 | % |
| Average Annual Total Returns as of 12/31/2025 | ||||||
| 1 year | 5 year | Life of Class (September 25, 2017) | ||||
| JNL/American Funds Growth Fund (Class I) | 20.23 | % | 13.36 | % | 18.15 | % |
| S&P 500 Index (reflects no deduction for fees, expenses, or taxes) | 17.88 | % | 14.42 | % | 14.82 | % |
The performance information shown provides some indication of the risks of investing in the Fund by showing changes in the Fund’s performance from year to year and by showing how the Fund’s average annual returns compared with those of a broad-based securities market index. Performance results include the effect of expense waiver/reduction arrangements for some or all of the periods shown. If such arrangements had not been in place, performance for those periods would have been lower. The Fund’s past performance is not necessarily an indication of how the Fund will perform in the future.
The returns shown in the bar chart and table do not include charges that will be imposed by variable insurance products. If these amounts were reflected, returns would be less than those shown.
Annual Total Returns as of December 31
Class A
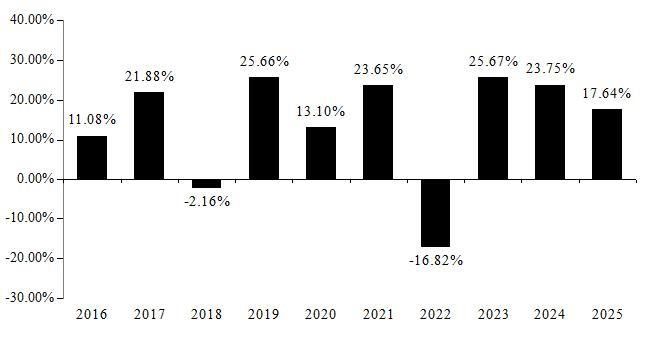
Best Quarter (ended 6/30/2020): 19.91%; Worst Quarter (ended 3/31/2020): -19.87%
Annual Total Returns as of December 31
Class I
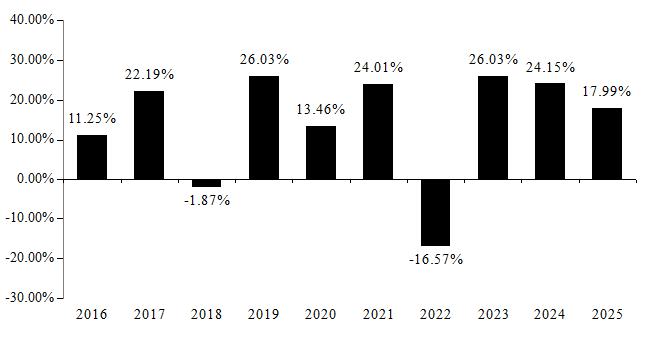
Best Quarter (ended 6/30/2020): 19.96%; Worst Quarter (ended 3/31/2020): -19.79%
| Average Annual Total Returns as of 12/31/2025 | ||||||
| 1 year | 5 year | 10 year | ||||
| JNL/American Funds Growth-Income Fund (Class A) | 17.64 | % | 13.48 | % | 13.48 | % |
| S&P 500 Index (reflects no deduction for fees, expenses, or taxes) | 17.88 | % | 14.42 | % | 14.82 | % |
| Average Annual Total Returns as of 12/31/2025 | ||||||
| 1 year | 5 year | 10 year | ||||
| JNL/American Funds Growth-Income Fund (Class I) | 17.99 | % | 13.82 | % | 13.80 | % |
| S&P 500 Index (reflects no deduction for fees, expenses, or taxes) | 17.88 | % | 14.42 | % | 14.82 | % |
The performance information shown provides some indication of the risks of investing in the Fund by showing changes in the Fund’s performance from year to year and by showing how the Fund’s average annual returns compared with those of a broad-based securities market index. Performance results include the effect of expense waiver/reduction arrangements for some or all of the periods shown. If such arrangements had not been in place, performance for those periods would have been lower. The Fund’s past performance is not necessarily an indication of how the Fund will perform in the future.
The returns shown in the bar chart and table do not include charges that will be imposed by variable insurance products. If these amounts were reflected, returns would be less than those shown.
Annual Total Returns as of December 31
Class A
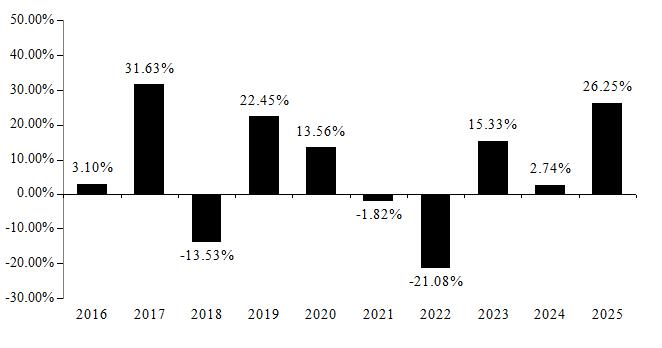
Best Quarter (ended 12/31/2020): 21.56%; Worst Quarter (ended 3/31/2020): -24.66%
Annual Total Returns as of December 31
Class I
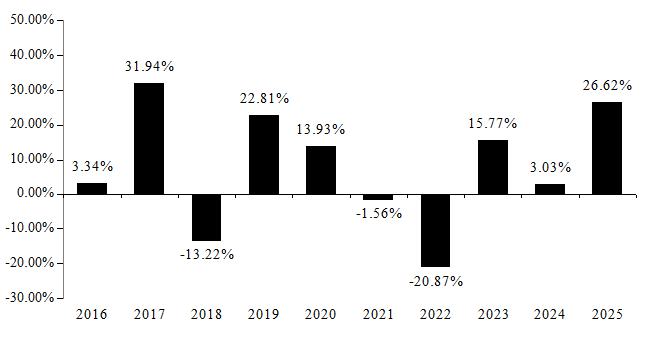
Best Quarter (ended 12/31/2020): 21.67%; Worst Quarter (ended 3/31/2020): -24.62%
| Average Annual Total Returns as of 12/31/2025 | ||||||
| 1 year | 5 year | 10 year | ||||
| JNL/American Funds International Fund (Class A) | 26.25 | % | 3.00 | % | 6.58 | % |
| Morningstar Global ex-US Target Market Exposure Index (Net) (reflects no deduction for fees, expenses, or taxes) | 31.87 | % | 8.05 | % | 8.54 | % |
| Average Annual Total Returns as of 12/31/2025 | ||||||
| 1 year | 5 year | 10 year | ||||
| JNL/American Funds International Fund (Class I) | 26.62 | % | 3.30 | % | 6.89 | % |
| Morningstar Global ex-US Target Market Exposure Index (Net) (reflects no deduction for fees, expenses, or taxes) | 31.87 | % | 8.05 | % | 8.54 | % |
The performance information shown provides some indication of the risks of investing in the Fund by showing changes in the Fund’s performance from year to year and by showing how the Fund’s average annual returns compared with those of a broad-based securities market index. Performance results include the effect of expense waiver/reduction arrangements for some or all of the periods shown. If such arrangements had not been in place, performance for those periods would have been lower. The Fund’s past performance is not necessarily an indication of how the Fund will perform in the future.
The returns shown in the bar chart and table do not include charges that will be imposed by variable insurance products. If these amounts were reflected, returns would be less than those shown.
Annual Total Returns as of December 31
Class A
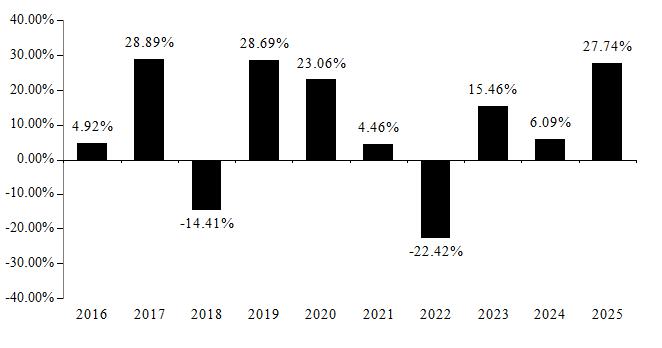
Best Quarter (ended 6/30/2020): 24.50%; Worst Quarter (ended 3/31/2020): -23.19%
Annual Total Returns as of December 31
Class I
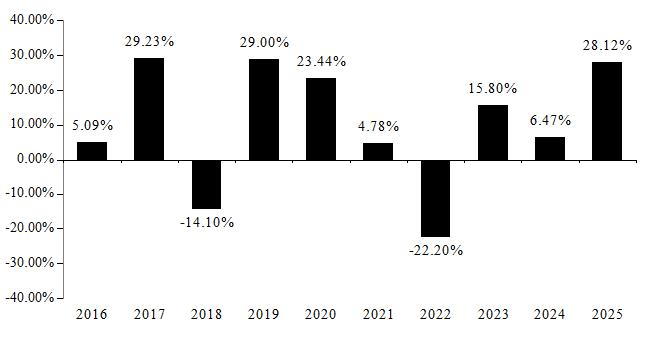
Best Quarter (ended 6/30/2020): 24.62%; Worst Quarter (ended 3/31/2020): -23.17%
| Average Annual Total Returns as of 12/31/2025 | ||||||
| 1 year | 5 year | 10 year | ||||
| JNL/American Funds New World Fund (Class A) | 27.74 | % | 4.86 | % | 8.80 | % |
| Morningstar Global Target Market Exposure Index (Net) (reflects no deduction for fees, expenses, or taxes) | 22.23 | % | 11.20 | % | 11.70 | % |
| Average Annual Total Returns as of 12/31/2025 | ||||||
| 1 year | 5 year | 10 year | ||||
| JNL/American Funds New World Fund (Class I) | 28.12 | % | 5.19 | % | 9.11 | % |
| Morningstar Global Target Market Exposure Index (Net) (reflects no deduction for fees, expenses, or taxes) | 22.23 | % | 11.20 | % | 11.70 | % |
The performance information shown provides some indication of the risks of investing in the Fund by showing changes in the Fund’s performance from year to year and by showing how the Fund’s average annual returns compared with those of a broad-based securities market index. Performance results include the effect of expense waiver/reduction arrangements for some or all of the periods shown. If such arrangements had not been in place, performance for those periods would have been lower. The Fund’s past performance is not necessarily an indication of how the Fund will perform in the future.
The returns shown in the bar chart and table do not include charges that will be imposed by variable insurance products. If these amounts were reflected, returns would be less than those shown.
Annual Total Returns as of December 31
Class A
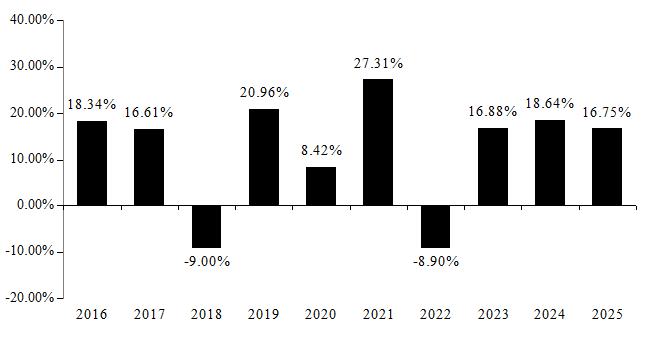
Best Quarter (ended 6/30/2020): 19.54%; Worst Quarter (ended 3/31/2020): -23.49%
Annual Total Returns as of December 31
Class I
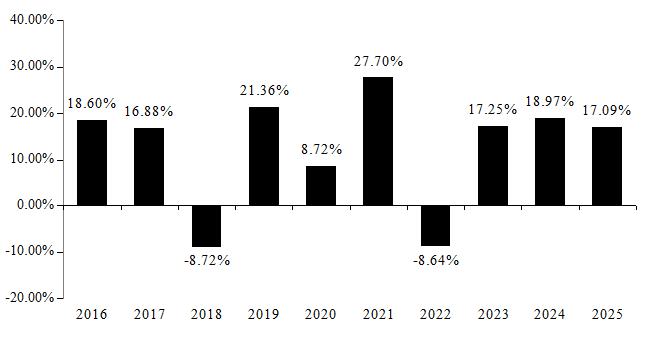
Best Quarter (ended 6/30/2020): 19.67%; Worst Quarter (ended 3/31/2020): -23.46%
| Average Annual Total Returns as of 12/31/2025 | ||||||
| 1 year | 5 year | 10 year | ||||
| JNL/American Funds® Washington Mutual Investors Fund (Class A) | 16.75 | % | 13.43 | % | 11.95 | % |
| S&P 500 Index (reflects no deduction for fees, expenses, or taxes) | 17.88 | % | 14.42 | % | 14.82 | % |
| Average Annual Total Returns as of 12/31/2025 | ||||||
| 1 year | 5 year | 10 year | ||||
| JNL/American Funds® Washington Mutual Investors Fund (Class I) | 17.09 | % | 13.77 | % | 12.27 | % |
| S&P 500 Index (reflects no deduction for fees, expenses, or taxes) | 17.88 | % | 14.42 | % | 14.82 | % |
The performance information shown provides some indication of the risks of investing in the Fund by showing changes in the Fund’s performance from year to year and by showing how the Fund’s average annual returns compared with those of a broad-based securities market index and an additional index that the Adviser believes more closely reflects the market segments in which the Fund invests. Performance results include the effect of expense waiver/reduction arrangements for some or all of the periods shown. If such arrangements had not been in place, performance for those periods would have been lower. The Fund’s past performance is not necessarily an indication of how the Fund will perform in the future.
The returns shown in the bar chart and table do not include charges that will be imposed by variable insurance products. If these amounts were reflected, returns would be less than those shown.
Effective April 27, 2020, the Fund was combined with JNL Institutional Alt 100 Fund, a series of Jackson Variable Series Trust, with the Fund as the surviving Fund. The performance shown is the Fund’s historic performance and does not reflect the performance of the JNL Institutional Alt 100 Fund.
Effective April 26, 2021, the Fund was combined with JNL/Boston Partners Global Long Short Equity Fund (“Acquired Fund”), with the Fund as the surviving Fund. The performance shown is the Fund’s historic performance and does not reflect the performance of the Acquired Fund.
Annual Total Returns as of December 31
Class A
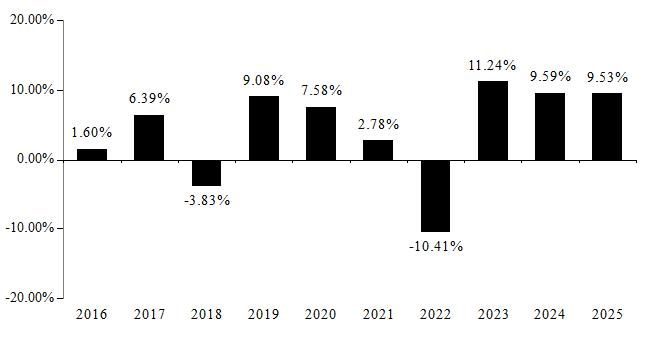
Best Quarter (ended 6/30/2020): 7.68%; Worst Quarter (ended 3/31/2020): -8.61%
Annual Total Returns as of December 31
Class I
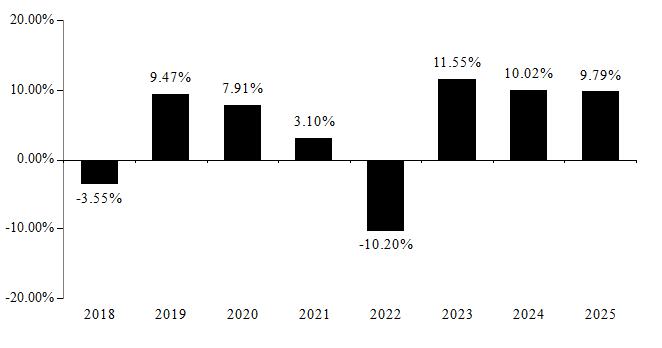
Best Quarter (ended 6/30/2020): 7.73%; Worst Quarter (ended 3/31/2020): -8.56%
| Average Annual Total Returns as of 12/31/2025 | ||||||
| 1 year | 5 year | 10 year | ||||
| JNL Multi-Manager Alternative Fund (Class A) | 9.53 | % | 4.22 | % | 4.14 | % |
| Bloomberg U.S. Aggregate Index (reflects no deduction for fees, expenses, or taxes) | 7.30 | % | -0.36 | % | 2.01 | % |
| Wilshire Liquid Alternative Index (reflects no deduction for fees, expenses, or taxes) | 6.04 | % | 3.06 | % | 2.79 | % |
| Average Annual Total Returns as of 12/31/2025 | ||||||
| 1 year | 5 year | Life of Class (September 25, 2017) | ||||
| JNL Multi-Manager Alternative Fund (Class I) | 9.79 | % | 4.52 | % | 4.48 | % |
| Bloomberg U.S. Aggregate Index (reflects no deduction for fees, expenses, or taxes) | 7.30 | % | -0.36 | % | 1.72 | % |
| Wilshire Liquid Alternative Index (reflects no deduction for fees, expenses, or taxes) | 6.04 | % | 3.06 | % | 2.68 | % |
The performance information shown provides some indication of the risks of investing in the Fund by showing changes in the Fund’s performance from year to year and by showing how the Fund’s average annual returns compared with those of a broad-based securities market index. Performance results include the effect of expense waiver/reduction arrangements for some or all of the periods shown. If such arrangements had not been in place, performance for those periods would have been lower. Performance prior to April 27, 2020 reflects the Fund’s results when managed by the former sub-adviser, Lazard Asset Management LLC, utilizing a different investment strategy. The Fund’s past performance is not necessarily an indication of how the Fund will perform in the future.
The returns shown in the bar chart and table do not include charges that will be imposed by variable insurance products. If these amounts were reflected, returns would be less than those shown.
Effective April 27, 2020, the Fund was combined with JNL/Invesco China-India Fund and JNL/Oppenheimer Emerging Markets Innovator Fund (together, the “Acquired Funds”), each a series of JNL Series Trust, with the Fund as the surviving Fund. The performance shown is the Fund’s historic performance and does not reflect the performance of the Acquired Funds.
Effective April 27, 2026, the Fund was combined with JNL/WCM China Quality Growth Fund (“Acquired Fund”), with the Fund as the surviving Fund. The performance shown is the Fund’s historic performance and does not reflect the performance of the Acquired Fund.
Annual Total Returns as of December 31
Class A
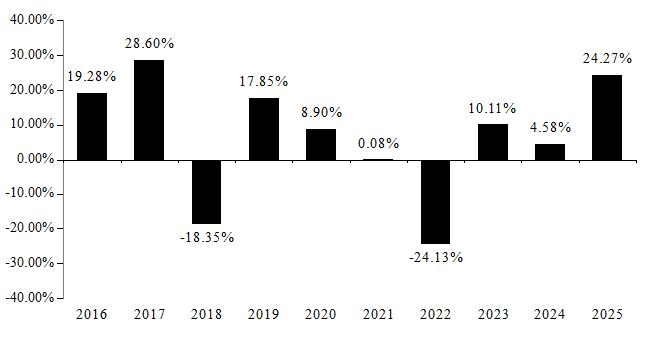
Best Quarter (ended 12/31/2020): 21.37%; Worst Quarter (ended 3/31/2020): -30.35%
Annual Total Returns as of December 31
Class I
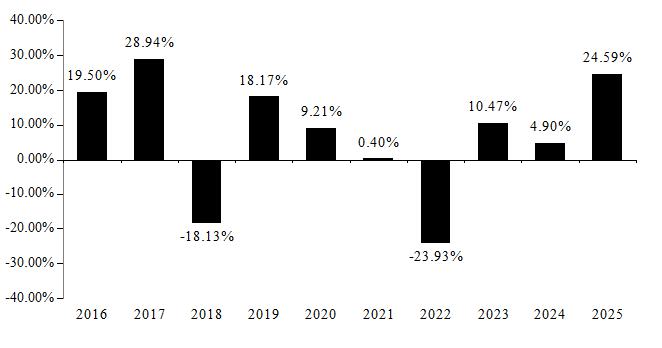
Best Quarter (ended 12/31/2020): 21.44%; Worst Quarter (ended 3/31/2020): -30.29%
| Average Annual Total Returns as of 12/31/2025 | ||||||
| 1 year | 5 year | 10 year | ||||
| JNL Multi-Manager Emerging Markets Equity Fund (Class A) | 24.27 | % | 1.67 | % | 5.73 | % |
| Morningstar Emerging Markets Index (Net) (reflects no deduction for fees, expenses, or taxes) | 29.76 | % | 4.76 | % | 8.66 | % |
| Average Annual Total Returns as of 12/31/2025 | ||||||
| 1 year | 5 year | 10 year | ||||
| JNL Multi-Manager Emerging Markets Equity Fund (Class I) | 24.59 | % | 1.97 | % | 6.02 | % |
| Morningstar Emerging Markets Index (Net) (reflects no deduction for fees, expenses, or taxes) | 29.76 | % | 4.76 | % | 8.66 | % |
The performance information shown provides some indication of the risks of investing in the Fund by showing changes in the Fund’s performance from year to year and by showing how the Fund’s average annual returns compared with those of a broad-based securities market index and an additional index that the Adviser believes more closely reflects the market segments in which the Fund invests. The Fund’s past performance is not necessarily an indication of how the Fund will perform in the future.
The returns shown in the bar chart and table do not include charges that will be imposed by variable insurance products. If these amounts were reflected, returns would be less than those shown.
Annual Total Returns as of December 31
Class A
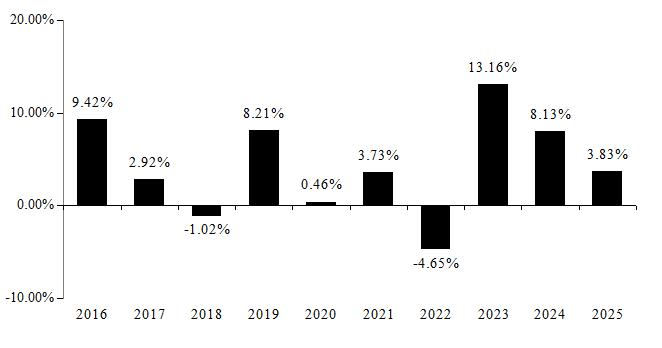
Best Quarter (ended 6/30/2020): 7.94%; Worst Quarter (ended 3/31/2020): -12.52%
Annual Total Returns as of December 31
Class I
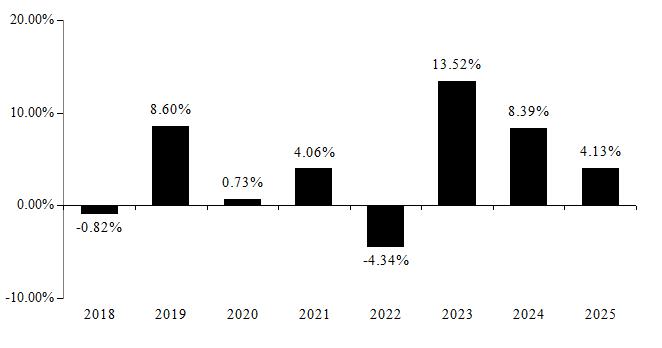
Best Quarter (ended 6/30/2020): 8.00%; Worst Quarter (ended 3/31/2020): -12.47%
| Average Annual Total Returns as of 12/31/2025 | ||||||
| 1 year | 5 year | 10 year | ||||
| JNL Multi-Manager Floating Rate Income Fund (Class A) | 3.83 | % | 4.67 | % | 4.29 | % |
| Bloomberg U.S. Aggregate Index (reflects no deduction for fees, expenses, or taxes) | 7.30 | % | -0.36 | % | 2.01 | % |
| Morningstar LSTA US Leveraged Loan Index (reflects no deduction for fees, expenses, or taxes) | 5.90 | % | 6.42 | % | 5.83 | % |
| Average Annual Total Returns as of 12/31/2025 | ||||||
| 1 year | 5 year | Life of Class (September 25, 2017) | ||||
| JNL Multi-Manager Floating Rate Income Fund (Class I) | 4.13 | % | 4.99 | % | 4.13 | % |
| Bloomberg U.S. Aggregate Index (reflects no deduction for fees, expenses, or taxes) | 7.30 | % | -0.36 | % | 1.72 | % |
| Morningstar LSTA US Leveraged Loan Index (reflects no deduction for fees, expenses, or taxes) | 5.90 | % | 6.42 | % | 5.48 | % |
The performance information shown provides some indication of the risks of investing in the Fund by showing changes in the Fund’s performance from year to year and by showing how the Fund’s average annual returns compared with those of a broad-based securities market index and an additional index that the Adviser believes more closely reflects the market segments in which the Fund invests. Performance results include the effect of expense waiver/reduction arrangements for some or all of the periods shown. If such arrangements had not been in place, performance for those periods would have been lower. Performance prior to April 27, 2026 reflects the Fund’s results when the Fund operated as a feeder fund in a master-feeder arrangement. The Fund’s past performance is not necessarily an indication of how the Fund will perform in the future.
The returns shown in the bar chart and table do not include charges that will be imposed by variable insurance products. If these amounts were reflected, returns would be less than those shown.
Annual Total Returns as of December 31
Class A
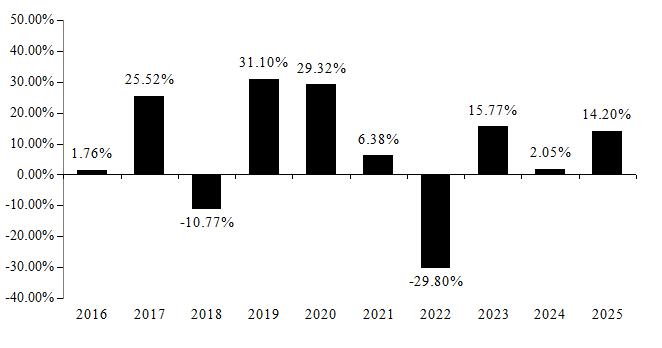
Best Quarter (ended 6/30/2020): 29.25%; Worst Quarter (ended 3/31/2020): -25.29%
Annual Total Returns as of December 31
Class I
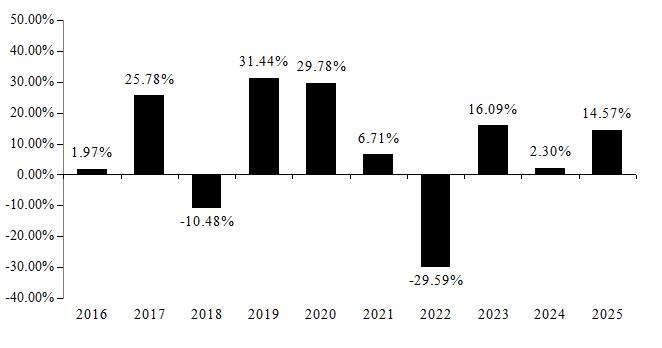
Best Quarter (ended 6/30/2020): 29.27%; Worst Quarter (ended 3/31/2020): -25.16%
| Average Annual Total Returns as of 12/31/2025 | ||||||
| 1 year | 5 year | 10 year | ||||
| JNL Multi-Manager Global Small Cap Fund (Class A) | 14.20 | % | 0.15 | % | 6.89 | % |
| Morningstar Global Target Market Exposure Index (Net) (reflects no deduction for fees, expenses, or taxes) | 22.23 | % | 11.20 | % | 11.70 | % |
| Morningstar Global Small Cap Target Market Exposure Index (Net) (reflects no deduction for fees, expenses, or taxes) | 19.96 | % | 6.65 | % | 8.93 | % |
| Average Annual Total Returns as of 12/31/2025 | ||||||
| 1 year | 5 year | 10 year | ||||
| JNL Multi-Manager Global Small Cap Fund (Class I) | 14.57 | % | 0.44 | % | 7.19 | % |
| Morningstar Global Target Market Exposure Index (Net) (reflects no deduction for fees, expenses, or taxes) | 22.23 | % | 11.20 | % | 11.70 | % |
| Morningstar Global Small Cap Target Market Exposure Index (Net) (reflects no deduction for fees, expenses, or taxes) | 19.96 | % | 6.65 | % | 8.93 | % |
The performance information shown provides some indication of the risks of investing in the Fund by showing changes in the Fund’s performance from year to year and by showing how the Fund’s average annual returns compared with those of a broad-based securities market index. Performance from April 25, 2022 to April 27, 2026, reflects the Fund’s results when managed solely by William Blair Investment Management, LLC. Performance prior to April 25, 2022 reflects the Fund’s results when managed by the former sub-adviser, Invesco Advisers, Inc. Performance results include the effect of expense waiver/reduction arrangements for some or all of the periods shown. If such arrangements had not been in place, performance for those periods would have been lower. The Fund’s past performance is not necessarily an indication of how the Fund will perform in the future.
The returns shown in the bar chart and table do not include charges that will be imposed by variable insurance products. If these amounts were reflected, returns would be less than those shown.
Effective April 27, 2026, the Fund was combined with JNL/Lazard International Quality Growth Fund (“Acquired Fund”), with the Fund as the surviving Fund. The performance shown is the Fund’s historic performance and does not reflect the performance of the Acquired Fund.
Annual Total Returns as of December 31
Class A
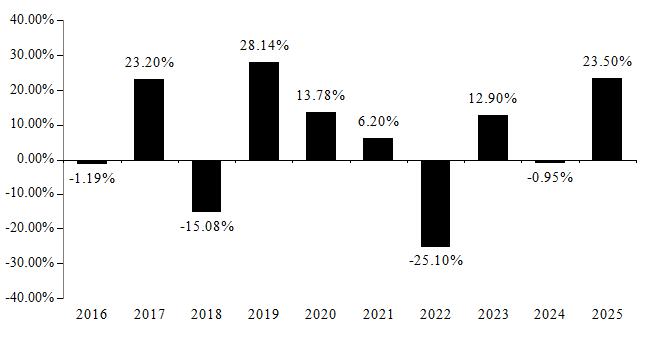
Best Quarter (ended 6/30/2020): 18.39%; Worst Quarter (ended 3/31/2020): -22.16%
Annual Total Returns as of December 31
Class I
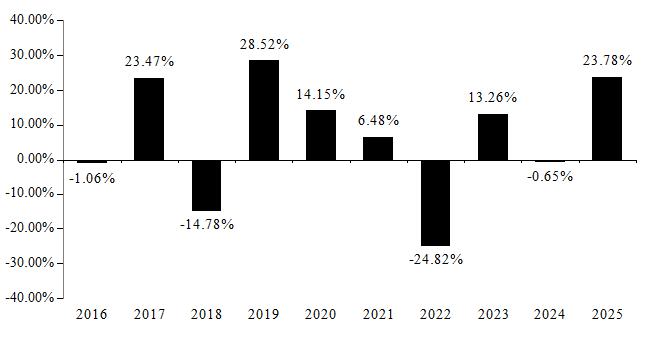
Best Quarter (ended 6/30/2020): 18.47%; Worst Quarter (ended 3/31/2020): -22.06%
| Average Annual Total Returns as of 12/31/2025 | ||||||
| 1 year | 5 year | 10 year | ||||
| JNL Multi-Manager International Equity Fund (Class A) | 23.50 | % | 1.90 | % | 5.17 | % |
| Morningstar Global ex-US Target Market Exposure Index (Net) (reflects no deduction for fees, expenses, or taxes) | 31.87 | % | 8.05 | % | 8.54 | % |
| Average Annual Total Returns as of 12/31/2025 | ||||||
| 1 year | 5 year | 10 year | ||||
| JNL Multi-Manager International Equity Fund (Class I) | 23.78 | % | 2.20 | % | 5.47 | % |
| Morningstar Global ex-US Target Market Exposure Index (Net) (reflects no deduction for fees, expenses, or taxes) | 31.87 | % | 8.05 | % | 8.54 | % |
The performance information shown provides some indication of the risks of investing in the Fund by showing changes in the Fund’s performance from year to year and by showing how the Fund’s average annual returns compared with those of a broad-based securities market index and an additional index that the Adviser believes more closely reflects the market segments in which the Fund invests. The Fund’s past performance is not necessarily an indication of how the Fund will perform in the future.
The returns shown in the bar chart and table do not include charges that will be imposed by variable insurance products. If these amounts were reflected, returns would be less than those shown.
Effective April 26, 2021, the Fund was combined with JNL/Franklin Templeton International Small Cap Fund (“Acquired Fund”), with the Fund as the surviving Fund. The performance shown is the Fund’s historic performance and does not reflect the performance of the Acquired Fund.
Annual Total Returns as of December 31
Class A
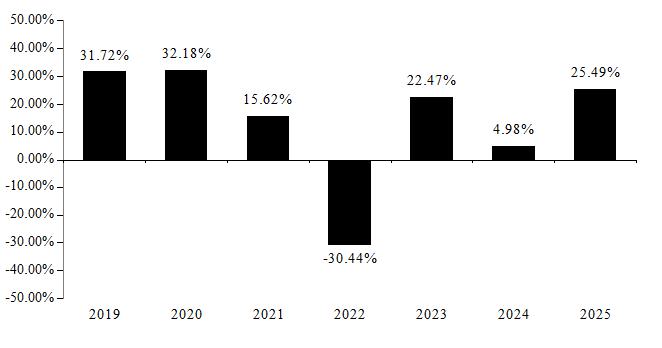
Best Quarter (ended 6/30/2020): 33.42%; Worst Quarter (ended 3/31/2020): -25.68%
Annual Total Returns as of December 31
Class I
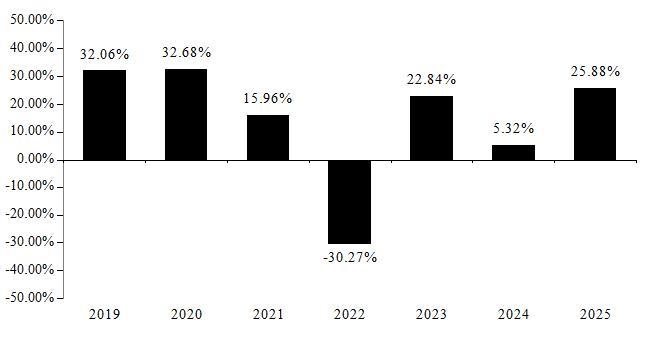
Best Quarter (ended 6/30/2020): 33.50%; Worst Quarter (ended 3/31/2020): -25.59%
| Average Annual Total Returns as of 12/31/2025 | ||||||
| 1 year | 5 year | Life of Fund (August 13, 2018) | ||||
| JNL Multi-Manager International Small Cap Fund (Class A) | 25.49 | % | 5.35 | % | 8.49 | % |
| Morningstar Global ex-US Target Market Exposure Index (Net) (reflects no deduction for fees, expenses, or taxes) | 31.87 | % | 8.05 | % | 8.10 | % |
| Morningstar Global ex-US Small Cap Target Market Exposure Index (Net) (reflects no deduction for fees, expenses, or taxes) | 30.29 | % | 6.18 | % | 6.54 | % |
| Average Annual Total Returns as of 12/31/2025 | ||||||
| 1 year | 5 year | Life of Class (August 13, 2018) | ||||
| JNL Multi-Manager International Small Cap Fund (Class I) | 25.88 | % | 5.66 | % | 8.82 | % |
| Morningstar Global ex-US Target Market Exposure Index (Net) (reflects no deduction for fees, expenses, or taxes) | 31.87 | % | 8.05 | % | 8.10 | % |
| Morningstar Global ex-US Small Cap Target Market Exposure Index (Net) (reflects no deduction for fees, expenses, or taxes) | 30.29 | % | 6.18 | % | 6.54 | % |
The performance information shown provides some indication of the risks of investing in the Fund by showing changes in the Fund’s performance from year to year and by showing how the Fund’s average annual returns compared with those of a broad-based securities market index and an additional index that the Adviser believes more closely reflects the market segments in which the Fund invests. The Fund’s past performance is not necessarily an indication of how the Fund will perform in the future.
The returns shown in the bar chart and table do not include charges that will be imposed by variable insurance products. If these amounts were reflected, returns would be less than those shown.
Annual Total Returns as of December 31
Class A
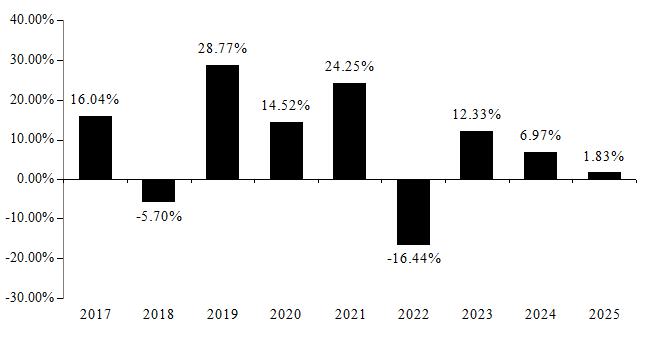
Best Quarter (ended 6/30/2020): 21.99%; Worst Quarter (ended 3/31/2020): -25.02%
Annual Total Returns as of December 31
Class I
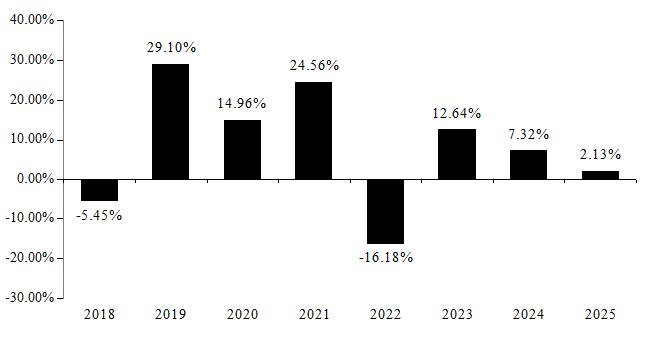
Best Quarter (ended 6/30/2020): 22.08%; Worst Quarter (ended 3/31/2020): -24.93%
| Average Annual Total Returns as of 12/31/2025 | ||||||
| 1 year | 5 year | Life of Fund (September 19, 2016) | ||||
| JNL Multi-Manager Mid Cap Fund (Class A) | 1.83 | % | 4.90 | % | 8.80 | % |
| Morningstar US Market Extended Index (reflects no deduction for fees, expenses, or taxes) | 17.21 | % | 13.13 | % | 14.69 | % |
| Morningstar US Mid Cap Index (reflects no deduction for fees, expenses, or taxes) | 10.12 | % | 8.91 | % | 11.52 | % |
| Average Annual Total Returns as of 12/31/2025 | ||||||
| 1 year | 5 year | Life of Class (September 25, 2017) | ||||
| JNL Multi-Manager Mid Cap Fund (Class I) | 2.13 | % | 5.21 | % | 8.24 | % |
| Morningstar US Market Extended Index (reflects no deduction for fees, expenses, or taxes) | 17.21 | % | 13.13 | % | 14.16 | % |
| Morningstar US Mid Cap Index (reflects no deduction for fees, expenses, or taxes) | 10.12 | % | 8.91 | % | 10.86 | % |
The performance information shown provides some indication of the risks of investing in the Fund by showing changes in the Fund’s performance from year to year and by showing how the Fund’s average annual returns compared with those of a broad-based securities market index. Performance results include the effect of expense waiver/reduction arrangements for some or all of the periods shown. If such arrangements had not been in place, performance for those periods would have been lower. The Fund’s past performance is not necessarily an indication of how the Fund will perform in the future.
The returns shown in the bar chart and table do not include charges that will be imposed by variable insurance products. If these amounts were reflected, returns would be less than those shown.
Effective October 21, 2024, the Fund was combined with the JNL/Baillie Gifford U.S. Equity Growth Fund (“Acquired Fund”), with the Fund as the surviving Fund. The performance shown is the Fund’s historical performance and does not reflect the performance of the Acquired Fund.
Annual Total Returns as of December 31
Class A
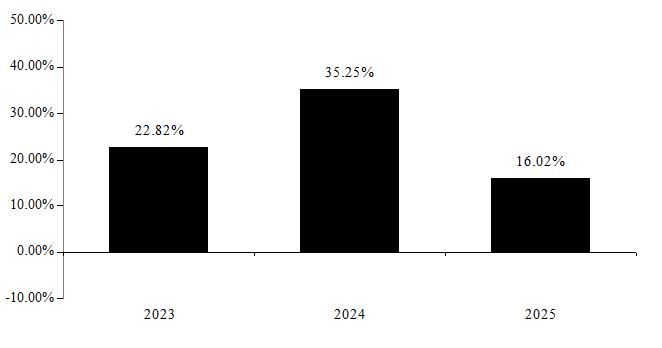
Best Quarter (ended 3/31/2024): 19.67%; Worst Quarter (ended 9/30/2023): -3.34%
Annual Total Returns as of December 31
Class I
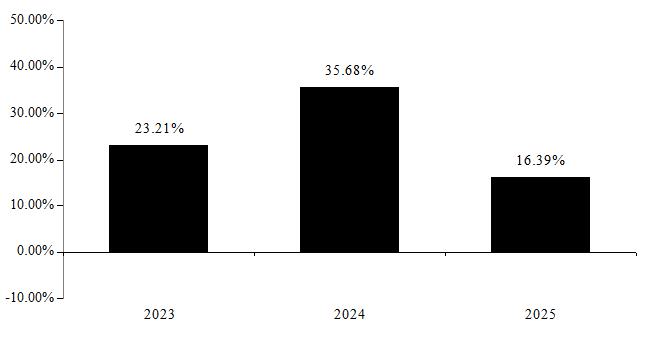
Best Quarter (ended 3/31/2024): 19.75%; Worst Quarter (ended 9/30/2023): -3.24%
| Average Annual Total Returns as of 12/31/2025 | ||||
| 1 year | Life of Fund (November 15, 2022) | |||
| JNL Multi-Manager Select Equity Fund (Class A) | 16.02 | % | 22.42 | % |
| Morningstar US Target Market Exposure Index (reflects no deduction for fees, expenses, or taxes) | 17.80 | % | 21.02 | % |
| Average Annual Total Returns as of 12/31/2025 | ||||
| 1 year | Life of Class (November 15, 2022) | |||
| JNL Multi-Manager Select Equity Fund (Class I) | 16.39 | % | 22.83 | % |
| Morningstar US Target Market Exposure Index (reflects no deduction for fees, expenses, or taxes) | 17.80 | % | 21.02 | % |
The performance information shown provides some indication of the risks of investing in the Fund by showing changes in the Fund’s performance from year to year and by showing how the Fund’s average annual returns compared with those of a broad-based securities market index and an additional index that the Adviser believes more closely reflects the market segments in which the Fund invests. The Fund’s past performance is not necessarily an indication of how the Fund will perform in the future.
The returns shown in the bar chart and table do not include charges that will be imposed by variable insurance products. If these amounts were reflected, returns would be less than those shown.
Effective April 26, 2021, the Fund was combined with JNL/Vanguard Small Company Growth Fund (“Acquired Fund”), with the Fund as the surviving Fund. The performance shown is the Fund’s historic performance and does not reflect the performance of the Acquired Fund.
Annual Total Returns as of December 31
Class A
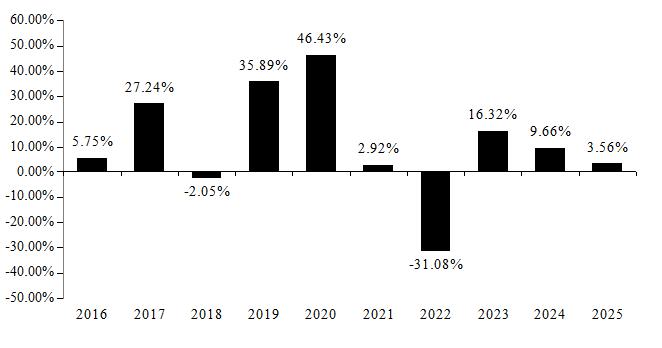
Best Quarter (ended 6/30/2020): 36.71%; Worst Quarter (ended 6/30/2022): -21.59%
Annual Total Returns as of December 31
Class I
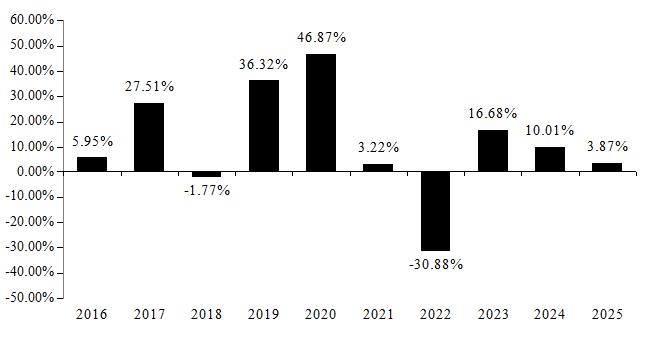
Best Quarter (ended 6/30/2020): 36.86%; Worst Quarter (ended 6/30/2022): -21.52%
| Average Annual Total Returns as of 12/31/2025 | ||||||
| 1 year | 5 year | 10 year | ||||
| JNL Multi-Manager Small Cap Growth Fund (Class A) | 3.56 | % | -1.29 | % | 9.41 | % |
| Morningstar US Market Extended Index (reflects no deduction for fees, expenses, or taxes) | 17.21 | % | 13.13 | % | 14.31 | % |
| Morningstar US Small Cap Broad Growth Extended Index (reflects no deduction for fees, expenses, or taxes) | 13.12 | % | 4.22 | % | 9.92 | % |
| Average Annual Total Returns as of 12/31/2025 | ||||||
| 1 year | 5 year | 10 year | ||||
| JNL Multi-Manager Small Cap Growth Fund (Class I) | 3.87 | % | -0.99 | % | 9.71 | % |
| Morningstar US Market Extended Index (reflects no deduction for fees, expenses, or taxes) | 17.21 | % | 13.13 | % | 14.31 | % |
| Morningstar US Small Cap Broad Growth Extended Index (reflects no deduction for fees, expenses, or taxes) | 13.12 | % | 4.22 | % | 9.92 | % |
The performance information shown provides some indication of the risks of investing in the Fund by showing changes in the Fund’s performance from year to year and by showing how the Fund’s average annual returns compared with those of a broad-based securities market index and an additional index that the Adviser believes more closely reflects the market segments in which the Fund invests. The Fund’s past performance is not necessarily an indication of how the Fund will perform in the future.
The returns shown in the bar chart and table do not include charges that will be imposed by variable insurance products. If these amounts were reflected, returns would be less than those shown.
Effective April 26, 2021, the Fund was combined with JNL/PPM America Small Cap Value Fund (“Acquired Fund”), with the Fund as the surviving Fund. The performance shown is the Fund’s historic performance and does not reflect the performance of the Acquired Fund.
Annual Total Returns as of December 31
Class A
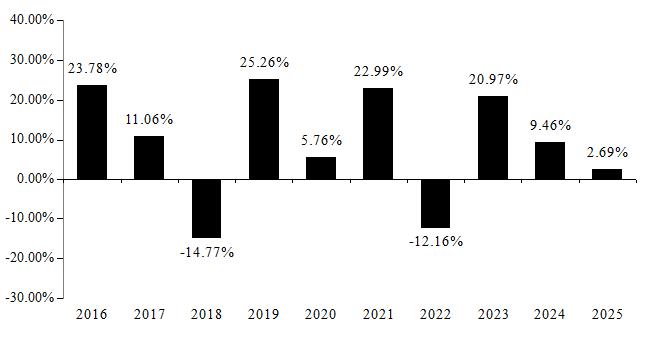
Best Quarter (ended 12/31/2020): 28.30%; Worst Quarter (ended 3/31/2020): -34.79%
Annual Total Returns as of December 31
Class I
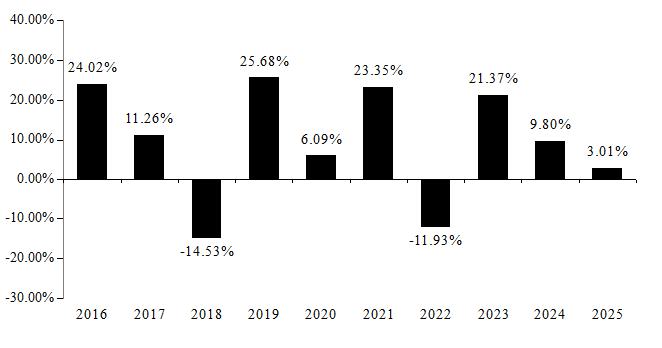
Best Quarter (ended 12/31/2020): 28.37%; Worst Quarter (ended 3/31/2020): -34.71%
| Average Annual Total Returns as of 12/31/2025 | ||||||
| 1 year | 5 year | 10 year | ||||
| JNL Multi-Manager Small Cap Value Fund (Class A) | 2.69 | % | 8.00 | % | 8.59 | % |
| Morningstar US Market Extended Index (reflects no deduction for fees, expenses, or taxes) | 17.21 | % | 13.13 | % | 14.31 | % |
| Morningstar US Small Cap Broad Value Extended Index (reflects no deduction for fees, expenses, or taxes) | 10.48 | % | 10.32 | % | 9.50 | % |
| Average Annual Total Returns as of 12/31/2025 | ||||||
| 1 year | 5 year | 10 year | ||||
| JNL Multi-Manager Small Cap Value Fund (Class I) | 3.01 | % | 8.32 | % | 8.90 | % |
| Morningstar US Market Extended Index (reflects no deduction for fees, expenses, or taxes) | 17.21 | % | 13.13 | % | 14.31 | % |
| Morningstar US Small Cap Broad Value Extended Index (reflects no deduction for fees, expenses, or taxes) | 10.48 | % | 10.32 | % | 9.50 | % |
The performance information shown provides some indication of the risks of investing in the Fund by showing changes in the Fund’s performance from year to year and by showing how the Fund’s average annual returns compared with those of a broad-based securities market index and additional indices that the Adviser believes more closely reflect the market segments in which the Fund invests. Performance results include the effect of expense waiver/reduction arrangements for some or all of the periods shown. If such arrangements had not been in place, performance for those periods would have been lower. The Fund’s past performance is not necessarily an indication of how the Fund will perform in the future.
The returns shown in the bar chart and table do not include charges that will be imposed by variable insurance products. If these amounts were reflected, returns would be less than those shown.
The performance data includes the performance of the JNL iShares Tactical Moderate Fund, then a series of the Jackson Variable Series Trust, for periods before the Fund’s registration statement became effective.
Consistent with the Fund’s principal investment strategies, the Fund uses the 40% Morningstar Global Target Market Exposure Index (Net), 60% Bloomberg U.S. Aggregate Index as the Fund’s tertiary benchmark.
Annual Total Returns as of December 31
Class A
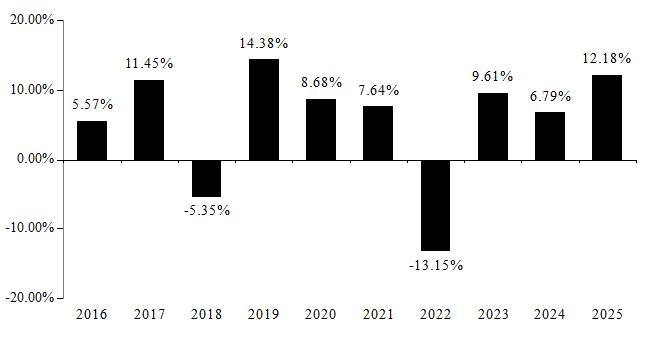
Best Quarter (ended 6/30/2020): 9.47%; Worst Quarter (ended 3/31/2020): -10.25%
Annual Total Returns as of December 31
Class I
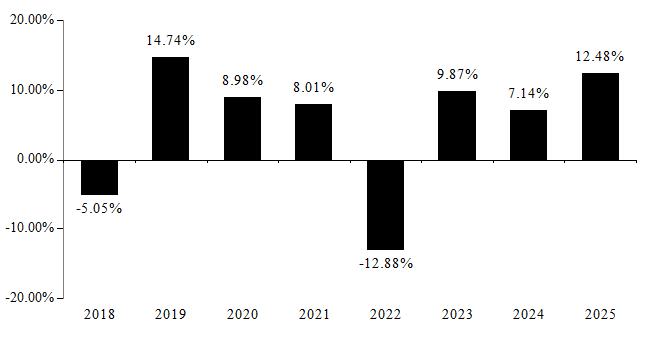
Best Quarter (ended 6/30/2020): 9.60%; Worst Quarter (ended 3/31/2020): -10.21%
| Average Annual Total Returns as of 12/31/2025 | ||||||
| 1 year | 5 year | 10 year | ||||
| JNL Moderate ETF Allocation Fund (Class A) | 12.18 | % | 4.18 | % | 5.44 | % |
| Bloomberg U.S. Aggregate Index (reflects no deduction for fees, expenses, or taxes) | 7.30 | % | -0.36 | % | 2.01 | % |
| Morningstar Moderately Conservative Target Risk Index (reflects no deduction for fees, expenses, or taxes) | 12.87 | % | 4.06 | % | 6.10 | % |
| 40% Morningstar Global Target Market Exposure Index (Net), 60% Bloomberg U.S. Aggregate Index (reflects no deduction for fees, expenses, or taxes) | 13.17 | % | 4.26 | % | 6.01 | % |
| Morningstar Global Target Market Exposure Index (Net) (reflects no deduction for fees, expenses, or taxes) | 22.23 | % | 11.20 | % | 11.70 | % |
| Average Annual Total Returns as of 12/31/2025 | ||||||
| 1 year | 5 year | Life of Class (September 25, 2017) | ||||
| JNL Moderate ETF Allocation Fund (Class I) | 12.48 | % | 4.50 | % | 5.30 | % |
| Bloomberg U.S. Aggregate Index (reflects no deduction for fees, expenses, or taxes) | 7.30 | % | -0.36 | % | 1.72 | % |
| Morningstar Moderately Conservative Target Risk Index (reflects no deduction for fees, expenses, or taxes) | 12.87 | % | 4.06 | % | 5.60 | % |
| 40% Morningstar Global Target Market Exposure Index (Net), 60% Bloomberg U.S. Aggregate Index (reflects no deduction for fees, expenses, or taxes) | 13.17 | % | 4.26 | % | 5.64 | % |
| Morningstar Global Target Market Exposure Index (Net) (reflects no deduction for fees, expenses, or taxes) | 22.23 | % | 11.20 | % | 11.15 | % |
The performance information shown provides some indication of the risks of investing in the Fund by showing changes in the Fund’s performance from year to year and by showing how the Fund’s average annual returns compared with those of a broad-based securities market index and additional indices that the Adviser believes more closely reflects the market segments in which the Fund invests. Performance results include the effect of expense waiver/reduction arrangements for some or all of the periods shown. If such arrangements had not been in place, performance for those periods would have been lower. The Fund’s past performance is not necessarily an indication of how the Fund will perform in the future.
The returns shown in the bar chart and table do not include charges that will be imposed by variable insurance products. If these amounts were reflected, returns would be less than those shown.
The performance data includes the performance of the JNL iShares Tactical Moderate Growth Fund, then a series of the Jackson Variable Series Trust, for periods before the Fund’s registration statement became effective.
Consistent with the Fund’s principal investment strategies, the Fund uses the 60% Morningstar Global Target Market Exposure Index (Net), 40% Bloomberg U.S. Aggregate Index as the Fund’s tertiary benchmark.
Annual Total Returns as of December 31
Class A
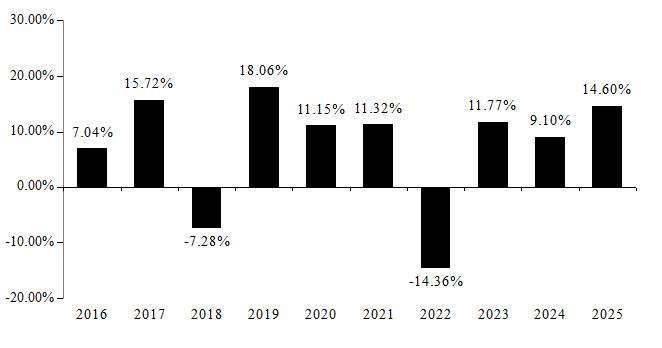
Best Quarter (ended 6/30/2020): 12.75%; Worst Quarter (ended 3/31/2020): -14.31%
Annual Total Returns as of December 31
Class I
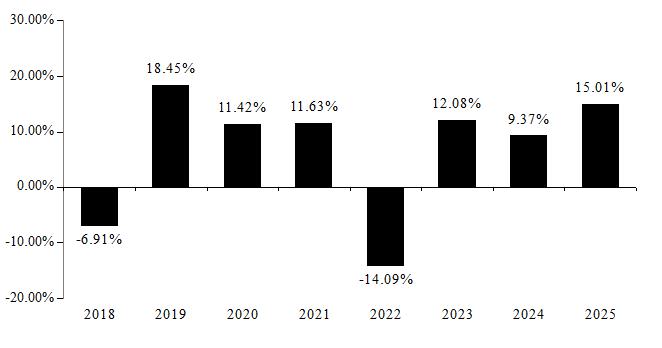
Best Quarter (ended 6/30/2020): 12.79%; Worst Quarter (ended 3/31/2020): -14.27%
| Average Annual Total Returns as of 12/31/2025 | ||||||
| 1 year | 5 year | 10 year | ||||
| JNL Moderate Growth ETF Allocation Fund (Class A) | 14.60 | % | 5.90 | % | 7.22 | % |
| Morningstar Global Target Market Exposure Index (Net) (reflects no deduction for fees, expenses, or taxes) | 22.23 | % | 11.20 | % | 11.70 | % |
| Morningstar Moderate Target Risk Index (reflects no deduction for fees, expenses, or taxes) | 15.95 | % | 5.95 | % | 7.83 | % |
| 60% Morningstar Global Target Market Exposure Index (Net), 40% Bloomberg U.S. Aggregate Index (reflects no deduction for fees, expenses, or taxes) | 16.16 | % | 6.57 | % | 7.95 | % |
| Bloomberg U.S. Aggregate Index (reflects no deduction for fees, expenses, or taxes) | 7.30 | % | -0.36 | % | 2.01 | % |
| Average Annual Total Returns as of 12/31/2025 | ||||||
| 1 year | 5 year | Life of Class (September 25, 2017) | ||||
| JNL Moderate Growth ETF Allocation Fund (Class I) | 15.01 | % | 6.22 | % | 6.93 | % |
| Morningstar Global Target Market Exposure Index (Net) (reflects no deduction for fees, expenses, or taxes) | 22.23 | % | 11.20 | % | 11.15 | % |
| Morningstar Moderate Target Risk Index (reflects no deduction for fees, expenses, or taxes) | 15.95 | % | 5.95 | % | 7.18 | % |
| 60% Morningstar Global Target Market Exposure Index (Net), 40% Bloomberg U.S. Aggregate Index (reflects no deduction for fees, expenses, or taxes) | 16.16 | % | 6.57 | % | 7.53 | % |
| Bloomberg U.S. Aggregate Index (reflects no deduction for fees, expenses, or taxes) | 7.30 | % | -0.36 | % | 1.72 | % |
The performance information shown provides some indication of the risks of investing in the Fund by showing changes in the Fund’s performance from year to year and by showing how the Fund’s average annual returns compared with those of a broad-based securities market index and additional indices that the Adviser believes more closely reflects the market segments in which the Fund invests. Performance results include the effect of expense waiver/reduction arrangements for some or all of the periods shown. If such arrangements had not been in place, performance for those periods would have been lower. The Fund’s past performance is not necessarily an indication of how the Fund will perform in the future.
The returns shown in the bar chart and table do not include charges that will be imposed by variable insurance products. If these amounts were reflected, returns would be less than those shown.
The performance data includes the performance of the JNL iShares Tactical Growth Fund, then a series of the Jackson Variable Series Trust, for periods before the Fund’s registration statement became effective.
Consistent with the Fund’s principal investment strategies, the Fund uses the 80% Morningstar Global Target Market Exposure Index (Net), 20% Bloomberg U.S. Aggregate Index as the Fund’s tertiary benchmark.
Annual Total Returns as of December 31
Class A
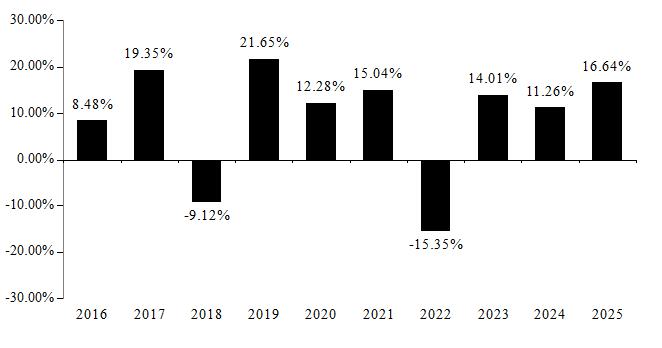
Best Quarter (ended 6/30/2020): 15.87%; Worst Quarter (ended 3/31/2020): -19.06%
Annual Total Returns as of December 31
Class I
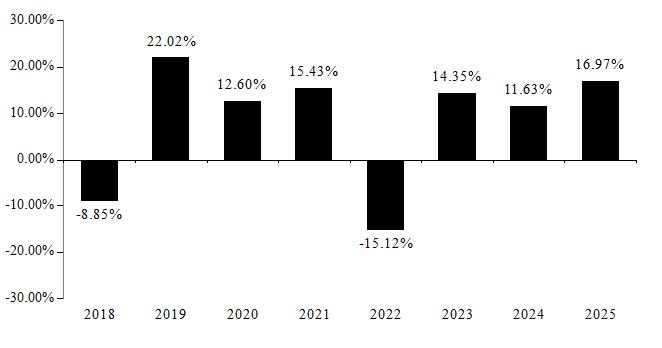
Best Quarter (ended 6/30/2020): 15.98%; Worst Quarter (ended 3/31/2020): -19.01%
| Average Annual Total Returns as of 12/31/2025 | ||||||
| 1 year | 5 year | 10 year | ||||
| JNL Growth ETF Allocation Fund (Class A) | 16.64 | % | 7.58 | % | 8.76 | % |
| Morningstar Global Target Market Exposure Index (Net) (reflects no deduction for fees, expenses, or taxes) | 22.23 | % | 11.20 | % | 11.70 | % |
| Morningstar Moderately Aggressive Target Risk Index (reflects no deduction for fees, expenses, or taxes) | 18.45 | % | 7.94 | % | 9.59 | % |
| 80% Morningstar Global Target Market Exposure Index (Net), 20% Bloomberg U.S. Aggregate Index (reflects no deduction for fees, expenses, or taxes) | 19.18 | % | 8.89 | % | 9.85 | % |
| Bloomberg U.S. Aggregate Index (reflects no deduction for fees, expenses, or taxes) | 7.30 | % | -0.36 | % | 2.01 | % |
| Average Annual Total Returns as of 12/31/2025 | ||||||
| 1 year | 5 year | Life of Class (September 25, 2017) | ||||
| JNL Growth ETF Allocation Fund (Class I) | 16.97 | % | 7.91 | % | 8.37 | % |
| Morningstar Global Target Market Exposure Index (Net) (reflects no deduction for fees, expenses, or taxes) | 22.23 | % | 11.20 | % | 11.15 | % |
| Morningstar Moderately Aggressive Target Risk Index (reflects no deduction for fees, expenses, or taxes) | 18.45 | % | 7.94 | % | 8.79 | % |
| 80% Morningstar Global Target Market Exposure Index (Net), 20% Bloomberg U.S. Aggregate Index (reflects no deduction for fees, expenses, or taxes) | 19.18 | % | 8.89 | % | 9.37 | % |
| Bloomberg U.S. Aggregate Index (reflects no deduction for fees, expenses, or taxes) | 7.30 | % | -0.36 | % | 1.72 | % |
The performance information shown provides some indication of the risks of investing in the Fund by showing changes in the Fund’s performance from year to year and by showing how the Fund’s average annual returns compared with those of a broad-based securities market index and additional indices that the Adviser believes more closely reflects the market segments in which the Fund invests. The Fund’s past performance is not necessarily an indication of how the Fund will perform in the future.
The returns shown in the bar chart and table do not include charges that will be imposed by variable insurance products. If these amounts were reflected, returns would be less than those shown.
Consistent with the Fund’s principal investment strategies, the Fund uses the 40% Morningstar Global Target Market Exposure Index (Net), 60% Bloomberg U.S. Aggregate Index as the Fund’s tertiary benchmark.
Annual Total Returns as of December 31
Class A
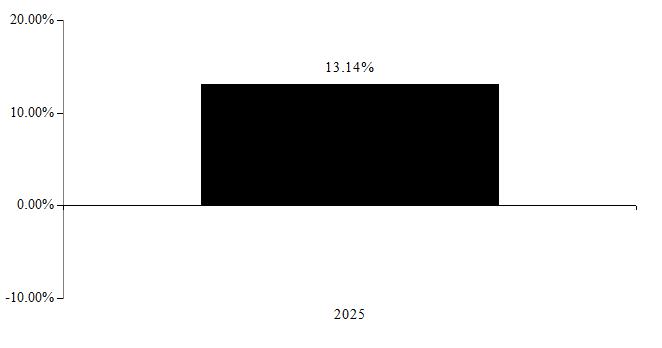
Best Quarter (ended 6/30/2025): 6.25%; Worst Quarter (ended 3/31/2025): 1.02%
Annual Total Returns as of December 31
Class I
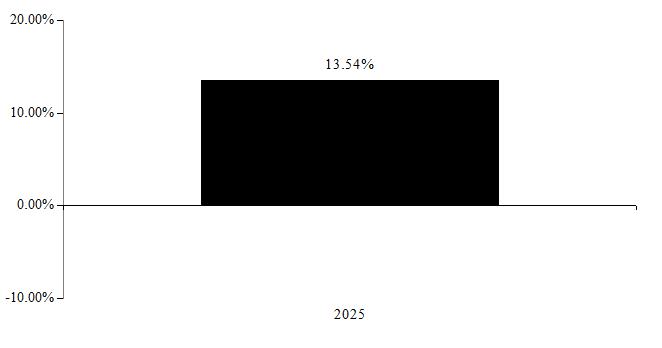
Best Quarter (ended 6/30/2025): 6.34%; Worst Quarter (ended 3/31/2025): 1.12%
| Average Annual Total Returns as of 12/31/2025 | ||||
| 1 year | Life of Fund (October 21, 2024) | |||
| JNL/American Funds Moderate Allocation Fund (Class A) | 13.14 | % | 9.19 | % |
| Bloomberg U.S. Aggregate Index (reflects no deduction for fees, expenses, or taxes) | 7.30 | % | 4.57 | % |
| Morningstar Moderately Conservative Target Risk Index (reflects no deduction for fees, expenses, or taxes) | 12.87 | % | 8.66 | % |
| 40% Morningstar Global Target Market Exposure Index (Net), 60% Bloomberg U.S. Aggregate Index (reflects no deduction for fees, expenses, or taxes) | 13.17 | % | 9.33 | % |
| Morningstar Global Target Market Exposure Index (Net) (reflects no deduction for fees, expenses, or taxes) | 22.23 | % | 16.59 | % |
| Average Annual Total Returns as of 12/31/2025 | ||||
| 1 year | Life of Class (October 21, 2024) | |||
| JNL/American Funds Moderate Allocation Fund (Class I) | 13.54 | % | 9.52 | % |
| Bloomberg U.S. Aggregate Index (reflects no deduction for fees, expenses, or taxes) | 7.30 | % | 4.57 | % |
| Morningstar Moderately Conservative Target Risk Index (reflects no deduction for fees, expenses, or taxes) | 12.87 | % | 8.66 | % |
| 40% Morningstar Global Target Market Exposure Index (Net), 60% Bloomberg U.S. Aggregate Index (reflects no deduction for fees, expenses, or taxes) | 13.17 | % | 9.33 | % |
| Morningstar Global Target Market Exposure Index (Net) (reflects no deduction for fees, expenses, or taxes) | 22.23 | % | 16.59 | % |
The performance information shown provides some indication of the risks of investing in the Fund by showing changes in the Fund’s performance from year to year and by showing how the Fund’s average annual returns compared with those of a broad-based securities market index and additional indices that the Adviser believes more closely reflects the market segments in which the Fund invests. The Fund’s past performance is not necessarily an indication of how the Fund will perform in the future.
The returns shown in the bar chart and table do not include charges that will be imposed by variable insurance products. If these amounts were reflected, returns would be less than those shown.
Consistent with the Fund’s principal investment strategies, the Fund uses the 60% Morningstar Global Target Market Exposure Index (Net), 40% Bloomberg U.S. Aggregate Index as the Fund’s tertiary benchmark.
Annual Total Returns as of December 31
Class A
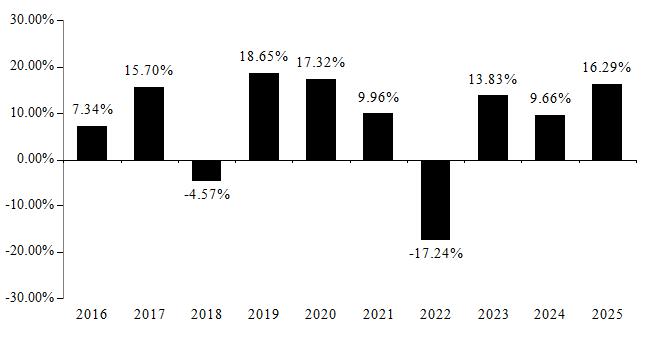
Best Quarter (ended 6/30/2020): 14.63%; Worst Quarter (ended 3/31/2020): -12.04%
Annual Total Returns as of December 31
Class I
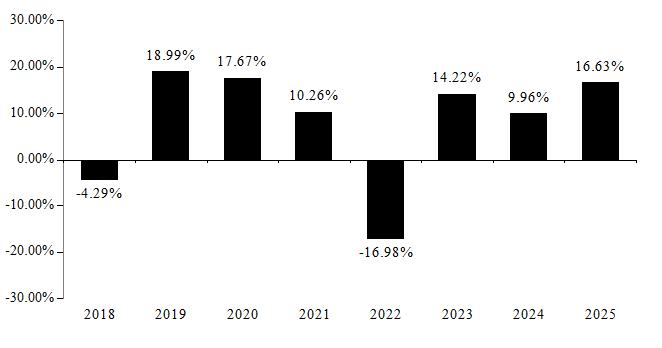
Best Quarter (ended 6/30/2020): 14.72%; Worst Quarter (ended 6/30/2022): -11.97%
| Average Annual Total Returns as of 12/31/2025 | ||||||
| 1 year | 5 year | 10 year | ||||
| JNL/American Funds Moderate Growth Allocation Fund (Class A) | 16.29 | % | 5.73 | % | 8.10 | % |
| Morningstar Global Target Market Exposure Index (Net) (reflects no deduction for fees, expenses, or taxes) | 22.23 | % | 11.20 | % | 11.70 | % |
| Morningstar Moderate Target Risk Index (reflects no deduction for fees, expenses, or taxes) | 15.95 | % | 5.95 | % | 7.83 | % |
| 60% Morningstar Global Target Market Exposure Index (Net), 40% Bloomberg U.S. Aggregate Index (reflects no deduction for fees, expenses, or taxes) | 16.16 | % | 6.57 | % | 7.95 | % |
| Bloomberg U.S. Aggregate Index (reflects no deduction for fees, expenses, or taxes) | 7.30 | % | -0.36 | % | 2.01 | % |
| Average Annual Total Returns as of 12/31/2025 | ||||||
| 1 year | 5 year | Life of Class (September 25, 2017) | ||||
| JNL/American Funds Moderate Growth Allocation Fund (Class I) | 16.63 | % | 6.04 | % | 7.79 | % |
| Morningstar Global Target Market Exposure Index (Net) (reflects no deduction for fees, expenses, or taxes) | 22.23 | % | 11.20 | % | 11.15 | % |
| Morningstar Moderate Target Risk Index (reflects no deduction for fees, expenses, or taxes) | 15.95 | % | 5.95 | % | 7.18 | % |
| 60% Morningstar Global Target Market Exposure Index (Net), 40% Bloomberg U.S. Aggregate Index (reflects no deduction for fees, expenses, or taxes) | 16.16 | % | 6.57 | % | 7.53 | % |
| Bloomberg U.S. Aggregate Index (reflects no deduction for fees, expenses, or taxes) | 7.30 | % | -0.36 | % | 1.72 | % |
The performance information shown provides some indication of the risks of investing in the Fund by showing changes in the Fund’s performance from year to year and by showing how the Fund’s average annual returns compared with those of a broad-based securities market index and additional indices that the Adviser believes more closely reflects the market segments in which the Fund invests. The Fund’s past performance is not necessarily an indication of how the Fund will perform in the future.
The returns shown in the bar chart and table do not include charges that will be imposed by variable insurance products. If these amounts were reflected, returns would be less than those shown.
Consistent with the Fund’s principal investment strategies, the Fund uses the 80% Morningstar Global Target Market Exposure Index (Net), 20% Bloomberg U.S. Aggregate Index as the Fund’s tertiary benchmark.
Annual Total Returns as of December 31
Class A
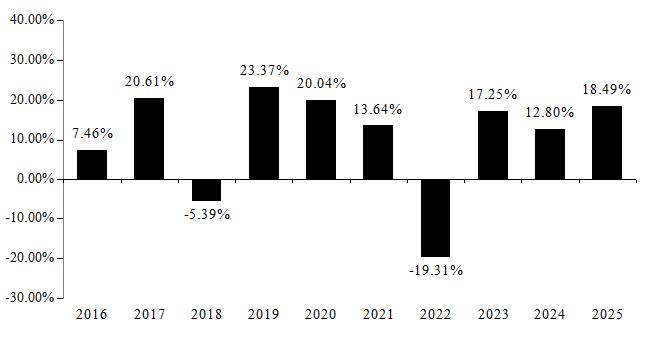
Best Quarter (ended 6/30/2020): 17.93%; Worst Quarter (ended 3/31/2020): -15.74%
Annual Total Returns as of December 31
Class I
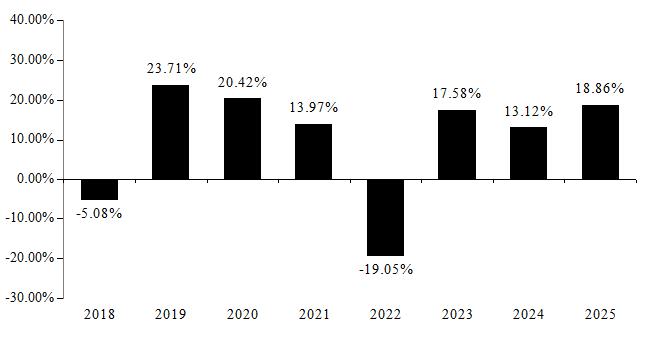
Best Quarter (ended 6/30/2020): 18.04%; Worst Quarter (ended 3/31/2020): -15.68%
| Average Annual Total Returns as of 12/31/2025 | ||||||
| 1 year | 5 year | 10 year | ||||
| JNL/American Funds Growth Allocation Fund (Class A) | 18.49 | % | 7.52 | % | 10.07 | % |
| Morningstar Global Target Market Exposure Index (Net) (reflects no deduction for fees, expenses, or taxes) | 22.23 | % | 11.20 | % | 11.70 | % |
| Morningstar Moderately Aggressive Target Risk Index (reflects no deduction for fees, expenses, or taxes) | 18.45 | % | 7.94 | % | 9.59 | % |
| 80% Morningstar Global Target Market Exposure Index (Net), 20% Bloomberg U.S. Aggregate Index (reflects no deduction for fees, expenses, or taxes) | 19.18 | % | 8.89 | % | 9.85 | % |
| Bloomberg U.S. Aggregate Index (reflects no deduction for fees, expenses, or taxes) | 7.30 | % | -0.36 | % | 2.01 | % |
| Average Annual Total Returns as of 12/31/2025 | ||||||
| 1 year | 5 year | Life of Class (September 25, 2017) | ||||
| JNL/American Funds Growth Allocation Fund (Class I) | 18.86 | % | 7.84 | % | 9.75 | % |
| Morningstar Global Target Market Exposure Index (Net) (reflects no deduction for fees, expenses, or taxes) | 22.23 | % | 11.20 | % | 11.15 | % |
| Morningstar Moderately Aggressive Target Risk Index (reflects no deduction for fees, expenses, or taxes) | 18.45 | % | 7.94 | % | 8.79 | % |
| 80% Morningstar Global Target Market Exposure Index (Net), 20% Bloomberg U.S. Aggregate Index (reflects no deduction for fees, expenses, or taxes) | 19.18 | % | 8.89 | % | 9.37 | % |
| Bloomberg U.S. Aggregate Index (reflects no deduction for fees, expenses, or taxes) | 7.30 | % | -0.36 | % | 1.72 | % |
The performance information shown provides some indication of the risks of investing in the Fund by showing changes in the Fund’s performance from year to year and by showing how the Fund’s average annual returns compared with those of a broad-based securities market index and an additional index that the Adviser believes more closely reflects the market segments in which the Fund invests. The Fund’s past performance is not necessarily an indication of how the Fund will perform in the future.
The returns shown in the bar chart and table do not include charges that will be imposed by variable insurance products. If these amounts were reflected, returns would be less than those shown.
Effective April 27, 2026, the Fund was combined with JNL/JPMorgan Global Allocation Fund (“Acquired Fund”), with the Fund as the surviving Fund. The performance shown is the Fund’s historic performance and does not reflect the performance of the Acquired Fund.
Annual Total Returns as of December 31
Class A
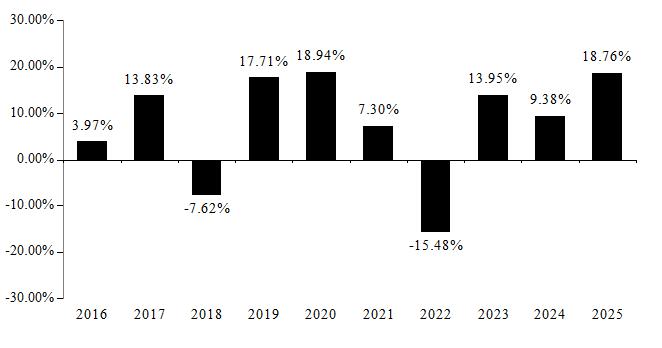
Best Quarter (ended 6/30/2020): 14.48%; Worst Quarter (ended 3/31/2020): -12.65%
Annual Total Returns as of December 31
Class I
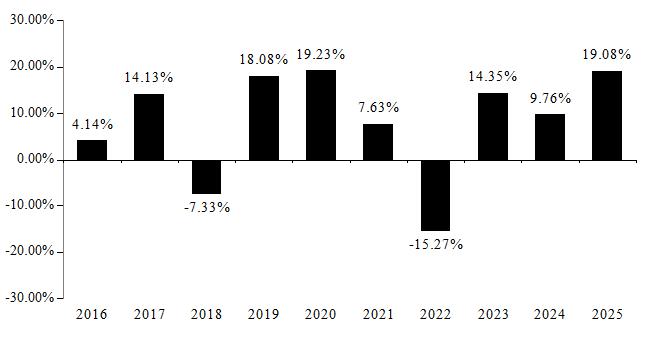
Best Quarter (ended 6/30/2020): 14.56%; Worst Quarter (ended 3/31/2020): -12.65%
| Average Annual Total Returns as of 12/31/2025 | ||||||
| 1 year | 5 year | 10 year | ||||
| JNL/BlackRock Global Allocation Fund (Class A) | 18.76 | % | 6.07 | % | 7.47 | % |
| Morningstar Developed Markets Target Market Exposure Index (Net) (reflects no deduction for fees, expenses, or taxes) | 21.13 | % | 12.12 | % | 12.11 | % |
| 36% S&P 500 Index, 24% FTSE World (ex U.S.) Index, 24% ICE BofA Current 5-Year U.S. Treasury Index, 16% FTSE Non-U.S. Dollar World Government Bond Index (reflects no deduction for fees, expenses, or taxes) | 17.78 | % | 6.68 | % | 8.09 | % |
| S&P 500 Index (reflects no deduction for fees, expenses, or taxes) | 17.88 | % | 14.42 | % | 14.82 | % |
| FTSE World ex-U.S. Index TR (reflects no deduction for fees, expenses, or taxes) | 35.82 | % | 10.14 | % | 9.60 | % |
| ICE BofA Current 5-Year U.S. Treasury Index (reflects no deduction for fees, expenses, or taxes) | 6.85 | % | -0.33 | % | 1.39 | % |
| FTSE Non-U.S. Dollar World Government Bond Index (reflects no deduction for fees, expenses, or taxes) | 8.47 | % | -5.21 | % | -0.16 | % |
| Average Annual Total Returns as of 12/31/2025 | ||||||
| 1 year | 5 year | 10 year | ||||
| JNL/BlackRock Global Allocation Fund (Class I) | 19.08 | % | 6.39 | % | 7.77 | % |
| Morningstar Developed Markets Target Market Exposure Index (Net) (reflects no deduction for fees, expenses, or taxes) | 21.13 | % | 12.12 | % | 12.11 | % |
| 36% S&P 500 Index, 24% FTSE World (ex U.S.) Index, 24% ICE BofA Current 5-Year U.S. Treasury Index, 16% FTSE Non-U.S. Dollar World Government Bond Index (reflects no deduction for fees, expenses, or taxes) | 17.78 | % | 6.68 | % | 8.09 | % |
| S&P 500 Index (reflects no deduction for fees, expenses, or taxes) | 17.88 | % | 14.42 | % | 14.82 | % |
| FTSE World ex-U.S. Index TR (reflects no deduction for fees, expenses, or taxes) | 35.82 | % | 10.14 | % | 9.60 | % |
| ICE BofA Current 5-Year U.S. Treasury Index (reflects no deduction for fees, expenses, or taxes) | 6.85 | % | -0.33 | % | 1.39 | % |
| FTSE Non-U.S. Dollar World Government Bond Index (reflects no deduction for fees, expenses, or taxes) | 8.47 | % | -5.21 | % | -0.16 | % |
The performance information shown provides some indication of the risks of investing in the Fund by showing changes in the Fund’s performance from year to year and by showing how the Fund’s average annual returns compared with those of a broad-based securities market index and an additional index that the Adviser believes more closely reflects the market segments in which the Fund invests. The Fund’s past performance is not necessarily an indication of how the Fund will perform in the future.
The returns shown in the bar chart and table do not include charges that will be imposed by variable insurance products. If these amounts were reflected, returns would be less than those shown.
Effective April 27, 2020, the Fund was combined with JNL/VanEck International Gold Fund, a series of Jackson Variable Series Trust, with the Fund as the surviving Fund. The performance shown is the Fund’s historic performance and does not reflect the performance of the Acquired Fund.
Annual Total Returns as of December 31
Class A
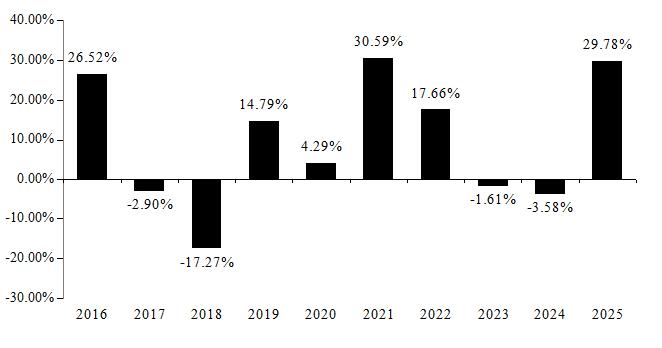
Best Quarter (ended 6/30/2020): 23.87%; Worst Quarter (ended 3/31/2020): -32.15%
Annual Total Returns as of December 31
Class I
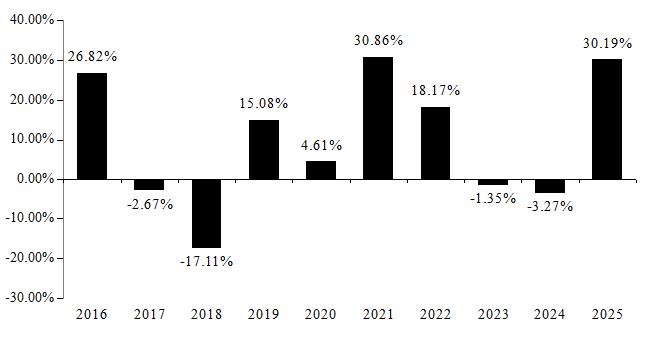
Best Quarter (ended 6/30/2020): 23.93%; Worst Quarter (ended 3/31/2020): -32.04%
| Average Annual Total Returns as of 12/31/2025 | ||||||
| 1 year | 5 year | 10 year | ||||
| JNL/BlackRock Global Natural Resources Fund (Class A) | 29.78 | % | 13.60 | % | 8.69 | % |
| Morningstar Global Target Market Exposure Index (Net) (reflects no deduction for fees, expenses, or taxes) | 22.23 | % | 11.20 | % | 11.70 | % |
| S&P Global Natural Resources Index (Net) (reflects no deduction for fees, expenses, or taxes) | 28.86 | % | 10.61 | % | 10.38 | % |
| Average Annual Total Returns as of 12/31/2025 | ||||||
| 1 year | 5 year | 10 year | ||||
| JNL/BlackRock Global Natural Resources Fund (Class I) | 30.19 | % | 13.95 | % | 9.00 | % |
| Morningstar Global Target Market Exposure Index (Net) (reflects no deduction for fees, expenses, or taxes) | 22.23 | % | 11.20 | % | 11.70 | % |
| S&P Global Natural Resources Index (Net) (reflects no deduction for fees, expenses, or taxes) | 28.86 | % | 10.61 | % | 10.38 | % |
The performance information shown provides some indication of the risks of investing in the Fund by showing changes in the Fund’s performance from year to year and by showing how the Fund’s average annual returns compared with those of a broad-based securities market index and an additional index that the Adviser believes more closely reflects the market segments in which the Fund invests. Performance results include the effect of expense waiver/reduction arrangements for some or all of the periods shown. If such arrangements had not been in place, performance for those periods would have been lower. The Fund’s past performance is not necessarily an indication of how the Fund will perform in the future.
The returns shown in the bar chart and table do not include charges that will be imposed by variable insurance products. If these amounts were reflected, returns would be less than those shown.
Annual Total Returns as of December 31
Class A
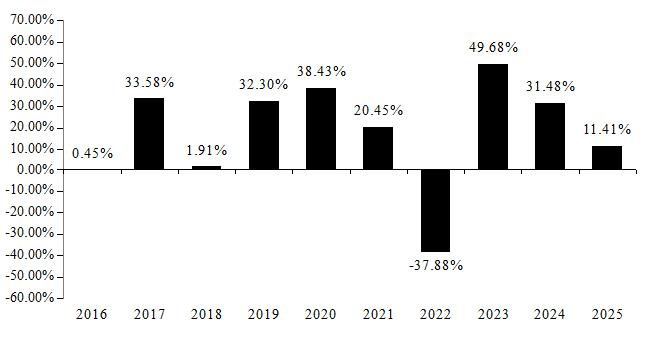
Best Quarter (ended 6/30/2020): 28.71%; Worst Quarter (ended 6/30/2022): -23.18%
Annual Total Returns as of December 31
Class I
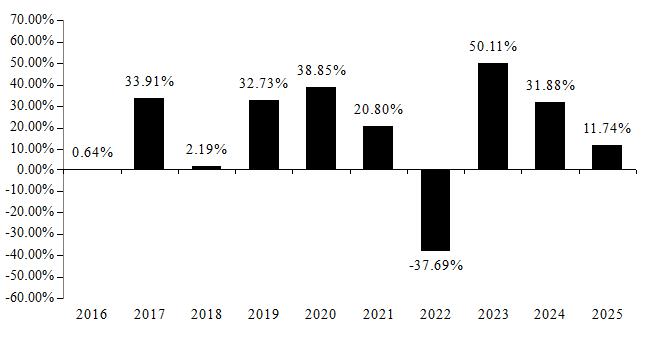
Best Quarter (ended 6/30/2020): 28.80%; Worst Quarter (ended 6/30/2022): -23.13%
| Average Annual Total Returns as of 12/31/2025 | ||||||
| 1 year | 5 year | 10 year | ||||
| JNL/BlackRock Large Cap Select Growth Fund (Class A) | 11.41 | % | 10.41 | % | 15.18 | % |
| Morningstar US Target Market Exposure Index (reflects no deduction for fees, expenses, or taxes) | 17.80 | % | 13.88 | % | 14.77 | % |
| Morningstar US Large-Mid Cap Broad Growth Index (reflects no deduction for fees, expenses, or taxes) | 16.67 | % | 13.44 | % | 16.49 | % |
| Average Annual Total Returns as of 12/31/2025 | ||||||
| 1 year | 5 year | 10 year | ||||
| JNL/BlackRock Large Cap Select Growth Fund (Class I) | 11.74 | % | 10.74 | % | 15.51 | % |
| Morningstar US Target Market Exposure Index (reflects no deduction for fees, expenses, or taxes) | 17.80 | % | 13.88 | % | 14.77 | % |
| Morningstar US Large-Mid Cap Broad Growth Index (reflects no deduction for fees, expenses, or taxes) | 16.67 | % | 13.44 | % | 16.49 | % |
The performance information shown provides some indication of the risks of investing in the Fund by showing changes in the Fund’s performance from year to year and by showing how the Fund’s average annual returns compared with those of a broad-based securities market index and an additional index that the Adviser believes more closely reflects the market segments in which the Fund invests. The Fund’s past performance is not necessarily an indication of how the Fund will perform in the future.
The returns shown in the bar chart and table do not include charges that will be imposed by variable insurance products. If these amounts were reflected, returns would be less than those shown.
Annual Total Returns as of December 31
Class A
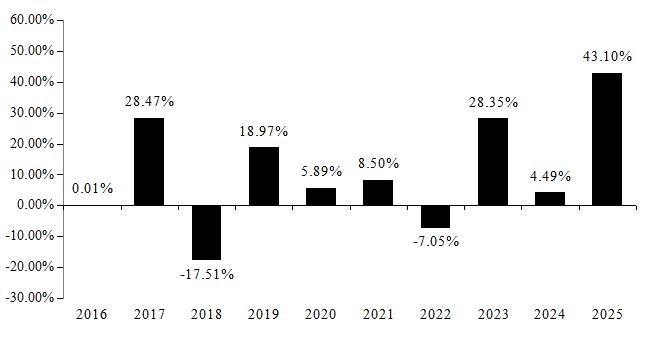
Best Quarter (ended 12/31/2020): 26.84%; Worst Quarter (ended 3/31/2020): -31.51%
Annual Total Returns as of December 31
Class I
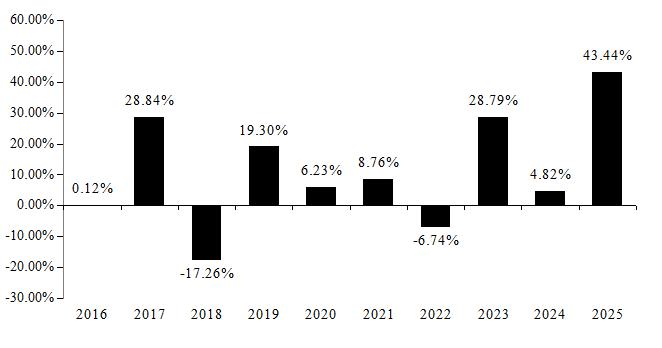
Best Quarter (ended 12/31/2020): 26.96%; Worst Quarter (ended 3/31/2020): -31.50%
| Average Annual Total Returns as of 12/31/2025 | ||||||
| 1 year | 5 year | 10 year | ||||
| JNL/Causeway International Value Select Fund (Class A) | 43.10 | % | 14.12 | % | 9.96 | % |
| Morningstar Developed Markets ex-North America Target Market Exposure Index (Net) (reflects no deduction for fees, expenses, or taxes) | 31.61 | % | 9.00 | % | 8.27 | % |
| Morningstar Developed Markets ex-North America Value Target Market Exposure Index (Net) (reflects no deduction for fees, expenses, or taxes) | 41.10 | % | 13.23 | % | 8.73 | % |
| Average Annual Total Returns as of 12/31/2025 | ||||||
| 1 year | 5 year | 10 year | ||||
| JNL/Causeway International Value Select Fund (Class I) | 43.44 | % | 14.46 | % | 10.26 | % |
| Morningstar Developed Markets ex-North America Target Market Exposure Index (Net) (reflects no deduction for fees, expenses, or taxes) | 31.61 | % | 9.00 | % | 8.27 | % |
| Morningstar Developed Markets ex-North America Value Target Market Exposure Index (Net) (reflects no deduction for fees, expenses, or taxes) | 41.10 | % | 13.23 | % | 8.73 | % |
The performance information shown provides some indication of the risks of investing in the Fund by showing changes in the Fund’s performance from year to year and by showing how the Fund’s average annual returns compared with those of a broad-based securities market index and an additional index that the Adviser believes more closely reflects the market segments in which the Fund invests. Performance prior to October 21, 2024 reflects the Fund’s results when managed by the former sub-adviser, Heitman Real Estate Securities LLC. The Fund’s past performance is not necessarily an indication of how the Fund will perform in the future.
The returns shown in the bar chart and table do not include charges that will be imposed by variable insurance products. If these amounts were reflected, returns would be less than those shown.
Effective April 27, 2026, the Fund was combined with JNL/WMC Global Real Estate Fund (“Acquired Fund”), with the Fund as the surviving Fund. The performance shown is the Fund’s historic performance and does not reflect the performance of the Acquired Fund.
Annual Total Returns as of December 31
Class A
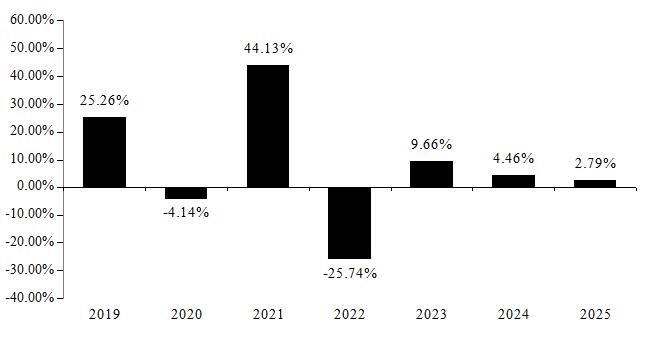
Best Quarter (ended 9/30/2024): 16.22%; Worst Quarter (ended 3/31/2020): -25.30%
Annual Total Returns as of December 31
Class I
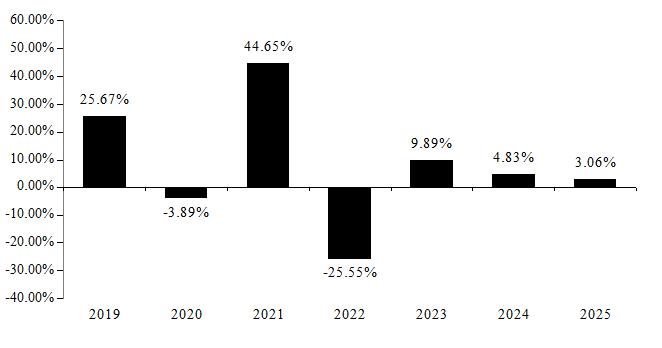
Best Quarter (ended 9/30/2024): 16.35%; Worst Quarter (ended 3/31/2020): -25.28%
| Average Annual Total Returns as of 12/31/2025 | ||||||
| 1 year | 5 year | Life of Fund (August 13, 2018) | ||||
| JNL/Cohen & Steers U.S. Realty Fund (Class A) | 2.79 | % | 4.73 | % | 4.87 | % |
| Morningstar US Target Market Exposure Index (reflects no deduction for fees, expenses, or taxes) | 17.80 | % | 13.88 | % | 14.44 | % |
| Morningstar US REIT Index (reflects no deduction for fees, expenses, or taxes) | 2.80 | % | 4.81 | % | 5.34 | % |
| Average Annual Total Returns as of 12/31/2025 | ||||||
| 1 year | 5 year | Life of Class (August 13, 2018) | ||||
| JNL/Cohen & Steers U.S. Realty Fund (Class I) | 3.06 | % | 5.04 | % | 5.17 | % |
| Morningstar US Target Market Exposure Index (reflects no deduction for fees, expenses, or taxes) | 17.80 | % | 13.88 | % | 14.44 | % |
| Morningstar US REIT Index (reflects no deduction for fees, expenses, or taxes) | 2.80 | % | 4.81 | % | 5.34 | % |
The performance information shown provides some indication of the risks of investing in the Fund by showing changes in the Fund’s performance from year to year and by showing how the Fund’s average annual returns compared with those of a broad-based securities market index. Performance results include the effect of expense waiver/reduction arrangements for some or all of the periods shown, and if such arrangements had not been in place, performance for those periods would have been lower. The Fund’s past performance is not necessarily an indication of how the Fund will perform in the future.
The returns shown in the bar chart and table do not include charges that will be imposed by variable insurance products. If these amounts were reflected, returns would be less than those shown.
Effective April 25, 2022, the Fund was combined with the JNL/BlackRock Advantage International Fund (“Acquired Fund”), with the Fund as the surviving Fund. The performance shown is the Fund’s historical performance and does not reflect the performance of the Acquired Fund.
Annual Total Returns as of December 31
Class A
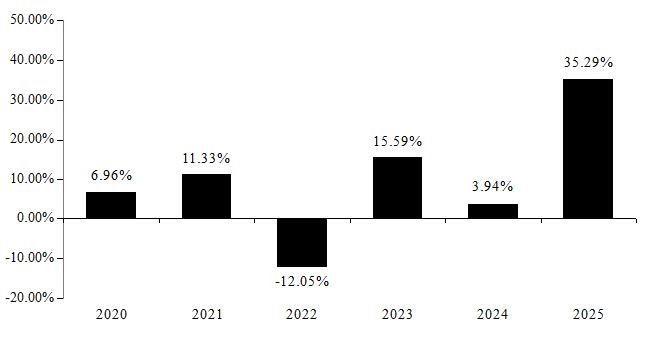
Best Quarter (ended 12/31/2022): 18.25%; Worst Quarter (ended 3/31/2020): -27.17%
Annual Total Returns as of December 31
Class I
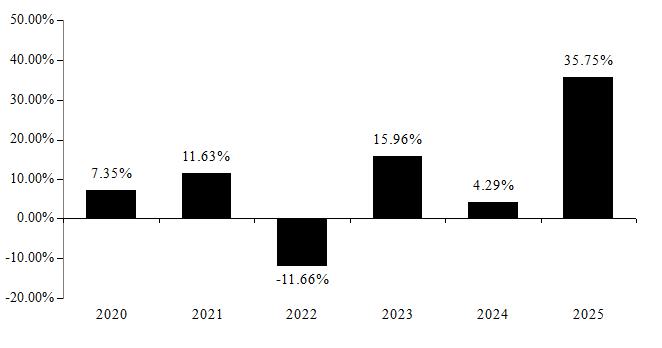
Best Quarter (ended 12/31/2022): 18.42%; Worst Quarter (ended 3/31/2020): -27.12%
| Average Annual Total Returns as of 12/31/2025 | ||||||
| 1 year | 5 year | Life of Fund (June 24, 2019) | ||||
| JNL/DFA International Core Equity Fund (Class A) | 35.29 | % | 9.74 | % | 9.82 | % |
| Morningstar Developed Markets ex-US Target Market Exposure Index (Net) (reflects no deduction for fees, expenses, or taxes) | 31.95 | % | 9.51 | % | 9.73 | % |
| Average Annual Total Returns as of 12/31/2025 | ||||||
| 1 year | 5 year | Life of Class (June 24, 2019) | ||||
| JNL/DFA International Core Equity Fund (Class I) | 35.75 | % | 10.11 | % | 10.20 | % |
| Morningstar Developed Markets ex-US Target Market Exposure Index (Net) (reflects no deduction for fees, expenses, or taxes) | 31.95 | % | 9.51 | % | 9.73 | % |
The performance information shown provides some indication of the risks of investing in the Fund by showing changes in the Fund’s performance from year to year and by showing how the Fund’s average annual returns compared with those of a broad-based securities market index. Performance results include the effect of expense waiver/reduction arrangements for some or all of the periods shown. If such arrangements had not been in place, performance for those periods would have been lower. The Fund’s past performance is not necessarily an indication of how the Fund will perform in the future.
The returns shown in the bar chart and table do not include charges that will be imposed by variable insurance products. If these amounts were reflected, returns would be less than those shown.
Effective April 27, 2026, the Fund was combined with JNL/AQR Large Cap Defensive Style Fund (“Acquired Fund”), with the Fund as the surviving Fund. The performance shown is the Fund’s historic performance and does not reflect the performance of the Acquired Fund.
Annual Total Returns as of December 31
Class A
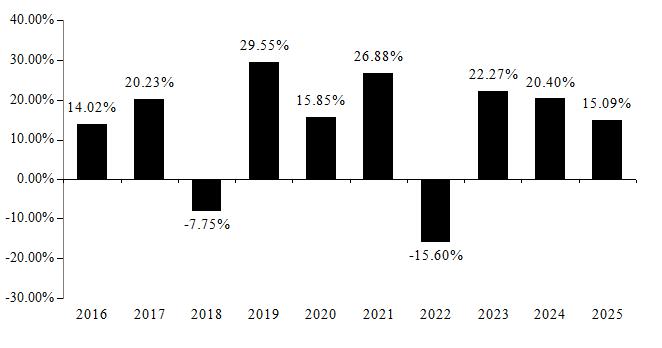
Best Quarter (ended 6/30/2020): 21.84%; Worst Quarter (ended 3/31/2020): -24.56%
Annual Total Returns as of December 31
Class I
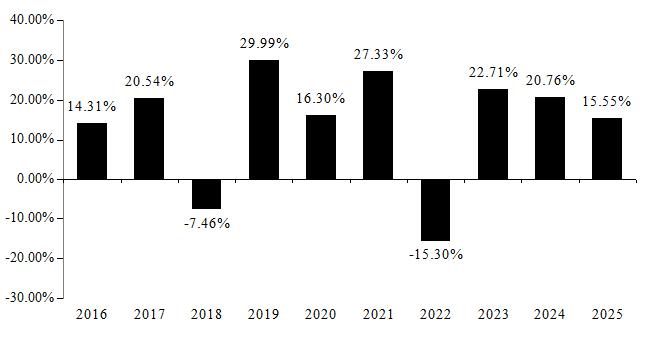
Best Quarter (ended 6/30/2020): 21.98%; Worst Quarter (ended 3/31/2020): -24.48%
| Average Annual Total Returns as of 12/31/2025 | ||||||
| 1 year | 5 year | 10 year | ||||
| JNL/DFA U.S. Core Equity Fund (Class A) | 15.09 | % | 12.66 | % | 13.16 | % |
| Morningstar US Market Extended Index (reflects no deduction for fees, expenses, or taxes) | 17.21 | % | 13.13 | % | 14.31 | % |
| Average Annual Total Returns as of 12/31/2025 | ||||||
| 1 year | 5 year | 10 year | ||||
| JNL/DFA U.S. Core Equity Fund (Class I) | 15.55 | % | 13.05 | % | 13.54 | % |
| Morningstar US Market Extended Index (reflects no deduction for fees, expenses, or taxes) | 17.21 | % | 13.13 | % | 14.31 | % |
The performance information shown provides some indication of the risks of investing in the Fund by showing changes in the Fund’s performance from year to year and by showing how the Fund’s average annual returns compared with those of a broad-based securities market index and an additional index that the Adviser believes more closely reflects the market segments in which the Fund invests. Performance information prior to September 25, 2017 reflects the Fund’s results using its prior principal investment strategy. Performance results include the effect of expense waiver/reduction arrangements for some or all periods shown. If such arrangements had not been in place, performance for those periods would have been lower. The Fund’s past performance is not necessarily an indication of how the Fund will perform in the future.
The returns shown in the bar chart and table do not include charges that will be imposed by variable insurance products. If these amounts were reflected, returns would be less than those shown.
The performance data includes the performance of the JNL/DFA U.S. Small Cap Fund, then a series of the Jackson Variable Series Trust, for periods before the Fund’s registration statement became effective.
Annual Total Returns as of December 31
Class A
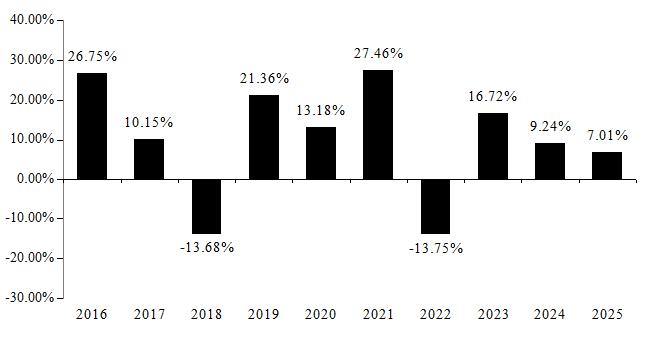
Best Quarter (ended 12/31/2020): 30.18%; Worst Quarter (ended 3/31/2020): -33.62%
Annual Total Returns as of December 31
Class I
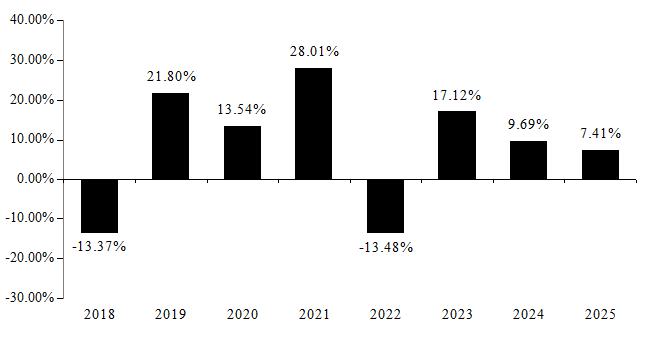
Best Quarter (ended 12/31/2020): 30.24%; Worst Quarter (ended 3/31/2020): -33.49%
| Average Annual Total Returns as of 12/31/2025 | ||||||
| 1 year | 5 year | 10 year | ||||
| JNL/DFA U.S. Small Cap Fund (Class A) | 7.01 | % | 8.45 | % | 9.52 | % |
| Morningstar US Market Extended Index (reflects no deduction for fees, expenses, or taxes) | 17.21 | % | 13.13 | % | 14.31 | % |
| Morningstar US Small Cap Extended Index (reflects no deduction for fees, expenses, or taxes) | 11.86 | % | 6.94 | % | 9.67 | % |
| Average Annual Total Returns as of 12/31/2025 | ||||||
| 1 year | 5 year | Life of Class (September 25, 2017) | ||||
| JNL/DFA U.S. Small Cap Fund (Class I) | 7.41 | % | 8.85 | % | 8.44 | % |
| Morningstar US Market Extended Index (reflects no deduction for fees, expenses, or taxes) | 17.21 | % | 13.13 | % | 14.16 | % |
| Morningstar US Small Cap Extended Index (reflects no deduction for fees, expenses, or taxes) | 11.86 | % | 6.94 | % | 8.36 | % |
The performance information shown provides some indication of the risks of investing in the Fund by showing changes in the Fund’s performance from year to year and by showing how the Fund’s average annual returns compared with those of a broad-based securities market index. Performance prior to September 25, 2017 reflects the Fund’s results when managed by the former sub-adviser, Pacific Investment Management Company LLC. Performance results include the effect of expense waiver/reduction arrangements for some or all of the periods shown. If such arrangements had not been in place, performance for those periods would have been lower. The Fund’s past performance is not necessarily an indication of how the Fund will perform in the future.
The returns shown in the bar chart and table do not include charges that will be imposed by variable insurance products. If these amounts were reflected, returns would be less than those shown.
Annual Total Returns as of December 31
Class A
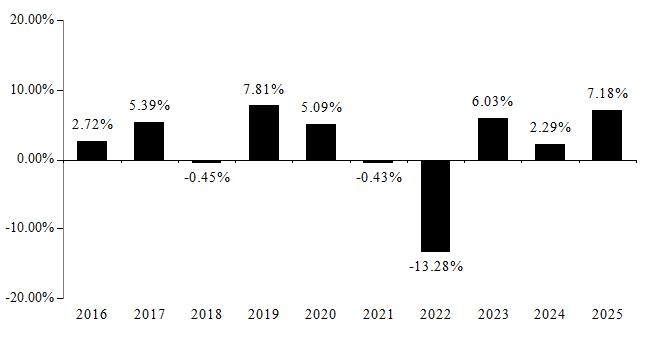
Best Quarter (ended 12/31/2023): 6.56%; Worst Quarter (ended 6/30/2022): -5.73%
Annual Total Returns as of December 31
Class I
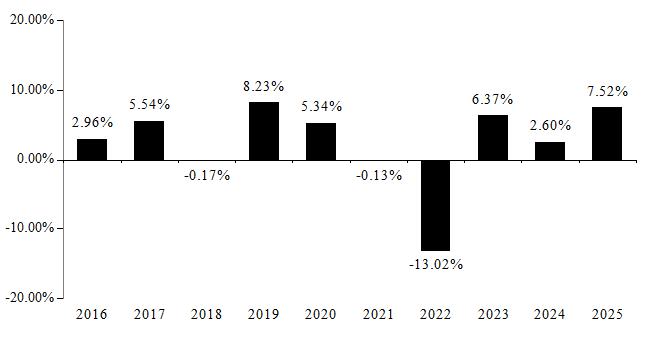
Best Quarter (ended 12/31/2023): 6.70%; Worst Quarter (ended 6/30/2022): -5.62%
| Average Annual Total Returns as of 12/31/2025 | ||||||
| 1 year | 5 year | 10 year | ||||
| JNL/DoubleLine® Core Fixed Income Fund (Class A) | 7.18 | % | 0.07 | % | 2.05 | % |
| Bloomberg U.S. Aggregate Index (reflects no deduction for fees, expenses, or taxes) | 7.30 | % | -0.36 | % | 2.01 | % |
| Average Annual Total Returns as of 12/31/2025 | ||||||
| 1 year | 5 year | 10 year | ||||
| JNL/DoubleLine® Core Fixed Income Fund (Class I) | 7.52 | % | 0.38 | % | 2.34 | % |
| Bloomberg U.S. Aggregate Index (reflects no deduction for fees, expenses, or taxes) | 7.30 | % | -0.36 | % | 2.01 | % |
The performance information shown provides some indication of the risks of investing in the Fund by showing changes in the Fund’s performance from year to year and by showing how the Fund’s average annual returns compared with those of a broad-based securities market index and an additional index that the Adviser believes more closely reflects the market segments in which the Fund invests. The Fund’s past performance is not necessarily an indication of how the Fund will perform in the future.
The returns shown in the bar chart and table do not include charges that will be imposed by variable insurance products. If these amounts were reflected, returns would be less than those shown.
Effective April 27, 2020, the Fund was combined with JNL/Goldman Sachs Emerging Markets Debt Fund (the “Acquired Fund”), with the Fund as the surviving Fund. The performance shown is the Fund’s historic performance and does not reflect the performance of the Acquired Fund.
Annual Total Returns as of December 31
Class A
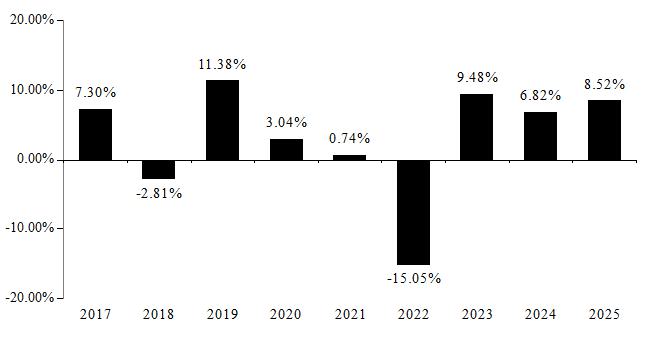
Best Quarter (ended 6/30/2020): 13.34%; Worst Quarter (ended 3/31/2020): -15.79%
Annual Total Returns as of December 31
Class I
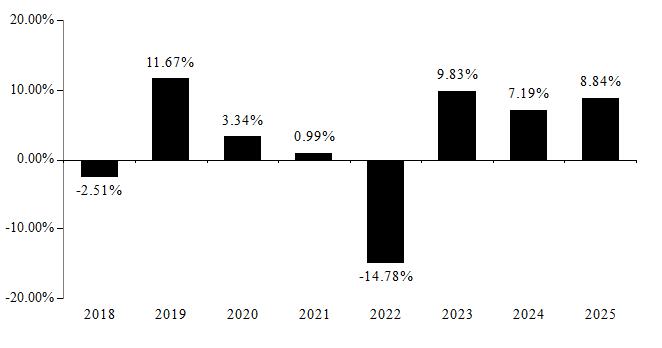
Best Quarter (ended 6/30/2020): 13.31%; Worst Quarter (ended 3/31/2020): -15.68%
| Average Annual Total Returns as of 12/31/2025 | ||||||
| 1 year | 5 year | Life of Fund (April 25, 2016) | ||||
| JNL/DoubleLine® Emerging Markets Fixed Income Fund (Class A) | 8.52 | % | 1.66 | % | 3.25 | % |
| Bloomberg Global Aggregate Index (reflects no deduction for fees, expenses, or taxes) | 8.17 | % | -2.15 | % | 0.72 | % |
| Bloomberg EM USD Aggregate Index (reflects no deduction for fees, expenses, or taxes) | 11.11 | % | 1.49 | % | 3.70 | % |
| Average Annual Total Returns as of 12/31/2025 | ||||||
| 1 year | 5 year | Life of Class (September 25, 2017) | ||||
| JNL/DoubleLine® Emerging Markets Fixed Income Fund (Class I) | 8.84 | % | 1.98 | % | 2.64 | % |
| Bloomberg Global Aggregate Index (reflects no deduction for fees, expenses, or taxes) | 8.17 | % | -2.15 | % | 0.46 | % |
| Bloomberg EM USD Aggregate Index (reflects no deduction for fees, expenses, or taxes) | 11.11 | % | 1.49 | % | 2.96 | % |
The performance information shown provides some indication of the risks of investing in the Fund by showing changes in the Fund’s performance from year to year and by showing how the Fund’s average annual returns compared with those of a broad-based securities market index. Performance results include the effect of expense waiver/reduction arrangements for some or all of the periods shown. If such arrangements had not been in place, performance for those periods would have been lower. The Fund’s past performance is not necessarily an indication of how the Fund will perform in the future.
The returns shown in the bar chart and table do not include charges that will be imposed by variable insurance products. If these amounts were reflected, returns would be less than those shown.
Annual Total Returns as of December 31
Class A
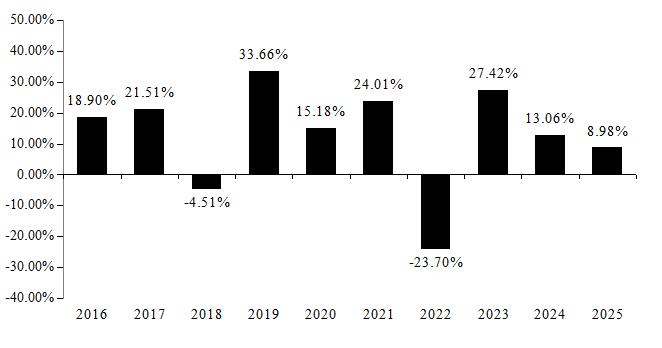
Best Quarter (ended 6/30/2020): 25.40%; Worst Quarter (ended 3/31/2020): -28.37%
Annual Total Returns as of December 31
Class I
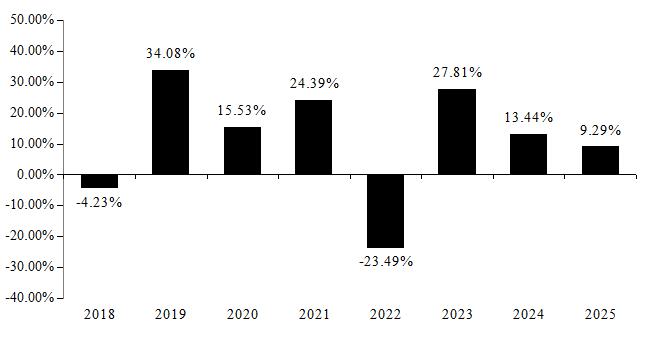
Best Quarter (ended 6/30/2020): 25.50%; Worst Quarter (ended 3/31/2020): -28.30%
| Average Annual Total Returns as of 12/31/2025 | ||||||
| 1 year | 5 year | 10 year | ||||
| JNL/DoubleLine® Shiller Enhanced CAPE® Fund (Class A) | 8.98 | % | 8.23 | % | 12.17 | % |
| S&P 500 Index (reflects no deduction for fees, expenses, or taxes) | 17.88 | % | 14.42 | % | 14.82 | % |
| Average Annual Total Returns as of 12/31/2025 | ||||||
| 1 year | 5 year | Life of Class (September 25, 2017) | ||||
| JNL/DoubleLine® Shiller Enhanced CAPE® Fund (Class I) | 9.29 | % | 8.56 | % | 11.04 | % |
| S&P 500 Index (reflects no deduction for fees, expenses, or taxes) | 17.88 | % | 14.42 | % | 14.82 | % |
The performance information shown provides some indication of the risks of investing in the Fund by showing changes in the Fund’s performance from year to year and by showing how the Fund’s average annual returns compared with those of a broad-based securities market index. Performance results include the effect of expense waiver/reduction arrangements for some or all of the periods shown. If such arrangements had not been in place, performance for those periods would have been lower. The Fund’s past performance is not necessarily an indication of how the Fund will perform in the future.
The returns shown in the bar chart and table do not include charges that will be imposed by variable insurance products. If these amounts were reflected, returns would be less than those shown.
The performance data includes the performance of the JNL/DoubleLine® Total Return Fund, then a series of the Jackson Variable Series Trust, for periods before the Fund’s registration statement became effective.
Annual Total Returns as of December 31
Class A
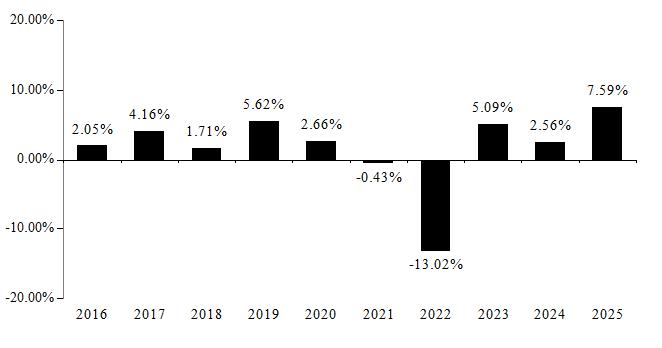
Best Quarter (ended 12/31/2023): 6.36%; Worst Quarter (ended 3/31/2022): -4.86%
Annual Total Returns as of December 31
Class I
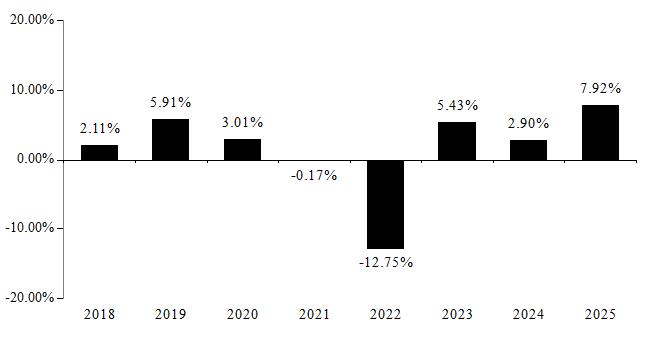
Best Quarter (ended 12/31/2023): 6.48%; Worst Quarter (ended 3/31/2022): -4.82%
| Average Annual Total Returns as of 12/31/2025 | ||||||
| 1 year | 5 year | 10 year | ||||
| JNL/DoubleLine® Total Return Fund (Class A) | 7.59 | % | 0.09 | % | 1.65 | % |
| Bloomberg U.S. Aggregate Index (reflects no deduction for fees, expenses, or taxes) | 7.30 | % | -0.36 | % | 2.01 | % |
| Average Annual Total Returns as of 12/31/2025 | ||||||
| 1 year | 5 year | Life of Class (September 25, 2017) | ||||
| JNL/DoubleLine® Total Return Fund (Class I) | 7.92 | % | 0.39 | % | 1.59 | % |
| Bloomberg U.S. Aggregate Index (reflects no deduction for fees, expenses, or taxes) | 7.30 | % | -0.36 | % | 1.72 | % |
The performance information shown provides some indication of the risks of investing in the Fund by showing changes in the Fund’s performance from year to year and by showing how the Fund’s average annual returns compared with those of a broad-based securities market index and an additional index that the Adviser believes more closely reflects the market segments in which the Fund invests. Performance results include the effect of expense waiver/reduction arrangements for some or all of the periods shown. If such arrangements had not been in place, performance for those periods would have been lower. The Fund’s past performance is not necessarily an indication of how the Fund will perform in the future.
The returns shown in the bar chart and table do not include charges that will be imposed by variable insurance products. If these amounts were reflected, returns would be less than those shown.
Prior to September 19, 2016, the Fund was operated as a prime money market fund. Effective September 19, 2016, the Fund operates as a government money market fund and, as such, invests at least 99.5% of its total assets in cash, government securities and/or repurchase agreements that are “collateralized fully” (i.e., backed by cash or government securities). Performance prior to October 21, 2024 reflects the Fund’s results when managed by the former sub-adviser, Wellington Management Company LLP.
The 7-day yield of Class A on December 31, 2025, was 3.27%.
The 7-day yield of Class I on December 31, 2025, was 3.57%.
Annual Total Returns as of December 31
Class A
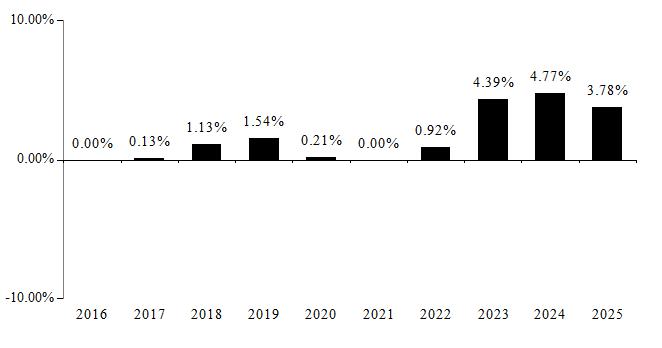
Best Quarter (ended 12/31/2023): 1.22%; Worst Quarter (ended 3/31/2022): 0.00%
Annual Total Returns as of December 31
Class I
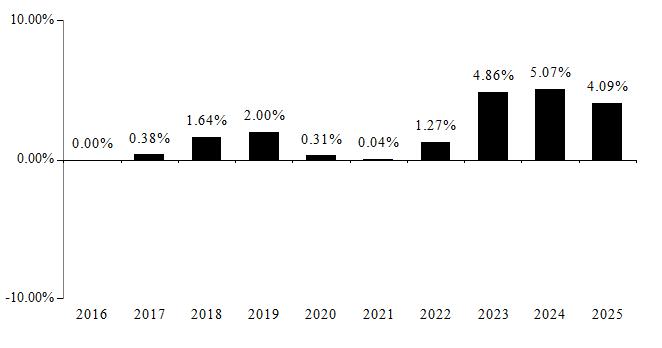
Best Quarter (ended 12/31/2023): 1.30%; Worst Quarter (ended 3/31/2022): 0.00%
| Average Annual Total Returns as of 12/31/2025 | ||||||
| 1 year | 5 year | 10 year | ||||
| JNL/Dreyfus Government Money Market Fund (Class A) | 3.78 | % | 2.75 | % | 1.67 | % |
| Bloomberg U.S. Aggregate Index (reflects no deduction for fees, expenses, or taxes) | 7.30 | % | -0.36 | % | 2.01 | % |
| Bloomberg USD 1 Month Swap Rate Cash Deposit Index SPLICE (reflects no deduction for fees, expenses, or taxes)* | 4.38 | % | 3.32 | % | 2.20 | % |
| * | Index performance through December 30, 2020 reflects the performance of the FTSE U.S. Treasury Bill Index (1-month). Index performance beginning December 31, 2020 reflects the performance of the Bloomberg USD 1 Month Swap Rate Cash Deposit Index. |
| Average Annual Total Returns as of 12/31/2025 | ||||||
| 1 year | 5 year | 10 year | ||||
| JNL/Dreyfus Government Money Market Fund (Class I) | 4.09 | % | 3.05 | % | 1.95 | % |
| Bloomberg U.S. Aggregate Index (reflects no deduction for fees, expenses, or taxes) | 7.30 | % | -0.36 | % | 2.01 | % |
| Bloomberg USD 1 Month Swap Rate Cash Deposit Index SPLICE (reflects no deduction for fees, expenses, or taxes)* | 4.38 | % | 3.32 | % | 2.20 | % |
| * | Index performance through December 30, 2020 reflects the performance of the FTSE U.S. Treasury Bill Index (1-month). Index performance beginning December 31, 2020 reflects the performance of the Bloomberg USD 1 Month Swap Rate Cash Deposit Index. |
The performance information shown provides some indication of the risks of investing in the Fund by showing changes in the Fund’s performance from year to year and by showing how the Fund’s average annual returns compared with those of a broad-based securities market index and an additional index that the Adviser believes more closely reflects the market segments in which the Fund invests. Performance results include the effect of expense waiver/reduction arrangements for some or all of the periods shown. If such arrangements had not been in place, performance for those periods would have been lower. Performance prior to April 27, 2026 reflects the Fund’s results when managed by the former sub-adviser, ClearBridge Investments, LLC. The Fund’s past performance is not necessarily an indication of how the Fund will perform in the future.
The returns shown in the bar chart and table do not include charges that will be imposed by variable insurance products. If these amounts were reflected, returns would be less than those shown.
Annual Total Returns as of December 31
Class A
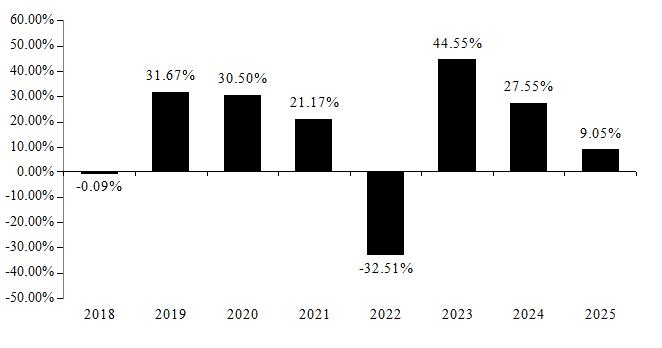
Best Quarter (ended 6/30/2020): 25.93%; Worst Quarter (ended 6/30/2022): -22.71%
Annual Total Returns as of December 31
Class I
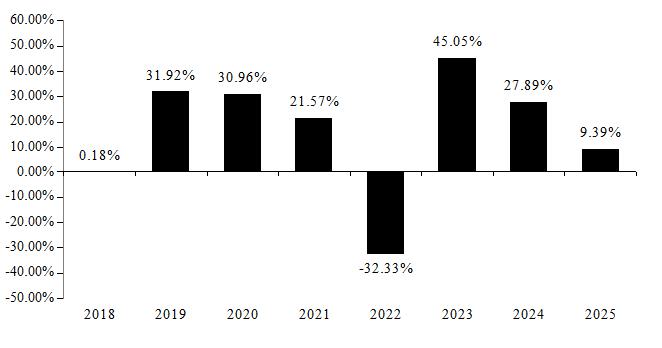
Best Quarter (ended 6/30/2020): 25.90%; Worst Quarter (ended 6/30/2022): -22.66%
| Average Annual Total Returns as of 12/31/2025 | ||||||
| 1 year | 5 year | Life of Fund (September 25, 2017) | ||||
| JNL/Fidelity Institutional AM® & JPMorgan Large Cap Growth Fund (Class A) | 9.05 | % | 10.46 | % | 14.48 | % |
| Morningstar US Target Market Exposure Index (reflects no deduction for fees, expenses, or taxes) | 17.80 | % | 13.88 | % | 14.76 | % |
| Morningstar US Large-Mid Cap Broad Growth Index (reflects no deduction for fees, expenses, or taxes) | 16.67 | % | 13.44 | % | 17.09 | % |
| Average Annual Total Returns as of 12/31/2025 | ||||||
| 1 year | 5 year | Life of Class (September 25, 2017) | ||||
| JNL/Fidelity Institutional AM® & JPMorgan Large Cap Growth Fund (Class I) | 9.39 | % | 10.79 | % | 14.82 | % |
| Morningstar US Target Market Exposure Index (reflects no deduction for fees, expenses, or taxes) | 17.80 | % | 13.88 | % | 14.76 | % |
| Morningstar US Large-Mid Cap Broad Growth Index (reflects no deduction for fees, expenses, or taxes) | 16.67 | % | 13.44 | % | 17.09 | % |
The performance information shown provides some indication of the risks of investing in the Fund by showing changes in the Fund’s performance from year to year and by showing how the Fund’s average annual returns compared with those of a broad-based securities market index. Performance results include the effect of expense waiver/reduction arrangements for some or all of the periods shown. If such arrangements had not been in place, performance for those periods would have been lower. Performance prior to June 24, 2019 reflects the Fund’s results when managed by the former sub-adviser, Goldman Sachs Asset Management, L.P. The Fund’s past performance is not necessarily an indication of how the Fund will perform in the future.
The returns shown in the bar chart and table do not include charges that will be imposed by variable insurance products. If these amounts were reflected, returns would be less than those shown.
Annual Total Returns as of December 31
Class A
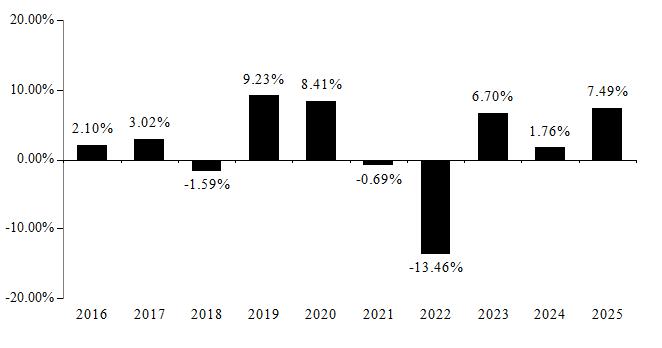
Best Quarter (ended 12/31/2023): 7.18%; Worst Quarter (ended 6/30/2022): -6.39%
Annual Total Returns as of December 31
Class I
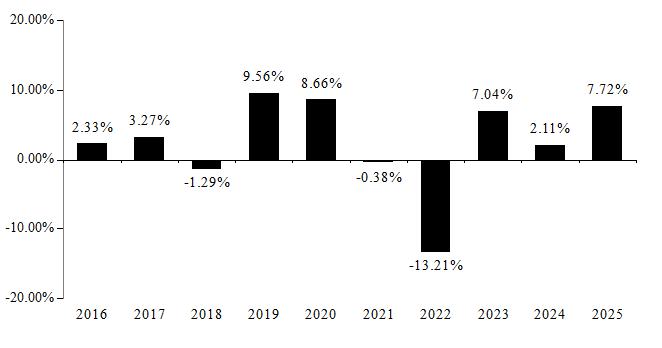
Best Quarter (ended 12/31/2023): 7.23%; Worst Quarter (ended 6/30/2022): -6.31%
| Average Annual Total Returns as of 12/31/2025 | ||||||
| 1 year | 5 year | 10 year | ||||
| JNL/Fidelity Institutional AM® Total Bond Fund (Class A) | 7.49 | % | 0.06 | % | 2.09 | % |
| Bloomberg U.S. Aggregate Index (reflects no deduction for fees, expenses, or taxes) | 7.30 | % | -0.36 | % | 2.01 | % |
| Average Annual Total Returns as of 12/31/2025 | ||||||
| 1 year | 5 year | 10 year | ||||
| JNL/Fidelity Institutional AM® Total Bond Fund (Class I) | 7.72 | % | 0.36 | % | 2.37 | % |
| Bloomberg U.S. Aggregate Index (reflects no deduction for fees, expenses, or taxes) | 7.30 | % | -0.36 | % | 2.01 | % |
The performance information shown provides some indication of the risks of investing in the Fund by showing changes in the Fund’s performance from year to year and by showing how the Fund’s average annual returns compared with those of a broad-based securities market index and an additional index that the Adviser believes more closely reflects the market segments in which the Fund invests. Performance prior to August 13, 2018 reflects the Fund’s results when managed by the former sub-adviser, Brookfield Investment Management, Inc. Performance results include the effect of expense waiver/reduction arrangements for some or all of the periods shown. If such arrangements had not been in place, performance for those periods would have been lower. The Fund’s past performance is not necessarily an indication of how the Fund will perform in the future.
The returns shown in the bar chart and table do not include charges that will be imposed by variable insurance products. If these amounts were reflected, returns would be less than those shown.
Annual Total Returns as of December 31
Class A
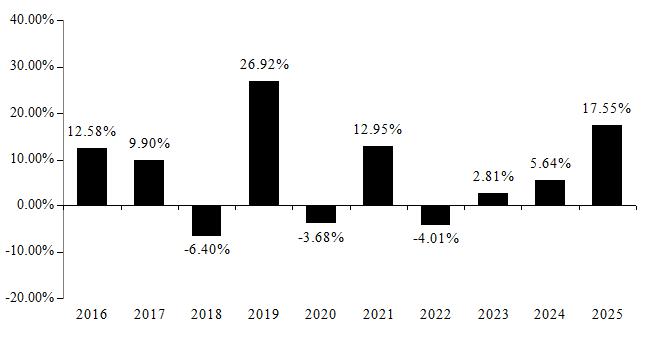
Best Quarter (ended 3/31/2019): 14.17%; Worst Quarter (ended 3/31/2020): -21.27%
Annual Total Returns as of December 31
Class I
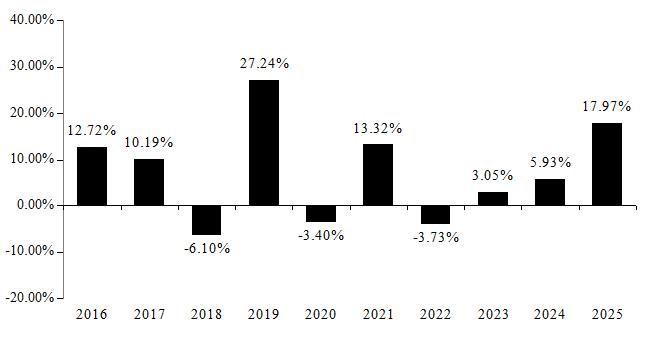
Best Quarter (ended 3/31/2019): 14.17%; Worst Quarter (ended 3/31/2020): -21.23%
| Average Annual Total Returns as of 12/31/2025 | ||||||
| 1 year | 5 year | 10 year | ||||
| JNL/First Sentier Global Infrastructure Fund (Class A) | 17.55 | % | 6.72 | % | 6.96 | % |
| Morningstar Global Target Market Exposure Index (Net) (reflects no deduction for fees, expenses, or taxes) | 22.23 | % | 11.20 | % | 11.70 | % |
| S&P Global Infrastructure Index (Net) (reflects no deduction for fees, expenses, or taxes) | 21.54 | % | 10.02 | % | 8.47 | % |
| Average Annual Total Returns as of 12/31/2025 | ||||||
| 1 year | 5 year | 10 year | ||||
| JNL/First Sentier Global Infrastructure Fund (Class I) | 17.97 | % | 7.04 | % | 7.25 | % |
| Morningstar Global Target Market Exposure Index (Net) (reflects no deduction for fees, expenses, or taxes) | 22.23 | % | 11.20 | % | 11.70 | % |
| S&P Global Infrastructure Index (Net) (reflects no deduction for fees, expenses, or taxes) | 21.54 | % | 10.02 | % | 8.47 | % |
The performance information shown provides some indication of the risks of investing in the Fund by showing changes in the Fund’s performance from year to year and by showing how the Fund’s average annual returns compared with those of a broad-based securities market index and an additional index that the Adviser believes more closely reflects the market segments in which the Fund invests. Performance results include the effect of expense waiver/reduction arrangements for some or all of the periods shown. If such arrangements had not been in place, performance for those periods would have been lower. The Fund’s past performance is not necessarily an indication of how the Fund will perform in the future.
The returns shown in the bar chart and table do not include charges that will be imposed by variable insurance products. If these amounts were reflected, returns would be less than those shown.
Effective December 31, 2025, for consistency with the Fund’s principal investment strategies, the Fund replaced the 50% S&P 500 Value Index, 50% ICE BofA U.S. High Yield Index with the 50% Morningstar Dividend Composite Index, 25% Bloomberg US Aggregate Index, 25% ICE BofA US High Yield Index as the Fund’s secondary benchmark.
Annual Total Returns as of December 31
Class A
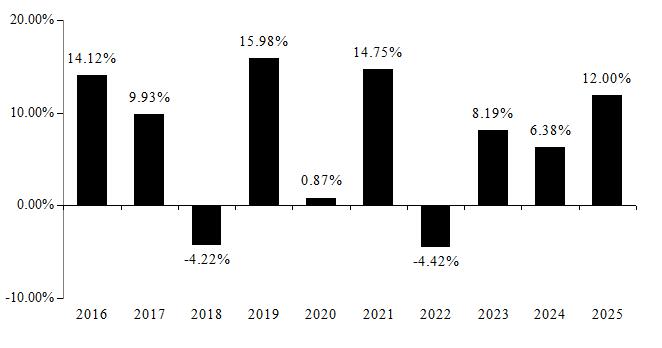
Best Quarter (ended 12/31/2020): 9.77%; Worst Quarter (ended 3/31/2020): -15.98%
Annual Total Returns as of December 31
Class I
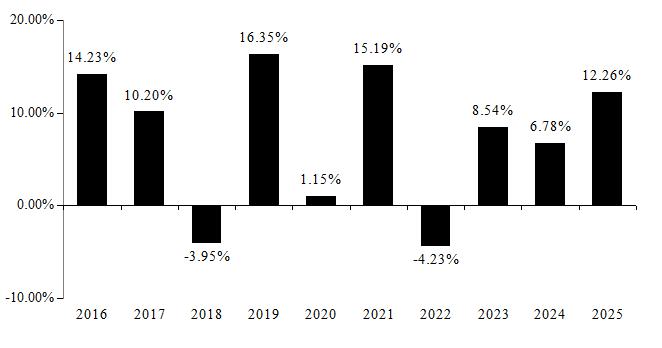
Best Quarter (ended 12/31/2020): 9.81%; Worst Quarter (ended 3/31/2020): -15.94%
| Average Annual Total Returns as of 12/31/2025 | ||||||
| 1 year | 5 year | 10 year | ||||
| JNL/Franklin Templeton Income Fund (Class A) | 12.00 | % | 7.17 | % | 7.11 | % |
| S&P 500 Index (reflects no deduction for fees, expenses, or taxes) | 17.88 | % | 14.42 | % | 14.82 | % |
| 50% Morningstar Dividend Composite Index, 25% Bloomberg US Aggregate Bond Index, 25% ICE BofA US High Yield Index (reflects no deduction for fees, expenses, or taxes) | 11.70 | % | 7.27 | % | 8.58 | % |
| Morningstar Dividend Composite Index (reflects no deduction for fees, expenses, or taxes) | 15.49 | % | 12.45 | % | 12.71 | % |
| Bloomberg U.S. Aggregate Index (reflects no deduction for fees, expenses, or taxes) | 7.30 | % | -0.36 | % | 2.01 | % |
| ICE BofA U.S. High Yield Index (reflects no deduction for fees, expenses, or taxes) | 8.50 | % | 4.50 | % | 6.45 | % |
| 50% S&P 500 Value Index 50% ICE BofA U.S. High Yield Index (reflects no deduction for fees, expenses, or taxes) | 10.87 | % | 8.79 | % | 9.21 | % |
| S&P 500 Value Index (reflects no deduction for fees, expenses, or taxes) | 13.19 | % | 12.96 | % | 11.73 | % |
| Average Annual Total Returns as of 12/31/2025 | ||||||
| 1 year | 5 year | 10 year | ||||
| JNL/Franklin Templeton Income Fund (Class I) | 12.26 | % | 7.50 | % | 7.40 | % |
| S&P 500 Index (reflects no deduction for fees, expenses, or taxes) | 17.88 | % | 14.42 | % | 14.82 | % |
| 50% Morningstar Dividend Composite Index, 25% Bloomberg US Aggregate Bond Index, 25% ICE BofA US High Yield Index (reflects no deduction for fees, expenses, or taxes) | 11.70 | % | 7.27 | % | 8.58 | % |
| Morningstar Dividend Composite Index (reflects no deduction for fees, expenses, or taxes) | 15.49 | % | 12.45 | % | 12.71 | % |
| Bloomberg U.S. Aggregate Index (reflects no deduction for fees, expenses, or taxes) | 7.30 | % | -0.36 | % | 2.01 | % |
| ICE BofA U.S. High Yield Index (reflects no deduction for fees, expenses, or taxes) | 8.50 | % | 4.50 | % | 6.45 | % |
| 50% S&P 500 Value Index 50% ICE BofA U.S. High Yield Index (reflects no deduction for fees, expenses, or taxes) | 10.87 | % | 8.79 | % | 9.21 | % |
| S&P 500 Value Index (reflects no deduction for fees, expenses, or taxes) | 13.19 | % | 12.96 | % | 11.73 | % |
The performance information shown provides some indication of the risks of investing in the Fund by showing changes in the Fund’s performance from year to year and by showing how the Fund’s average annual returns compared with those of a broad-based securities market index and an additional index that the Adviser believes more closely reflects the market segments in which the Fund invests. Performance prior to April 26, 2021 reflects the Fund’s results when the Fund did not have a sub-adviser and operated as a fund-of-funds. The Fund’s past performance is not necessarily an indication of how the Fund will perform in the future.
The returns shown in the bar chart and table do not include charges that will be imposed by variable insurance products. If these amounts were reflected, returns would be less than those shown.
Annual Total Returns as of December 31
Class A
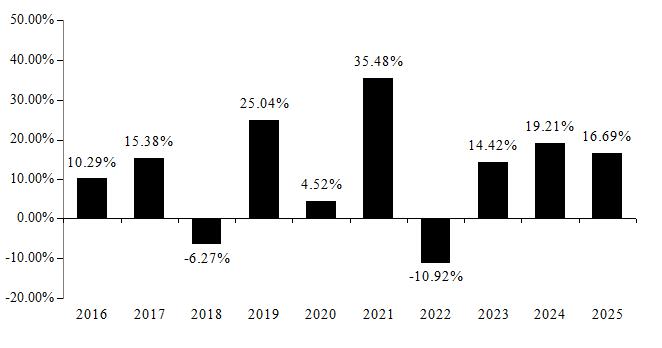
Best Quarter (ended 12/31/2020): 17.26%; Worst Quarter (ended 3/31/2020): -27.76%
Annual Total Returns as of December 31
Class I
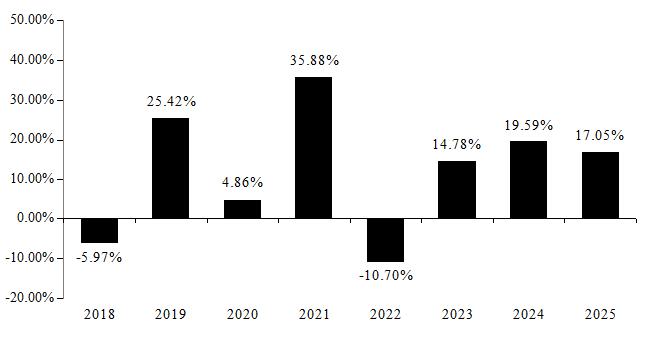
Best Quarter (ended 12/31/2020): 17.39%; Worst Quarter (ended 3/31/2020): -27.70%
| Average Annual Total Returns as of 12/31/2025 | ||||||
| 1 year | 5 year | 10 year | ||||
| JNL/Goldman Sachs 4 Fund (Class A) | 16.69 | % | 13.95 | % | 11.59 | % |
| S&P 500 Index (reflects no deduction for fees, expenses, or taxes) | 17.88 | % | 14.42 | % | 14.82 | % |
| S&P 500 Value Index (reflects no deduction for fees, expenses, or taxes) | 13.19 | % | 12.96 | % | 11.73 | % |
| Average Annual Total Returns as of 12/31/2025 | ||||||
| 1 year | 5 year | Life of Class (September 25, 2017) | ||||
| JNL/Goldman Sachs 4 Fund (Class I) | 17.05 | % | 14.29 | % | 12.47 | % |
| S&P 500 Index (reflects no deduction for fees, expenses, or taxes) | 17.88 | % | 14.42 | % | 14.82 | % |
| S&P 500 Value Index (reflects no deduction for fees, expenses, or taxes) | 13.19 | % | 12.96 | % | 11.17 | % |
The performance information shown provides some indication of the risks of investing in the Fund by showing changes in the Fund’s performance from year to year and by showing how the Fund’s average annual returns compared with those of a broad-based securities market index. Performance results include the effect of expense waiver/reduction arrangements for some or all of the periods shown. If such arrangements had not been in place, performance for those periods would have been lower. The Fund’s past performance is not necessarily an indication of how the Fund will perform in the future.
The returns shown in the bar chart and table do not include charges that will be imposed by variable insurance products. If these amounts were reflected, returns would be less than those shown.
Annual Total Returns as of December 31
Class A
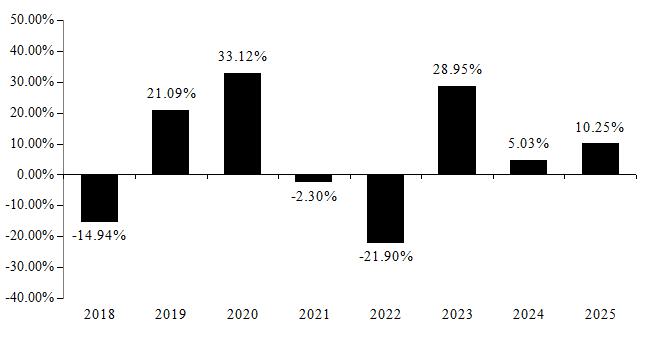
Best Quarter (ended 6/30/2020): 23.01%; Worst Quarter (ended 3/31/2020): -19.76%
Annual Total Returns as of December 31
Class I
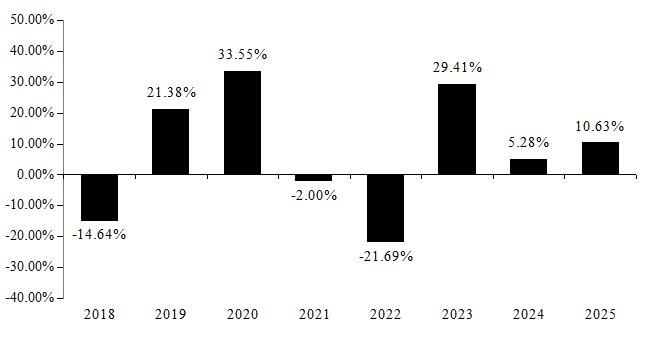
Best Quarter (ended 6/30/2020): 23.19%; Worst Quarter (ended 3/31/2020): -19.72%
| Average Annual Total Returns as of 12/31/2025 | ||||||
| 1 year | 5 year | Life of Fund (September 25, 2017) | ||||
| JNL/GQG Emerging Markets Equity Fund (Class A) | 10.25 | % | 2.64 | % | 6.18 | % |
| Morningstar Emerging Markets Target Market Exposure Index (Net) (reflects no deduction for fees, expenses, or taxes) | 31.62 | % | 4.54 | % | 5.97 | % |
| Average Annual Total Returns as of 12/31/2025 | ||||||
| 1 year | 5 year | Life of Class (September 25, 2017) | ||||
| JNL/GQG Emerging Markets Equity Fund (Class I) | 10.63 | % | 2.95 | % | 6.50 | % |
| Morningstar Emerging Markets Target Market Exposure Index (Net) (reflects no deduction for fees, expenses, or taxes) | 31.62 | % | 4.54 | % | 5.97 | % |
The performance information shown provides some indication of the risks of investing in the Fund by showing changes in the Fund’s performance from year to year and by showing how the Fund’s average annual returns compared with those of a broad-based securities market index and an additional index that the Adviser believes more closely reflects the market segments in which the Fund invests. Performance results include the effect of expense waiver/reduction arrangements for some or all of the periods shown. If such arrangements had not been in place, performance for those periods would have been lower. The Fund’s past performance is not necessarily an indication of how the Fund will perform in the future.
The returns shown in the bar chart and table do not include charges that will be imposed by variable insurance products. If these amounts were reflected, returns would be less than those shown.
Annual Total Returns as of December 31
Class A
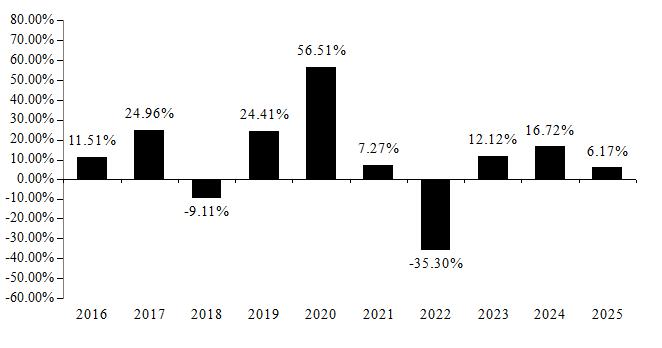
Best Quarter (ended 6/30/2020): 34.29%; Worst Quarter (ended 6/30/2022): -22.19%
Annual Total Returns as of December 31
Class I
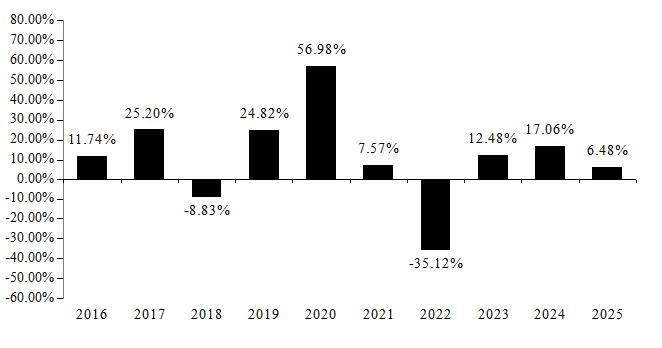
Best Quarter (ended 6/30/2020): 34.40%; Worst Quarter (ended 6/30/2022): -22.14%
| Average Annual Total Returns as of 12/31/2025 | ||||||
| 1 year | 5 year | 10 year | ||||
| JNL/Invesco Small Cap Growth Fund (Class A) | 6.17 | % | -0.73 | % | 9.05 | % |
| Morningstar US Market Extended Index (reflects no deduction for fees, expenses, or taxes) | 17.21 | % | 13.13 | % | 14.31 | % |
| Morningstar US Small Cap Broad Growth Extended Index (reflects no deduction for fees, expenses, or taxes) | 13.12 | % | 4.22 | % | 9.92 | % |
| Average Annual Total Returns as of 12/31/2025 | ||||||
| 1 year | 5 year | 10 year | ||||
| JNL/Invesco Small Cap Growth Fund (Class I) | 6.48 | % | -0.43 | % | 9.36 | % |
| Morningstar US Market Extended Index (reflects no deduction for fees, expenses, or taxes) | 17.21 | % | 13.13 | % | 14.31 | % |
| Morningstar US Small Cap Broad Growth Extended Index (reflects no deduction for fees, expenses, or taxes) | 13.12 | % | 4.22 | % | 9.92 | % |
The performance information shown provides some indication of the risks of investing in the Fund by showing changes in the Fund’s performance from year to year and by showing how the Fund’s average annual returns compared with those of a broad-based securities market index and an additional index that the Adviser believes more closely reflects the market segments in which the Fund invests. The Fund’s past performance is not necessarily an indication of how the Fund will perform in the future.
The returns shown in the bar chart and table do not include charges that will be imposed by variable insurance products. If these amounts were reflected, returns would be less than those shown.
Effective April 27, 2020, the Fund was combined with the JNL/FAMCO Flex Core Covered Call Fund (the “Acquired Fund”), a series of Jackson Variable Series Trust, with the Fund as the surviving Fund. The performance shown is the Fund’s historic performance and does not reflect the performance of the Acquired Fund.
Annual Total Returns as of December 31
Class A
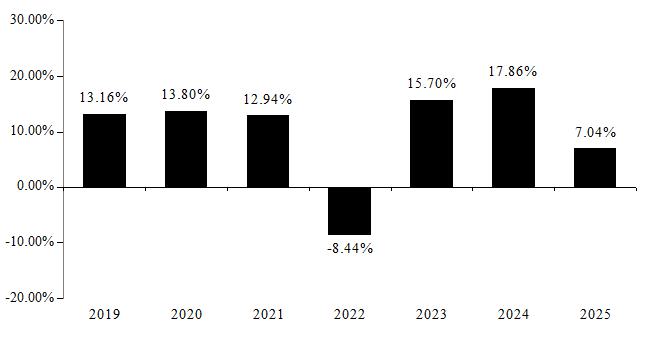
Best Quarter (ended 6/30/2020): 8.82%; Worst Quarter (ended 6/30/2022): -5.07%
Annual Total Returns as of December 31
Class I
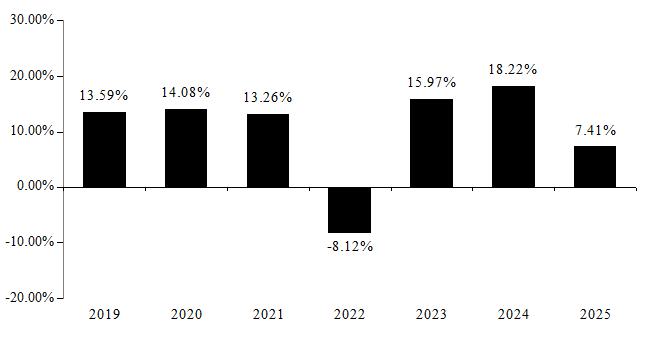
Best Quarter (ended 6/30/2020): 8.88%; Worst Quarter (ended 6/30/2022): -4.96%
| Average Annual Total Returns as of 12/31/2025 | ||||||
| 1 year | 5 year | Life of Fund (August 13, 2018) | ||||
| JNL/JPMorgan Hedged Equity Fund (Class A) | 7.04 | % | 8.58 | % | 8.74 | % |
| S&P 500 Index (reflects no deduction for fees, expenses, or taxes) | 17.88 | % | 14.42 | % | 14.53 | % |
| CBOE S&P 500 BuyWrite Index (reflects no deduction for fees, expenses, or taxes) | 8.91 | % | 9.33 | % | 6.47 | % |
| Average Annual Total Returns as of 12/31/2025 | ||||||
| 1 year | 5 year | Life of Class (August 13, 2018) | ||||
| JNL/JPMorgan Hedged Equity Fund (Class I) | 7.41 | % | 8.91 | % | 9.06 | % |
| S&P 500 Index (reflects no deduction for fees, expenses, or taxes) | 17.88 | % | 14.42 | % | 14.53 | % |
| CBOE S&P 500 BuyWrite Index (reflects no deduction for fees, expenses, or taxes) | 8.91 | % | 9.33 | % | 6.47 | % |
The performance information shown provides some indication of the risks of investing in the Fund by showing changes in the Fund’s performance from year to year and by showing how the Fund’s average annual returns compared with those of a broad-based securities market index and an additional index that the Adviser believes more closely reflects the market segments in which the Fund invests. The Fund’s past performance is not necessarily an indication of how the Fund will perform in the future.
The returns shown in the bar chart and table do not include charges that will be imposed by variable insurance products. If these amounts were reflected, returns would be less than those shown.
Annual Total Returns as of December 31
Class A
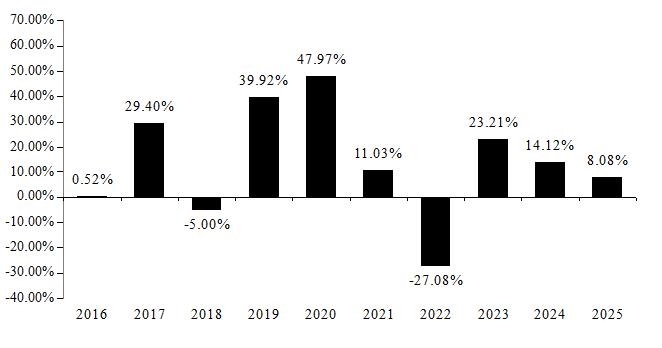
Best Quarter (ended 6/30/2020): 32.46%; Worst Quarter (ended 6/30/2022): -20.76%
Annual Total Returns as of December 31
Class I
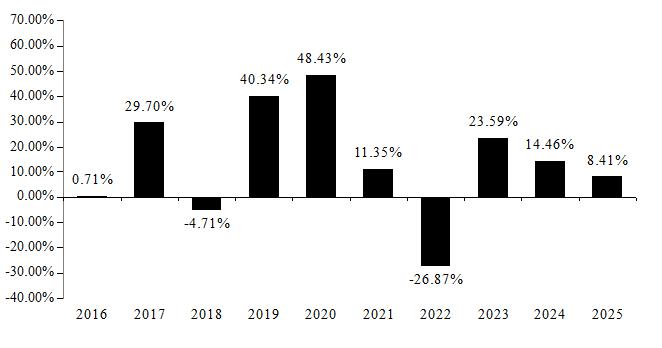
Best Quarter (ended 6/30/2020): 32.54%; Worst Quarter (ended 6/30/2022): -20.70%
| Average Annual Total Returns as of 12/31/2025 | ||||||
| 1 year | 5 year | 10 year | ||||
| JNL/JPMorgan MidCap Growth Fund (Class A) | 8.08 | % | 4.23 | % | 12.15 | % |
| Morningstar US Market Extended Index (reflects no deduction for fees, expenses, or taxes) | 17.21 | % | 13.13 | % | 14.31 | % |
| Morningstar US Mid Cap Broad Growth Index (reflects no deduction for fees, expenses, or taxes) | 6.78 | % | 6.07 | % | 11.88 | % |
| Average Annual Total Returns as of 12/31/2025 | ||||||
| 1 year | 5 year | 10 year | ||||
| JNL/JPMorgan MidCap Growth Fund (Class I) | 8.41 | % | 4.54 | % | 12.47 | % |
| Morningstar US Market Extended Index (reflects no deduction for fees, expenses, or taxes) | 17.21 | % | 13.13 | % | 14.31 | % |
| Morningstar US Mid Cap Broad Growth Index (reflects no deduction for fees, expenses, or taxes) | 6.78 | % | 6.07 | % | 11.88 | % |
The performance information shown provides some indication of the risks of investing in the Fund by showing changes in the Fund’s performance from year to year and by showing how the Fund’s average annual returns compared with those of broad-based securities market indices and additional indices that the Adviser believes more closely reflects the market segments in which the Fund invests. The Fund’s past performance is not necessarily an indication of how the Fund will perform in the future.
The returns shown in the bar chart and table do not include charges that will be imposed by variable insurance products. If these amounts were reflected, returns would be less than those shown.
Annual Total Returns as of December 31
Class A
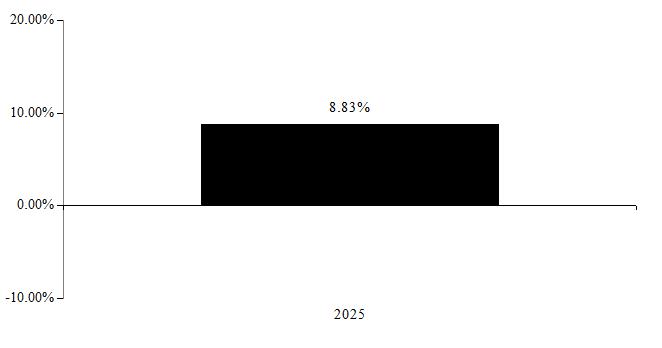
Best Quarter (ended 6/30/2025): 6.51%; Worst Quarter (ended 3/31/2025): -6.02%
Annual Total Returns as of December 31
Class I
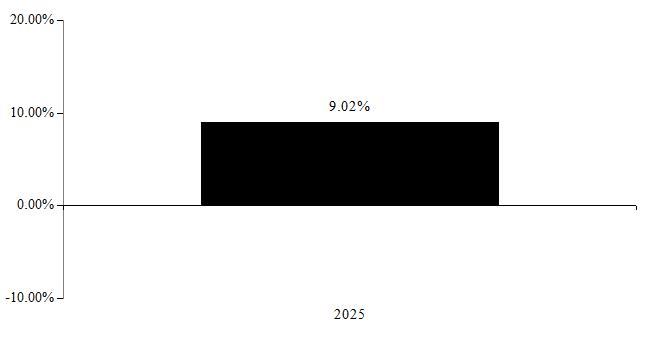
Best Quarter (ended 6/30/2025): 6.60%; Worst Quarter (ended 3/31/2025): -6.01%
| Average Annual Total Returns as of 12/31/2025 | ||||
| 1 year | Life of Fund (October 21, 2024) | |||
| JNL/JPMorgan Nasdaq® Hedged Equity Fund (Class A) | 8.83 | % | 10.01 | % |
| Morningstar US Target Market Exposure Index (reflects no deduction for fees, expenses, or taxes) | 17.80 | % | 15.30 | % |
| Nasdaq 100 Index (reflects no deduction for fees, expenses, or taxes) | 21.02 | % | 20.75 | % |
| CBOE S&P 500 BuyWrite Index (reflects no deduction for fees, expenses, or taxes) | 8.91 | % | 11.68 | % |
| Average Annual Total Returns as of 12/31/2025 | ||||
| 1 year | Life of Class (October 21, 2024) | |||
| JNL/JPMorgan Nasdaq® Hedged Equity Fund (Class I) | 9.02 | % | 10.26 | % |
| Morningstar US Target Market Exposure Index (reflects no deduction for fees, expenses, or taxes) | 17.80 | % | 15.30 | % |
| Nasdaq 100 Index (reflects no deduction for fees, expenses, or taxes) | 21.02 | % | 20.75 | % |
| CBOE S&P 500 BuyWrite Index (reflects no deduction for fees, expenses, or taxes) | 8.91 | % | 11.68 | % |
The performance information shown provides some indication of the risks of investing in the Fund by showing changes in the Fund’s performance from year to year and by showing how the Fund’s average annual returns compared with those of a broad-based securities market index and an additional index that the Adviser believes more closely reflects the market segments in which the Fund invests. The Fund’s past performance is not necessarily an indication of how the Fund will perform in the future.
The returns shown in the bar chart and table do not include charges that will be imposed by variable insurance products. If these amounts were reflected, returns would be less than those shown.
Annual Total Returns as of December 31
Class A
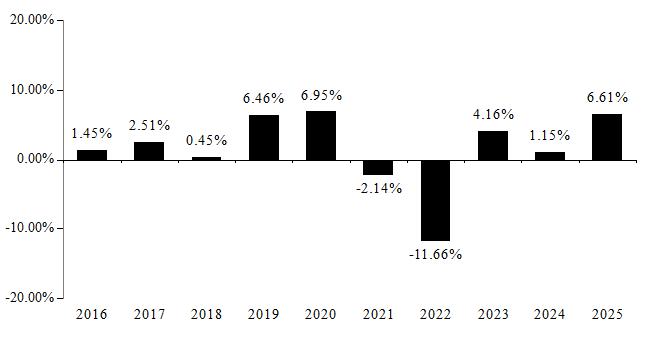
Best Quarter (ended 12/31/2023): 5.77%; Worst Quarter (ended 3/31/2022): -4.95%
Annual Total Returns as of December 31
Class I
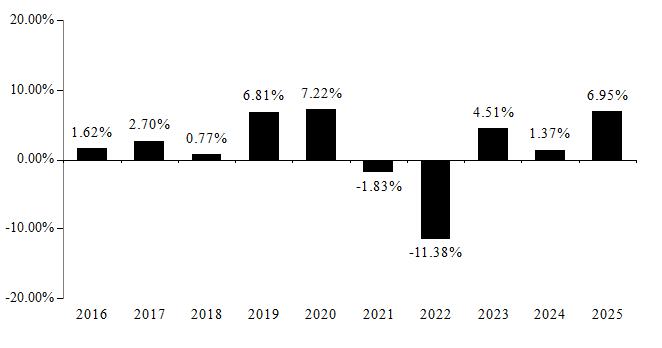
Best Quarter (ended 12/31/2023): 5.86%; Worst Quarter (ended 3/31/2022): -4.93%
| Average Annual Total Returns as of 12/31/2025 | ||||||
| 1 year | 5 year | 10 year | ||||
| JNL/JPMorgan U.S. Government & Quality Bond Fund (Class A) | 6.61 | % | -0.59 | % | 1.45 | % |
| Bloomberg U.S. Aggregate Index (reflects no deduction for fees, expenses, or taxes) | 7.30 | % | -0.36 | % | 2.01 | % |
| Bloomberg U.S. Government Index (reflects no deduction for fees, expenses, or taxes) | 6.31 | % | -0.94 | % | 1.38 | % |
| Average Annual Total Returns as of 12/31/2025 | ||||||
| 1 year | 5 year | 10 year | ||||
| JNL/JPMorgan U.S. Government & Quality Bond Fund (Class I) | 6.95 | % | -0.29 | % | 1.73 | % |
| Bloomberg U.S. Aggregate Index (reflects no deduction for fees, expenses, or taxes) | 7.30 | % | -0.36 | % | 2.01 | % |
| Bloomberg U.S. Government Index (reflects no deduction for fees, expenses, or taxes) | 6.31 | % | -0.94 | % | 1.38 | % |
The performance information shown provides some indication of the risks of investing in the Fund by showing changes in the Fund’s performance from year to year and by showing how the Fund’s average annual returns compared with those of a broad-based securities market index and an additional index that the Adviser believes more closely reflects the market segments in which the Fund invests. Performance prior to April 27, 2020 reflects the Fund’s results when managed by the former sub-adviser, Franklin Mutual Advisers, LLC. The Fund’s past performance is not necessarily an indication of how the Fund will perform in the future.
The returns shown in the bar chart and table do not include charges that will be imposed by variable insurance products. If these amounts were reflected, returns would be less than those shown.
Effective April 27, 2020, the Fund was combined with JNL/PPM America Value Equity Fund (the “Acquired Fund”), with the Fund as the surviving Fund. The performance shown is the Fund’s historic performance and does not reflect the performance of the Acquired Fund.
Annual Total Returns as of December 31
Class A
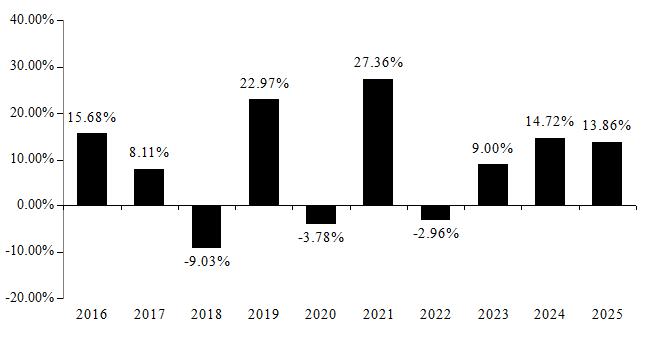
Best Quarter (ended 12/31/2020): 15.79%; Worst Quarter (ended 3/31/2020): -29.39%
Annual Total Returns as of December 31
Class I
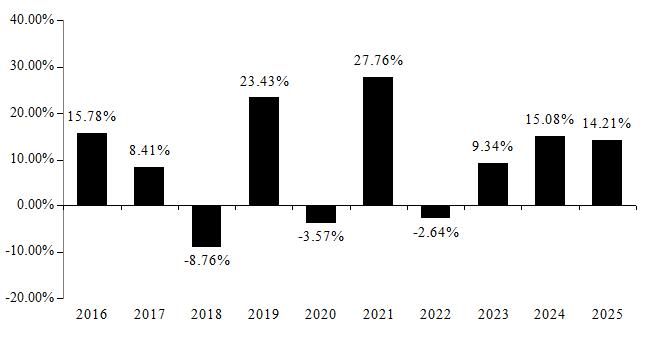
Best Quarter (ended 12/31/2020): 15.84%; Worst Quarter (ended 3/31/2020): -29.31%
| Average Annual Total Returns as of 12/31/2025 | ||||||
| 1 year | 5 year | 10 year | ||||
| JNL/JPMorgan U.S. Value Fund (Class A) | 13.86 | % | 11.97 | % | 9.01 | % |
| Morningstar US Target Market Exposure Index (reflects no deduction for fees, expenses, or taxes) | 17.80 | % | 13.88 | % | 14.77 | % |
| Morningstar US Large-Mid Cap Broad Value Index (reflects no deduction for fees, expenses, or taxes) | 18.83 | % | 13.38 | % | 12.50 | % |
| Average Annual Total Returns as of 12/31/2025 | ||||||
| 1 year | 5 year | 10 year | ||||
| JNL/JPMorgan U.S. Value Fund (Class I) | 14.21 | % | 12.32 | % | 9.31 | % |
| Morningstar US Target Market Exposure Index (reflects no deduction for fees, expenses, or taxes) | 17.80 | % | 13.88 | % | 14.77 | % |
| Morningstar US Large-Mid Cap Broad Value Index (reflects no deduction for fees, expenses, or taxes) | 18.83 | % | 13.38 | % | 12.50 | % |
The performance information shown provides some indication of the risks of investing in the Fund by showing changes in the Fund’s performance from year to year and by showing how the Fund’s average annual returns compared with those of a broad-based securities market index. The Fund’s past performance is not necessarily an indication of how the Fund will perform in the future.
The returns shown in the bar chart and table do not include charges that will be imposed by variable insurance products. If these amounts were reflected, returns would be less than those shown.
Effective April 27, 2020, the Fund was combined with the JNL/Franklin Templeton Global Fund, with the Fund as the surviving Fund. The performance shown is the Fund’s historic performance and does not reflect the performance of the Acquired Fund.
Effective April 27, 2026, the Fund was combined with JNL/AB Sustainable Global Thematic Fund and JNL/Invesco Global Growth Fund (“Acquired Funds”), with the Fund as the surviving Fund. The performance shown is the Fund’s historic performance and does not reflect the performance of the Acquired Funds.
Annual Total Returns as of December 31
Class A
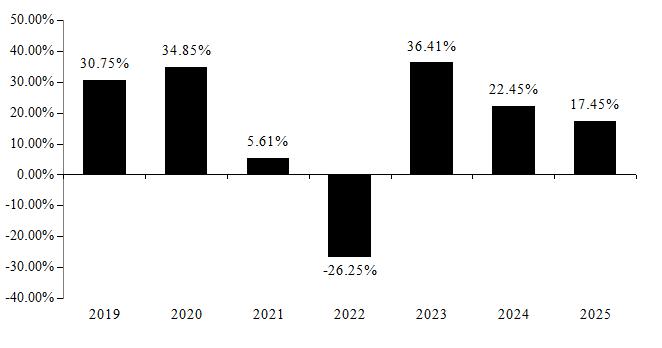
Best Quarter (ended 6/30/2020): 26.32%; Worst Quarter (ended 6/30/2022): -20.33%
Annual Total Returns as of December 31
Class I
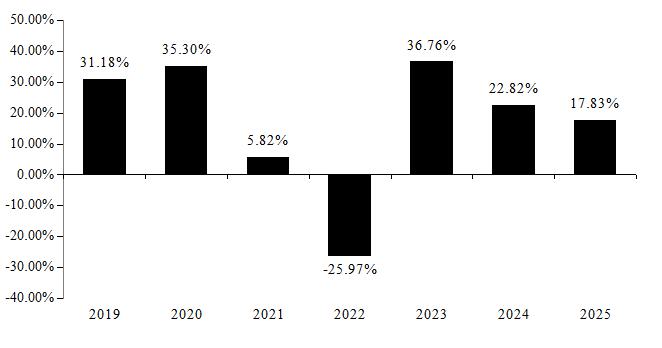
Best Quarter (ended 6/30/2020): 26.39%; Worst Quarter (ended 6/30/2022): -20.31%
| Average Annual Total Returns as of 12/31/2025 | ||||||
| 1 year | 5 year | Life of Fund (August 13, 2018) | ||||
| JNL/Loomis Sayles Global Growth Fund (Class A) | 17.45 | % | 8.85 | % | 12.47 | % |
| Morningstar Global Target Market Exposure Index (Net) (reflects no deduction for fees, expenses, or taxes) | 22.23 | % | 11.20 | % | 11.41 | % |
| Average Annual Total Returns as of 12/31/2025 | ||||||
| 1 year | 5 year | Life of Class (August 13, 2018) | ||||
| JNL/Loomis Sayles Global Growth Fund (Class I) | 17.83 | % | 9.17 | % | 12.81 | % |
| Morningstar Global Target Market Exposure Index (Net) (reflects no deduction for fees, expenses, or taxes) | 22.23 | % | 11.20 | % | 11.41 | % |
The performance information shown provides some indication of the risks of investing in the Fund by showing changes in the Fund’s performance from year to year and by showing how the Fund’s average annual returns compared with those of a broad-based securities market index and an additional index that the Adviser believes more closely reflects the market segments in which the Fund invests. The Fund’s past performance is not necessarily an indication of how the Fund will perform in the future.
The returns shown in the bar chart and table do not include charges that will be imposed by variable insurance products. If these amounts were reflected, returns would be less than those shown.
Annual Total Returns as of December 31
Class A
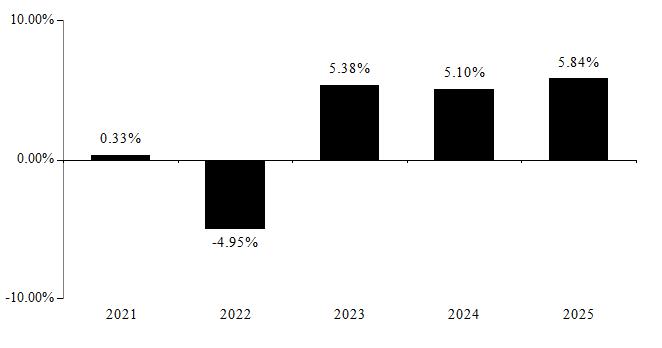
Best Quarter (ended 9/30/2024): 2.82%; Worst Quarter (ended 3/31/2022): -2.78%
Annual Total Returns as of December 31
Class I
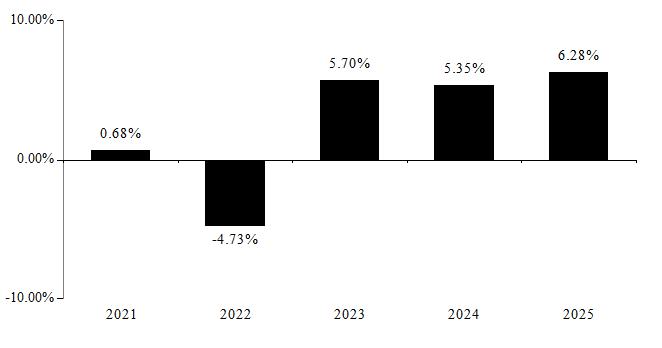
Best Quarter (ended 12/31/2023): 2.90%; Worst Quarter (ended 3/31/2022): -2.76%
| Average Annual Total Returns as of 12/31/2025 | ||||||
| 1 year | 5 year | Life of Fund (April 27, 2020) | ||||
| JNL/Lord Abbett Short Duration Income Fund (Class A) | 5.84 | % | 2.25 | % | 2.77 | % |
| Bloomberg U.S. Aggregate Index (reflects no deduction for fees, expenses, or taxes) | 7.30 | % | -0.36 | % | 0.10 | % |
| ICE BofA 1-3 Year U.S. Corporate Index (reflects no deduction for fees, expenses, or taxes) | 5.89 | % | 2.49 | % | 2.86 | % |
| Average Annual Total Returns as of 12/31/2025 | ||||||
| 1 year | 5 year | Life of Class (April 27, 2020) | ||||
| JNL/Lord Abbett Short Duration Income Fund (Class I) | 6.28 | % | 2.57 | % | 3.09 | % |
| Bloomberg U.S. Aggregate Index (reflects no deduction for fees, expenses, or taxes) | 7.30 | % | -0.36 | % | 0.10 | % |
| ICE BofA 1-3 Year U.S. Corporate Index (reflects no deduction for fees, expenses, or taxes) | 5.89 | % | 2.49 | % | 2.86 | % |
Prior to April 26, 2021, the Fund was managed by JNAM and implemented its investment strategy directly through a sub-adviser.
Effective April 26, 2021, the Fund operates as a “feeder fund” of the Master Fund. Performance prior to April 26, 2021 reflects
the Fund’s results when its investment strategy was implemented by a sub-adviser rather than via investment in the Master Fund. The performance
information shown provides some indication of the risks of investing in the Fund by showing changes in the Fund’s performance from
year to year and by showing how the Fund’s average annual returns compared with those of a broad-based securities market index.
Performance results include the effect of expense waiver/reduction arrangements for some or all of the periods shown. If such arrangements
had not been in place, performance for those periods would have been lower. The Fund’s past performance is not necessarily an indication
of how the Fund will perform in the future.
The returns shown in the bar chart and table do not include charges that will be imposed by variable insurance products. If these amounts were reflected, returns would be less than those shown.
Annual Total Returns as of December 31
Class A
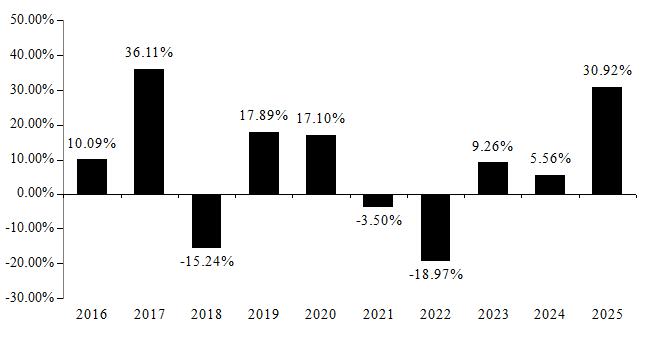
Best Quarter (ended 12/31/2020): 18.78%; Worst Quarter (ended 3/31/2020): -23.98%
Annual Total Returns as of December 31
Class I
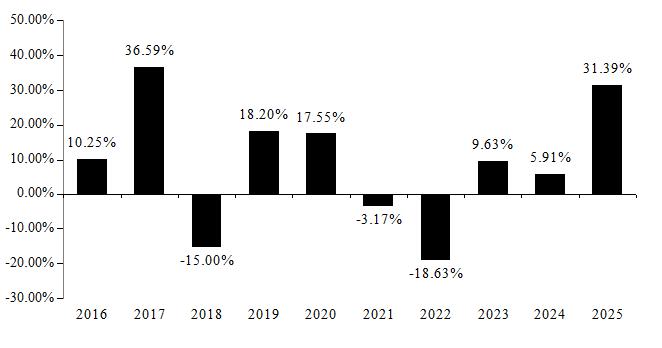
Best Quarter (ended 12/31/2020): 18.91%; Worst Quarter (ended 3/31/2020): -23.86%
| Average Annual Total Returns as of 12/31/2025 | ||||||
| 1 year | 5 year | 10 year | ||||
| JNL/Mellon Emerging Markets Index Fund (Class A) | 30.92 | % | 3.38 | % | 7.55 | % |
| Morningstar Emerging Markets Target Market Exposure Index (Net) (reflects no deduction for fees, expenses, or taxes) | 31.62 | % | 4.54 | % | 8.77 | % |
| Average Annual Total Returns as of 12/31/2025 | ||||||
| 1 year | 5 year | 10 year | ||||
| JNL/Mellon Emerging Markets Index Fund (Class I) | 31.39 | % | 3.75 | % | 7.89 | % |
| Morningstar Emerging Markets Target Market Exposure Index (Net) (reflects no deduction for fees, expenses, or taxes) | 31.62 | % | 4.54 | % | 8.77 | % |
The performance information shown provides some indication of the risks of investing in the Fund by showing changes in the Fund’s performance from year to year and by showing how the Fund’s average annual returns compared with those of a broad-based securities market index. Performance results include the effect of expense waiver/reduction arrangements for some or all of the periods shown. If such arrangements had not been in place, performance for those periods would have been lower. The Fund’s past performance is not necessarily an indication of how the Fund will perform in the future.
The returns shown in the bar chart and table do not include charges that will be imposed by variable insurance products. If these amounts were reflected, returns would be less than those shown.
Annual Total Returns as of December 31
Class A
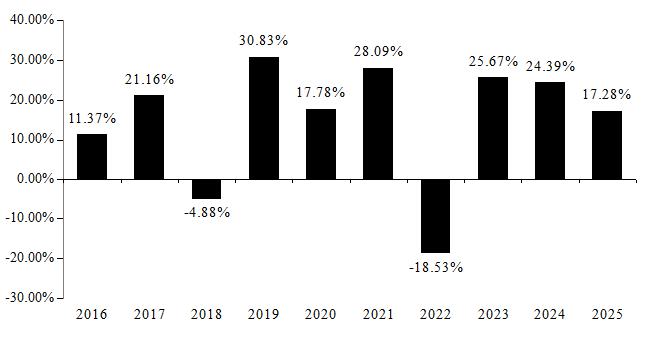
Best Quarter (ended 6/30/2020): 20.40%; Worst Quarter (ended 3/31/2020): -19.73%
Annual Total Returns as of December 31
Class I
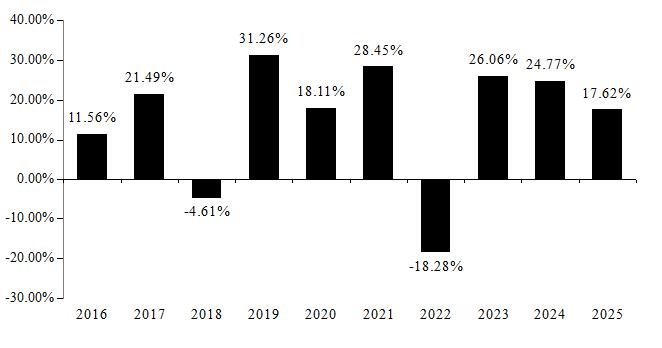
Best Quarter (ended 6/30/2020): 20.55%; Worst Quarter (ended 3/31/2020): -19.72%
| Average Annual Total Returns as of 12/31/2025 | ||||||
| 1 year | 5 year | 10 year | ||||
| JNL/Mellon S&P 500 Index Fund (Class A) | 17.28 | % | 13.86 | % | 14.24 | % |
| S&P 500 Index (reflects no deduction for fees, expenses, or taxes) | 17.88 | % | 14.42 | % | 14.82 | % |
| Average Annual Total Returns as of 12/31/2025 | ||||||
| 1 year | 5 year | 10 year | ||||
| JNL/Mellon S&P 500 Index Fund (Class I) | 17.62 | % | 14.20 | % | 14.56 | % |
| S&P 500 Index (reflects no deduction for fees, expenses, or taxes) | 17.88 | % | 14.42 | % | 14.82 | % |
Prior to April 26, 2021, the Fund was managed by JNAM and implemented its investment strategy directly through a
sub-adviser. Effective April 26, 2021, the Fund operates as a “feeder fund” of the Master Fund. Performance prior to April
26, 2021 reflects the Fund’s results when its investment strategy was implemented by a sub-adviser rather than via investment in
the Master Fund. The performance information shown provides some indication of the risks of investing in the Fund by showing changes
in the Fund’s performance from year to year and by showing how the Fund’s average annual returns compared with those of a
broad-based securities market index and an additional index that the Adviser believes more closely reflects the market segments in which
the Fund invests. Performance results include the effect of expense waiver/reduction arrangements for some or all of the periods shown.
If such arrangements had not been in place, performance for those periods would have been lower. The Fund’s past performance is
not necessarily an indication of how the Fund will perform in the future.
The returns shown in the bar chart and table do not include charges that will be imposed by variable insurance products. If these amounts were reflected, returns would be less than those shown.
Effective April 27, 2020, the Fund was combined with JNL/S&P Mid 3 Fund (the “Acquired Fund”), with the Fund as the surviving Fund. The performance shown is the Fund’s historic performance and does not reflect the performance of the Acquired Fund.
Annual Total Returns as of December 31
Class A
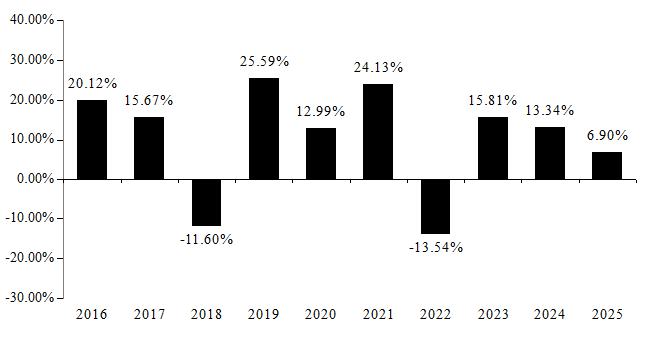
Best Quarter (ended 12/31/2020): 24.21%; Worst Quarter (ended 3/31/2020): -29.80%
Annual Total Returns as of December 31
Class I
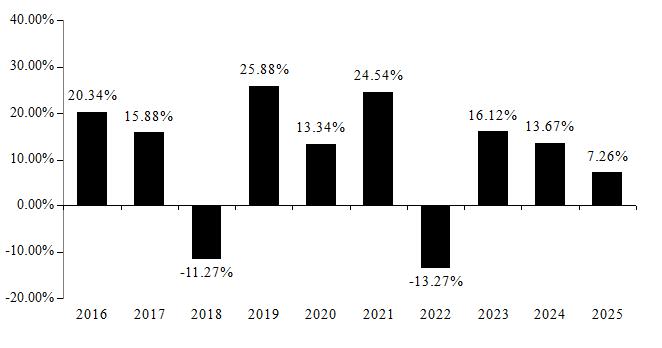
Best Quarter (ended 12/31/2020): 24.31%; Worst Quarter (ended 3/31/2020): -29.73%
| Average Annual Total Returns as of 12/31/2025 | ||||||
| 1 year | 5 year | 10 year | ||||
| JNL/Mellon S&P 400 MidCap Index Fund (Class A) | 6.90 | % | 8.53 | % | 10.13 | % |
| Morningstar US Market Extended Index (reflects no deduction for fees, expenses, or taxes) | 17.21 | % | 13.13 | % | 14.31 | % |
| S&P MidCap 400 Index (reflects no deduction for fees, expenses, or taxes) | 7.50 | % | 9.12 | % | 10.72 | % |
| Average Annual Total Returns as of 12/31/2025 | ||||||
| 1 year | 5 year | 10 year | ||||
| JNL/Mellon S&P 400 MidCap Index Fund (Class I) | 7.26 | % | 8.87 | % | 10.44 | % |
| Morningstar US Market Extended Index (reflects no deduction for fees, expenses, or taxes) | 17.21 | % | 13.13 | % | 14.31 | % |
| S&P MidCap 400 Index (reflects no deduction for fees, expenses, or taxes) | 7.50 | % | 9.12 | % | 10.72 | % |
Prior to April 26, 2021, the Fund was managed by JNAM and implemented its investment strategy directly through a sub-adviser.
Effective April 26, 2021, the Fund operates as a “feeder fund” of the Master Fund. Performance prior to April 26, 2021 reflects
the Fund’s results when its investment strategy was implemented by a sub-adviser rather than via investment in the Master Fund. The performance
information shown provides some indication of the risks of investing in the Fund by showing changes in the Fund’s performance from
year to year and by showing how the Fund’s average annual returns compared with those of a broad-based securities market index and
an additional index that the Adviser believes more closely reflects the market segments in which the Fund invests. Performance results
include the effect of expense waiver/reduction arrangements for some or all of the periods shown. If such arrangements had not been in
place, performance for those periods would have been lower. The Fund’s past performance is not necessarily an indication of how
the Fund will perform in the future.
The returns shown in the bar chart and table do not include charges that will be imposed by variable insurance products. If these amounts were reflected, returns would be less than those shown.
Annual Total Returns as of December 31
Class A
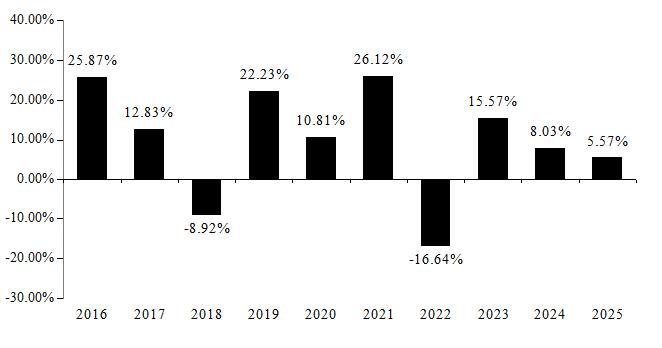
Best Quarter (ended 12/31/2020): 31.17%; Worst Quarter (ended 3/31/2020): -32.74%
Annual Total Returns as of December 31
Class I
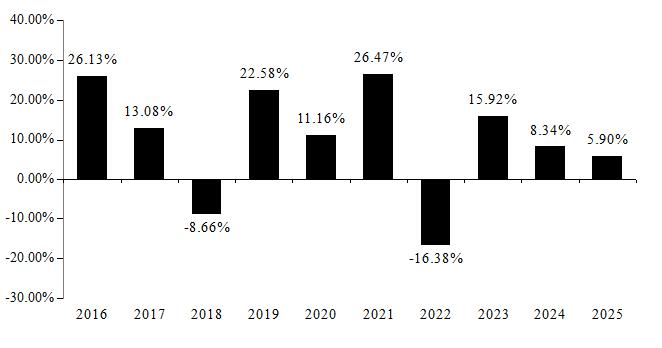
Best Quarter (ended 12/31/2020): 31.26%; Worst Quarter (ended 3/31/2020): -32.68%
| Average Annual Total Returns as of 12/31/2025 | ||||||
| 1 year | 5 year | 10 year | ||||
| JNL/Mellon Small Cap Index Fund (Class A) | 5.57 | % | 6.74 | % | 9.27 | % |
| Morningstar US Market Extended Index (reflects no deduction for fees, expenses, or taxes) | 17.21 | % | 13.13 | % | 14.31 | % |
| S&P SmallCap 600 Index (reflects no deduction for fees, expenses, or taxes) | 6.02 | % | 7.31 | % | 9.81 | % |
| Average Annual Total Returns as of 12/31/2025 | ||||||
| 1 year | 5 year | 10 year | ||||
| JNL/Mellon Small Cap Index Fund (Class I) | 5.90 | % | 7.06 | % | 9.58 | % |
| Morningstar US Market Extended Index (reflects no deduction for fees, expenses, or taxes) | 17.21 | % | 13.13 | % | 14.31 | % |
| S&P SmallCap 600 Index (reflects no deduction for fees, expenses, or taxes) | 6.02 | % | 7.31 | % | 9.81 | % |
Prior to April 26, 2021, the Fund was managed by JNAM and implemented its investment strategy directly through a sub-adviser. Effective April 26, 2021, the Fund operates as a “feeder fund” of the Master Fund. Performance prior to April 26, 2021 reflects the Fund’s results when its investment strategy was implemented by a sub-adviser rather than via investment in the Master Fund. The performance information shown provides some indication of the risks of investing in the Fund by showing changes in the Fund’s performance from year to year and by showing how the Fund’s average annual returns compared with those of a broad-based securities market index. Performance results include the effect of expense waiver/reduction arrangements for some or all of the periods shown. If such arrangements had not been in place, performance for those periods would have been lower. The Fund’s past performance is not necessarily an indication of how the Fund will perform in the future.
The returns shown in the bar chart and table do not include charges that will be imposed by variable insurance products. If these amounts were reflected, returns would be less than those shown.
Effective April 26, 2021, the Fund was combined with JNL/Goldman Sachs International 5 Fund, JNL/RAFI® Fundamental Asia Developed Fund, JNL/RAFI® Fundamental Europe Fund, and JNL/Vanguard International Stock Index Fund (“Acquired Funds”), with the Fund as the surviving Fund. The performance shown is the Fund’s historic performance and does not reflect the performance of the Acquired Funds.
Effective April 28, 2025, the Fund was combined with the JNL/Baillie Gifford International Growth Fund (“Acquired Fund”), with the Fund as the surviving Fund. The performance shown is the Fund’s historical performance and does not reflect the performance of the Acquired Fund.
Annual Total Returns as of December 31
Class A
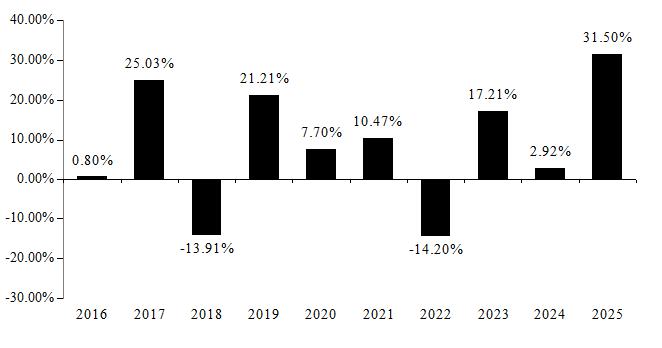
Best Quarter (ended 12/31/2022): 18.52%; Worst Quarter (ended 3/31/2020): -22.97%
Annual Total Returns as of December 31
Class I
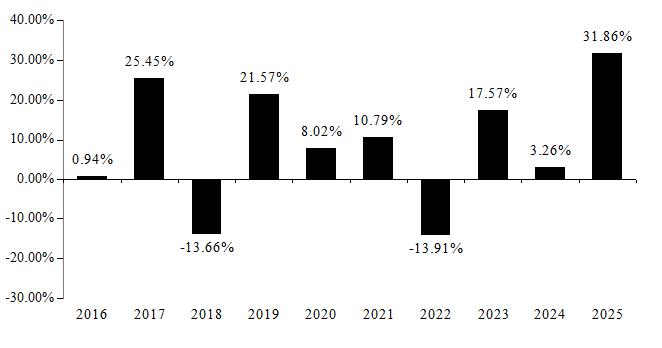
Best Quarter (ended 12/31/2022): 18.59%; Worst Quarter (ended 3/31/2020): -22.92%
| Average Annual Total Returns as of 12/31/2025 | ||||||
| 1 year | 5 year | 10 year | ||||
| JNL/Mellon International Index Fund (Class A) | 31.50 | % | 8.50 | % | 7.85 | % |
| Morningstar Developed Markets ex-North America Target Market Exposure Index (Net) (reflects no deduction for fees, expenses, or taxes) | 31.61 | % | 9.00 | % | 8.27 | % |
| Average Annual Total Returns as of 12/31/2025 | ||||||
| 1 year | 5 year | 10 year | ||||
| JNL/Mellon International Index Fund (Class I) | 31.86 | % | 8.83 | % | 8.17 | % |
| Morningstar Developed Markets ex-North America Target Market Exposure Index (Net) (reflects no deduction for fees, expenses, or taxes) | 31.61 | % | 9.00 | % | 8.27 | % |
Prior to April 26, 2021, the Fund was managed by JNAM and implemented its investment strategy directly through a sub-adviser. Effective April 26, 2021, the Fund operates as a “feeder fund” of the Master Fund. Performance prior to April 26, 2021 reflects the Fund’s results when its investment strategy was implemented by a sub-adviser rather than via investment in the Master Fund. The performance information shown provides some indication of the risks of investing in the Fund by showing changes in the Fund’s performance from year to year and by showing how the Fund’s average annual returns compared with those of a broad-based securities market index. Performance results include the effect of expense waiver/reduction arrangements for some or all of the periods shown. If such arrangements had not been in place, performance for those periods would have been lower. The Fund’s past performance is not necessarily an indication of how the Fund will perform in the future.
The returns shown in the bar chart and table do not include charges that will be imposed by variable insurance products. If these amounts were reflected, returns would be less than those shown.
Effective April 26, 2021, the Fund was combined with JNL/Vanguard Global Bond Market Index Fund (“Acquired Fund”), with the Fund as the surviving Fund. The performance shown is the Fund’s historic performance and does not reflect the performance of the Acquired Fund.
Annual Total Returns as of December 31
Class A
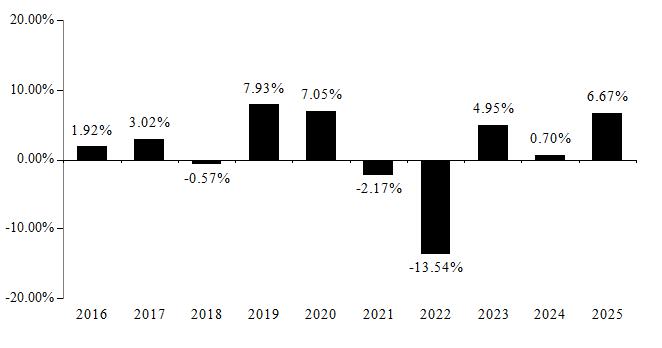
Best Quarter (ended 12/31/2023): 6.60%; Worst Quarter (ended 3/31/2022): -6.02%
Annual Total Returns as of December 31
Class I
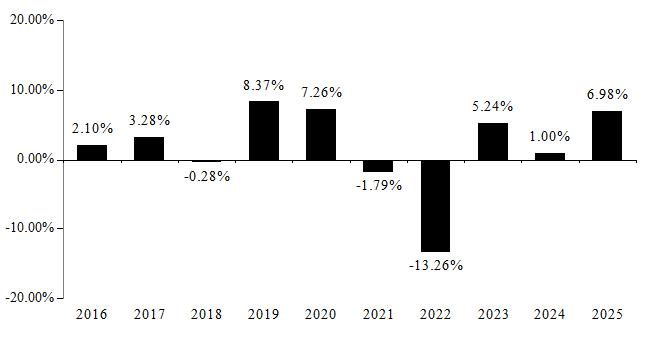
Best Quarter (ended 12/31/2023): 6.64%; Worst Quarter (ended 3/31/2022): -5.91%
| Average Annual Total Returns as of 12/31/2025 | ||||||
| 1 year | 5 year | 10 year | ||||
| JNL/Mellon Bond Index Fund (Class A) | 6.67 | % | -0.95 | % | 1.41 | % |
| Bloomberg U.S. Aggregate Index (reflects no deduction for fees, expenses, or taxes) | 7.30 | % | -0.36 | % | 2.01 | % |
| Average Annual Total Returns as of 12/31/2025 | ||||||
| 1 year | 5 year | 10 year | ||||
| JNL/Mellon Bond Index Fund (Class I) | 6.98 | % | -0.63 | % | 1.70 | % |
| Bloomberg U.S. Aggregate Index (reflects no deduction for fees, expenses, or taxes) | 7.30 | % | -0.36 | % | 2.01 | % |
The performance information shown provides some indication of the risks of investing in the Fund by showing changes in the Fund’s performance from year to year and by showing how the Fund’s average annual returns compared with those of a broad-based securities market index and an additional index that the Adviser believes more closely reflects the market segments in which the Fund invests. Performance results include the effect of expense waiver/reduction arrangements for some or all of the periods shown. If such arrangements had not been in place, performance for those periods would have been lower. Performance prior to April 26, 2021 reflects the Fund’s results when the Fund did not have a sub-adviser and operated as a fund-of-funds. The Fund’s past performance is not necessarily an indication of how the Fund will perform in the future.
The returns shown in the bar chart and table do not include charges that will be imposed by variable insurance products. If these amounts were reflected, returns would be less than those shown.
Effective April 26, 2021, the Fund was combined with JNL/Goldman Sachs Competitive Advantage Fund, JNL/Goldman Sachs Dividend Income & Growth Fund, JNL/Goldman Sachs Intrinsic Value Fund, and JNL/Goldman Sachs Total Yield Fund (“Acquired Funds”), with the Fund as the surviving Fund. The performance shown is the Fund’s historic performance and does not reflect the performance of the Acquired Funds.
Annual Total Returns as of December 31
Class A
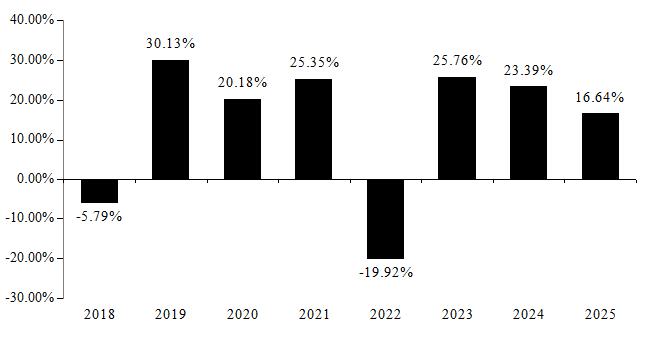
Best Quarter (ended 6/30/2020): 22.01%; Worst Quarter (ended 3/31/2020): -21.10%
Annual Total Returns as of December 31
Class I
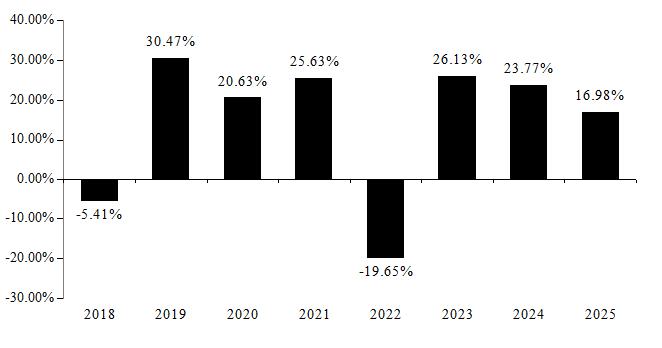
Best Quarter (ended 6/30/2020): 22.11%; Worst Quarter (ended 3/31/2020): -21.01%
| Average Annual Total Returns as of 12/31/2025 | ||||||
| 1 year | 5 year | Life
of Fund (September 25, 2017) | ||||
| JNL/Mellon U.S. Stock Market Index Fund (Class A) | 16.64 | % | 12.68 | % | 13.59 | % |
| Morningstar US Market Extended Index (reflects no deduction for fees, expenses, or taxes) | 17.21 | % | 13.13 | % | 14.16 | % |
| Morningstar US Market Index (reflects no deduction for fees, expenses, or taxes) | 17.35 | % | 13.29 | % | 14.29 | % |
| Average Annual Total Returns as of 12/31/2025 | ||||||
| 1 year | 5 year | Life
of Class (September 25, 2017) | ||||
| JNL/Mellon U.S. Stock Market Index Fund (Class I) | 16.98 | % | 13.01 | % | 13.94 | % |
| Morningstar US Market Extended Index (reflects no deduction for fees, expenses, or taxes) | 17.21 | % | 13.13 | % | 14.16 | % |
| Morningstar US Market Index (reflects no deduction for fees, expenses, or taxes) | 17.35 | % | 13.29 | % | 14.29 | % |
The performance information shown provides some indication of the risks of investing in the Fund by showing changes in the Fund’s performance from year to year and by showing how the Fund’s average annual returns compared with those of a broad-based securities market index and an additional index that the Adviser believes more closely reflects the market segments in which the Fund invests. Performance results include the effect of expense waiver/reduction arrangements for some or all of the periods shown, and if such arrangements had not been in place, performance for those periods would have been lower. The Fund’s past performance is not necessarily an indication of how the Fund will perform in the future.
The returns shown in the bar chart and table do not include charges that will be imposed by variable insurance products. If these amounts were reflected, returns would be less than those shown.
The performance data includes the performance of the Fund, then a series of the JNL Variable Fund LLC for periods before the Fund’s registration statement became effective.
Effective April 27, 2020, the Fund was combined with JNL/Mellon S&P 1500 Value Index Fund (the “Acquired Fund”), a series of JNL Series Trust, with the Fund as the surviving Fund. The performance shown is the Fund’s historic performance and does not reflect the performance of the Acquired Fund.
Annual Total Returns as of December 31
Class A
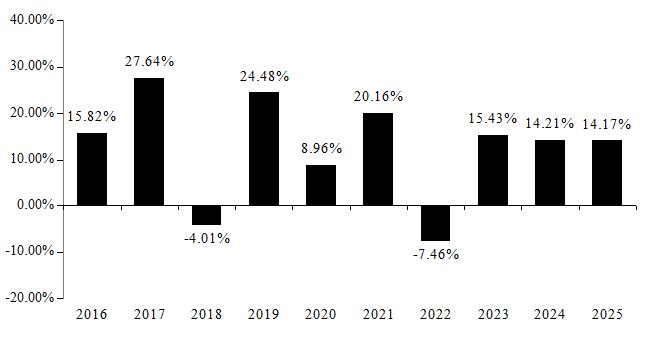
Best Quarter (ended 6/30/2020): 18.37%; Worst Quarter (ended 3/31/2020): -22.90%
Annual Total Returns as of December 31
Class I
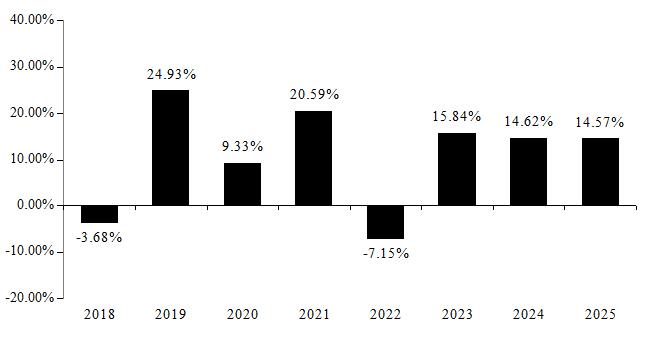
Best Quarter (ended 6/30/2020): 18.48%; Worst Quarter (ended 3/31/2020): -22.84%
| Average Annual Total Returns as of 12/31/2025 | ||||||
| 1 year | 5 year | 10 year | ||||
| JNL/Mellon DowSM Index Fund (Class A) | 14.17 | % | 10.85 | % | 12.41 | % |
| Morningstar US Target Market Exposure Index (reflects no deduction for fees, expenses, or taxes) | 17.80 | % | 13.88 | % | 14.77 | % |
| Dow Jones Industrial Average (reflects no deduction for fees, expenses, or taxes) | 14.92 | % | 11.58 | % | 13.11 | % |
| Average Annual Total Returns as of 12/31/2025 | ||||||
| 1 year | 5 year | Life
of Class (September 25, 2017) | ||||
| JNL/Mellon DowSM Index Fund (Class I) | 14.57 | % | 11.24 | % | 11.67 | % |
| Morningstar US Target Market Exposure Index (reflects no deduction for fees, expenses, or taxes) | 17.80 | % | 13.88 | % | 14.76 | % |
| Dow Jones Industrial Average (reflects no deduction for fees, expenses, or taxes) | 14.92 | % | 11.58 | % | 12.01 | % |
The performance information shown provides some indication of the risks of investing in the Fund by showing changes
in the Fund’s performance from year to year and by showing how the Fund’s average annual returns compared with those of a
broad-based securities market index. Performance information prior to September 25, 2017 reflects the Fund’s results when managed
by the sub-adviser utilizing a different investment strategy. Performance results include the effect of expense waiver/reduction arrangements
for some or all of the periods shown, and if such arrangements had not been in place, performance for those periods would have been lower.
The Fund’s past performance is not necessarily an indication of how the Fund will perform in the future.
The returns shown in the bar chart and table do not include charges that will be imposed by variable insurance products. If these amounts were reflected, returns would be less than those shown.
The performance data includes the performance of the JNL/Mellon MSCI World Index Fund, then a series of the JNL Variable Fund LLC, for periods before the Fund’s registration statement became effective.
Effective April 28, 2025, the Fund was combined with the JNL/Harris Oakmark Global Equity Fund (“Acquired Fund”), with the Fund as the surviving Fund. The performance shown is the Fund’s historical performance and does not reflect the performance of the Acquired Fund.
Annual Total Returns as of December 31
Class A
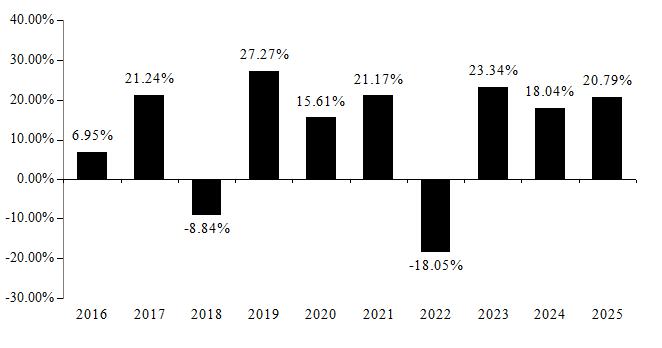
Best Quarter (ended 6/30/2020): 19.56%; Worst Quarter (ended 3/31/2020): -21.13%
Annual Total Returns as of December 31
Class I
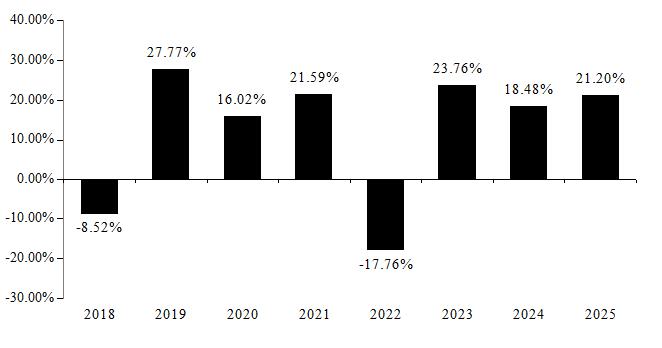
Best Quarter (ended 6/30/2020): 19.70%; Worst Quarter (ended 3/31/2020): -21.09%
| Average Annual Total Returns as of 12/31/2025 | ||||||
| 1 year | 5 year | 10 year | ||||
| JNL/Mellon World Index Fund (Class A) | 20.79 | % | 11.80 | % | 11.75 | % |
| Morningstar Developed Markets Target Market Exposure Index (Net) (reflects no deduction for fees, expenses, or taxes) | 21.13 | % | 12.12 | % | 12.11 | % |
| Average Annual Total Returns as of 12/31/2025 | ||||||
| 1 year | 5 year | Life of Class (September 25, 2017) | ||||
| JNL/Mellon World Index Fund (Class I) | 21.20 | % | 12.19 | % | 12.00 | % |
| Morningstar Developed Markets Target Market Exposure Index (Net) (reflects no deduction for fees, expenses, or taxes) | 21.13 | % | 12.12 | % | 11.85 | % |
The performance information shown provides
some indication of the risks of investing in the Fund by showing changes in the Fund’s performance from year to year and by showing
how the Fund’s average annual returns compared with those of a broad-based securities market index and an additional index that
the Adviser believes more closely reflects the market segments in which the Fund invests. The performance information shown prior to
April 25, 2016 reflects the Fund’s results when utilizing a different investment strategy. Performance results include the effect
of expense waiver/reduction arrangements for some or all of the periods shown. If such arrangements had not been in place, performance
for those periods would have been lower. The Fund’s past performance is not necessarily an indication of how the Fund will perform
in the future.
The returns shown in the bar chart and table do not include charges that will be imposed by variable insurance products. If these amounts were reflected, returns would be less than those shown.
The performance data includes the performance of the Fund, then a series of the JNL Variable Fund LLC for periods before the Fund’s registration statement became effective.
Effective April 27, 2020, the Fund was combined with JNL/Mellon S&P 1500 Growth Index Fund (the “Acquired Fund”), a series of JNL Series Trust, with the Fund as the surviving Fund. The performance shown is the Fund’s historic performance and does not reflect the performance of the Acquired Fund.
Annual Total Returns as of December 31
Class A
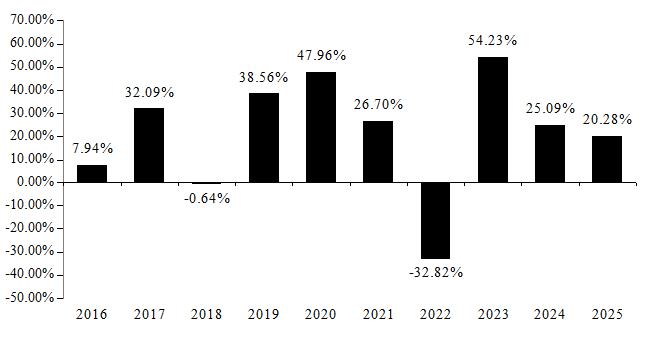
Best Quarter (ended 6/30/2020): 30.06%; Worst Quarter (ended 6/30/2022): -22.45%
Annual Total Returns as of December 31
Class I
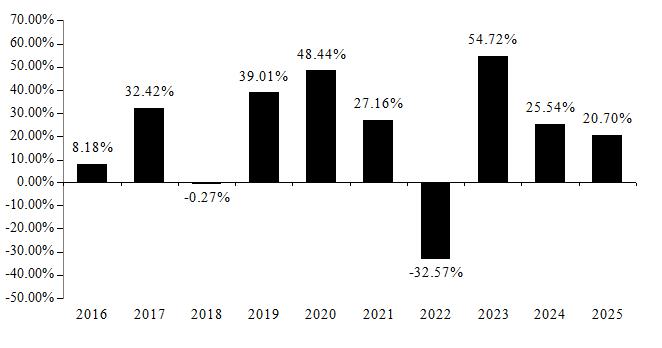
Best Quarter (ended 6/30/2020): 30.17%; Worst Quarter (ended 6/30/2022): -22.36%
| Average Annual Total Returns as of 12/31/2025 | ||||||
| 1 year | 5 year | 10 year | ||||
| JNL/Mellon Nasdaq® 100 Index Fund (Class A) | 20.28 | % | 14.58 | % | 19.09 | % |
| Morningstar US Target Market Exposure Index (reflects no deduction for fees, expenses, or taxes) | 17.80 | % | 13.88 | % | 14.77 | % |
| Nasdaq 100 Index (reflects no deduction for fees, expenses, or taxes) | 21.02 | % | 15.30 | % | 19.70 | % |
| Average Annual Total Returns as of 12/31/2025 | ||||||
| 1 year | 5 year | 10 year | ||||
| JNL/Mellon Nasdaq® 100 Index Fund (Class I) | 20.70 | % | 14.99 | % | 19.48 | % |
| Morningstar US Target Market Exposure Index (reflects no deduction for fees, expenses, or taxes) | 17.80 | % | 13.88 | % | 14.77 | % |
| Nasdaq 100 Index (reflects no deduction for fees, expenses, or taxes) | 21.02 | % | 15.30 | % | 19.70 | % |
The performance information shown provides some indication of the risks of investing in the Fund by showing changes in the Fund’s performance from year to year and by showing how the Fund’s average annual returns compared with those of a broad-based securities market index and an additional index that the Adviser believes more closely reflects the market segments in which the Fund invests. Performance results include the effect of expense waiver/reduction arrangements for some or all of the periods shown, and if such arrangements had not been in place, performance for those periods would have been lower. The Fund’s past performance is not necessarily an indication of how the Fund will perform in the future.
The returns shown in the bar chart and table do not include charges that will be imposed by variable insurance products. If these amounts were reflected, returns would be less than those shown.
The performance data includes the performance of the JNL/Mellon Communication Services Sector Fund, then a series of the JNL Variable Fund LLC, for periods before the Fund’s registration statement became effective.
Annual Total Returns as of December 31
Class A
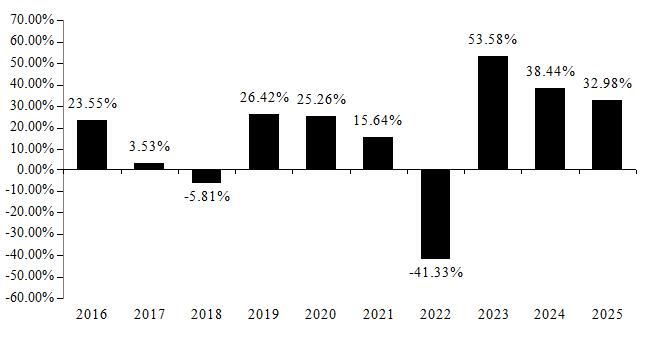
Best Quarter (ended 6/30/2020): 20.77%; Worst Quarter (ended 6/30/2022): -22.03%
Annual Total Returns as of December 31
Class I
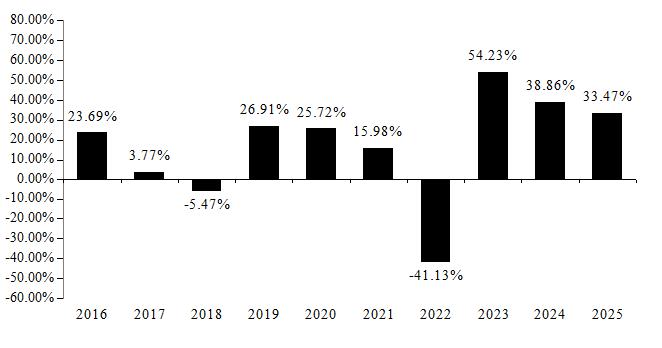
Best Quarter (ended 6/30/2020): 20.79%; Worst Quarter (ended 6/30/2022): -21.91%
| Average Annual Total Returns as of 12/31/2025 | ||||||
| 1 year | 5 year | 10 year | ||||
| JNL/Mellon Communication Services Sector Fund (Class A) | 32.98 | % | 13.91 | % | 13.85 | % |
| Morningstar US Market Extended Index (reflects no deduction for fees, expenses, or taxes) | 17.21 | % | 13.13 | % | 14.31 | % |
| Morningstar US Communication Services Index (reflects no deduction for fees, expenses, or taxes) | 33.93 | % | 14.49 | % | 15.10 | % |
| Average Annual Total Returns as of 12/31/2025 | ||||||
| 1 year | 5 year | 10 year | ||||
| JNL/Mellon Communication Services Sector Fund (Class I) | 33.47 | % | 14.31 | % | 14.21 | % |
| Morningstar US Market Extended Index (reflects no deduction for fees, expenses, or taxes) | 17.21 | % | 13.13 | % | 14.31 | % |
| Morningstar US Communication Services Index (reflects no deduction for fees, expenses, or taxes) | 33.93 | % | 14.49 | % | 15.10 | % |
The performance information shown provides some indication of the risks of investing in the Fund by showing changes
in the Fund’s performance from year to year and by showing how the Fund’s average annual returns compared with those of a
broad-based securities market index and an additional index that the Adviser believes more closely reflects the market segments in which
the Fund invests. Performance results include the effect of expense waiver/reduction arrangements for some or all of the periods shown,
and if such arrangements had not been in place, performance for those periods would have been lower. The Fund’s past performance
is not necessarily an indication of how the Fund will perform in the future.
The returns shown in the bar chart and table do not include charges that will be imposed by variable insurance products. If these amounts were reflected, returns would be less than those shown.
The performance data includes the performance of the JNL/Mellon Consumer Discretionary Sector Fund, then a series of the JNL Variable Fund LLC, for periods before the Fund’s registration statement became effective.
Annual Total Returns as of December 31
Class A
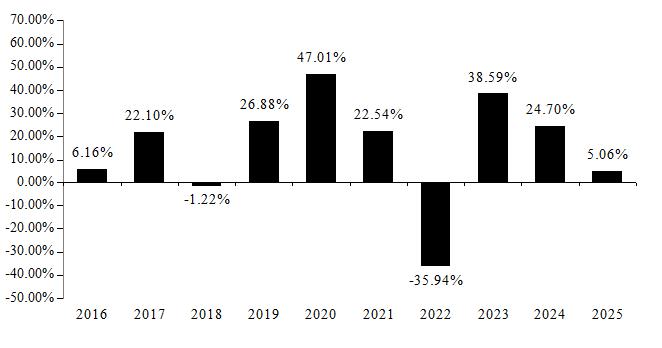
Best Quarter (ended 6/30/2020): 38.02%; Worst Quarter (ended 6/30/2022): -25.32%
Annual Total Returns as of December 31
Class I
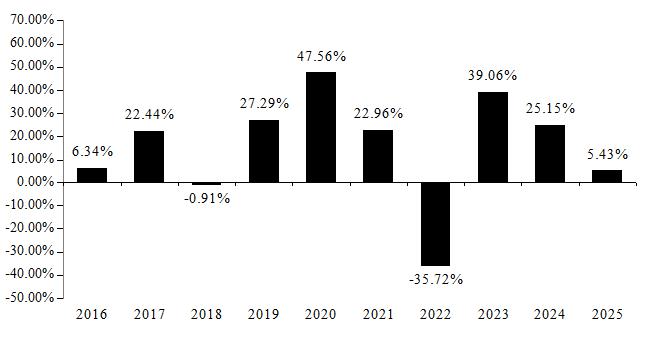
Best Quarter (ended 6/30/2020): 38.09%; Worst Quarter (ended 6/30/2022): -25.24%
| Average Annual Total Returns as of 12/31/2025 | ||||||
| 1 year | 5 year | 10 year | ||||
| JNL/Mellon Consumer Discretionary Sector Fund (Class A) | 5.06 | % | 7.35 | % | 13.03 | % |
| Morningstar US Market Extended Index (reflects no deduction for fees, expenses, or taxes) | 17.21 | % | 13.13 | % | 14.31 | % |
| Morningstar US Consumer Cyclical Index (reflects no deduction for fees, expenses, or taxes) | 5.70 | % | 8.06 | % | 13.92 | % |
| Average Annual Total Returns as of 12/31/2025 | ||||||
| 1 year | 5 year | 10 year | ||||
| JNL/Mellon Consumer Discretionary Sector Fund (Class I) | 5.43 | % | 7.72 | % | 13.39 | % |
| Morningstar US Market Extended Index (reflects no deduction for fees, expenses, or taxes) | 17.21 | % | 13.13 | % | 14.31 | % |
| Morningstar US Consumer Cyclical Index (reflects no deduction for fees, expenses, or taxes) | 5.70 | % | 8.06 | % | 13.92 | % |
The performance information shown provides some indication of the risks of investing in the Fund by showing changes in the Fund’s performance from year to year and by showing how the Fund’s average annual returns compared with those of a broad-based securities market index and an additional index that the Adviser believes more closely reflects the market segments in which the Fund invests. Performance results include the effect of expense waiver/reduction arrangements for some or all of the periods shown, and if such arrangements had not been in place, performance for those periods would have been lower. The Fund’s past performance is not necessarily an indication of how the Fund will perform in the future.
The returns shown in the bar chart and table do not include charges that will be imposed by variable insurance products. If these amounts were reflected, returns would be less than those shown.
Annual Total Returns as of December 31
Class A
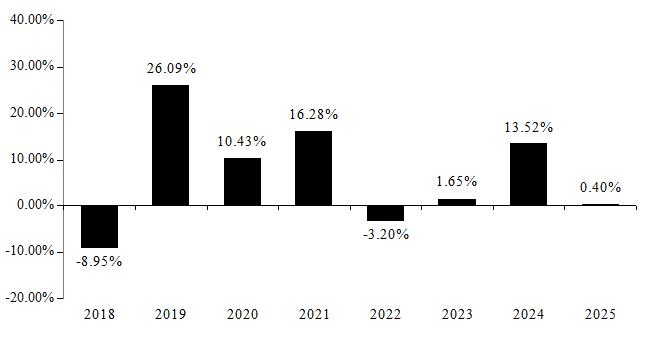
Best Quarter (ended 12/31/2022): 11.57%; Worst Quarter (ended 3/31/2020): -13.63%
Annual Total Returns as of December 31
Class I
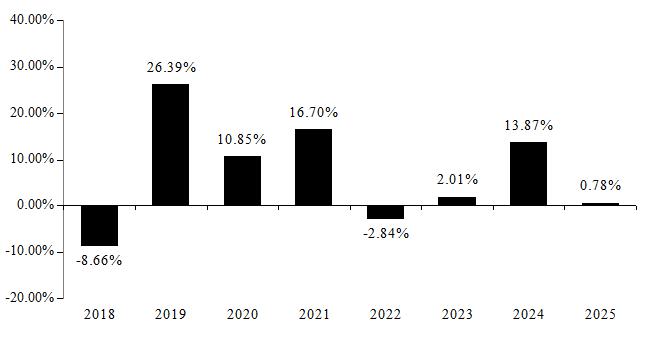
Best Quarter (ended 12/31/2022): 11.67%; Worst Quarter (ended 3/31/2020): -13.54%
| Average Annual Total Returns as of 12/31/2025 | ||||||
| 1 year | 5 year | Life of Fund (September 25, 2017) | ||||
| JNL/Mellon Consumer Staples Sector Fund (Class A) | 0.40 | % | 5.45 | % | 7.03 | % |
| Morningstar US Market Extended Index (reflects no deduction for fees, expenses, or taxes) | 17.21 | % | 13.13 | % | 14.16 | % |
| Morningstar US Consumer Defensive Index (reflects no deduction for fees, expenses, or taxes) | 1.11 | % | 6.28 | % | 8.37 | % |
| Average Annual Total Returns as of 12/31/2025 | ||||||
| 1 year | 5 year | Life of Class (September 25, 2017) | ||||
| JNL/Mellon Consumer Staples Sector Fund (Class I) | 0.78 | % | 5.83 | % | 7.40 | % |
| Morningstar US Market Extended Index (reflects no deduction for fees, expenses, or taxes) | 17.21 | % | 13.13 | % | 14.16 | % |
| Morningstar US Consumer Defensive Index (reflects no deduction for fees, expenses, or taxes) | 1.11 | % | 6.28 | % | 8.37 | % |
The performance information shown provides some indication of the risks of investing in the Fund by showing changes
in the Fund’s performance from year to year and by showing how the Fund’s average annual returns compared with those of a
broad-based securities market index and an additional index that the Adviser believes more closely reflects the market segments in which
the Fund invests. Performance results include the effect of expense waiver/reduction arrangements for some or all of the periods shown,
and if such arrangements had not been in place, performance for those periods would have been lower. The Fund’s past performance
is not necessarily an indication of how the Fund will perform in the future.
The returns shown in the bar chart and table do not include charges that will be imposed by variable insurance products. If these amounts were reflected, returns would be less than those shown.
The performance data includes the performance of the JNL/Mellon Energy Sector Fund, then a series of the JNL Variable Fund LLC, for periods before the Fund’s registration statement became effective.
Annual Total Returns as of December 31
Class A
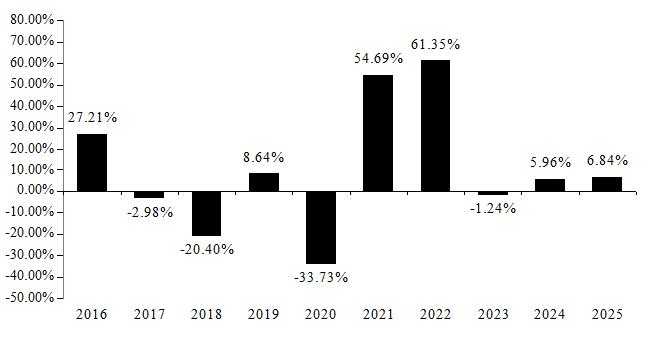
Best Quarter (ended 3/31/2022): 38.12%; Worst Quarter (ended 3/31/2020): -52.19%
Annual Total Returns as of December 31
Class I
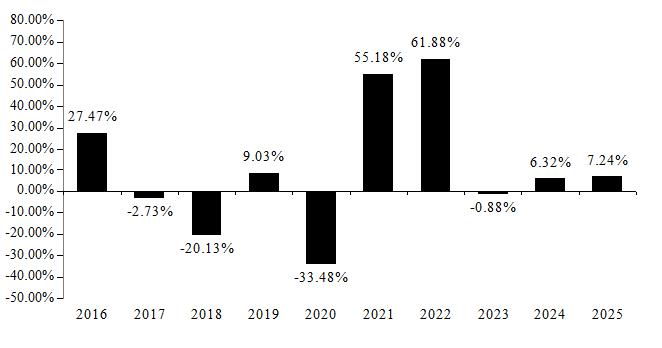
Best Quarter (ended 3/31/2022): 38.20%; Worst Quarter (ended 3/31/2020): -52.19%
| Average Annual Total Returns as of 12/31/2025 | ||||||
| 1 year | 5 year | 10 year | ||||
| JNL/Mellon Energy Sector Fund (Class A) | 6.84 | % | 22.78 | % | 7.04 | % |
| Morningstar US Market Extended Index (reflects no deduction for fees, expenses, or taxes) | 17.21 | % | 13.13 | % | 14.31 | % |
| Morningstar US Energy Index (reflects no deduction for fees, expenses, or taxes) | 7.61 | % | 23.56 | % | 7.89 | % |
| Average Annual Total Returns as of 12/31/2025 | ||||||
| 1 year | 5 year | 10 year | ||||
| JNL/Mellon Energy Sector Fund (Class I) | 7.24 | % | 23.21 | % | 7.39 | % |
| Morningstar US Market Extended Index (reflects no deduction for fees, expenses, or taxes) | 17.21 | % | 13.13 | % | 14.31 | % |
| Morningstar US Energy Index (reflects no deduction for fees, expenses, or taxes) | 7.61 | % | 23.56 | % | 7.89 | % |
The performance information shown provides some indication of the risks of investing in the Fund by showing changes
in the Fund’s performance from year to year and by showing how the Fund’s average annual returns compared with those of a
broad-based securities market index and an additional index that the Adviser believes more closely reflects the market segments in which
the Fund invests. Performance results include the effect of expense waiver/reduction arrangements for some or all of the periods shown,
and if such arrangements had not been in place, performance for those periods would have been lower. The Fund’s past performance
is not necessarily an indication of how the Fund will perform in the future.
The returns shown in the bar chart and table do not include charges that will be imposed by variable insurance products. If these amounts were reflected, returns would be less than those shown.
The performance data includes the performance of the JNL/Mellon Financial Sector Fund, then a series of the JNL Variable Fund LLC, for periods before the Fund’s registration statement became effective.
Effective April 27, 2026, the Fund was combined with JNL/Morningstar PitchBook Listed Private Equity Index Fund (“Acquired Fund”), with the Fund as the surviving Fund. The performance shown is the Fund’s historic performance and does not reflect the performance of the Acquired Fund.
Annual Total Returns as of December 31
Class A
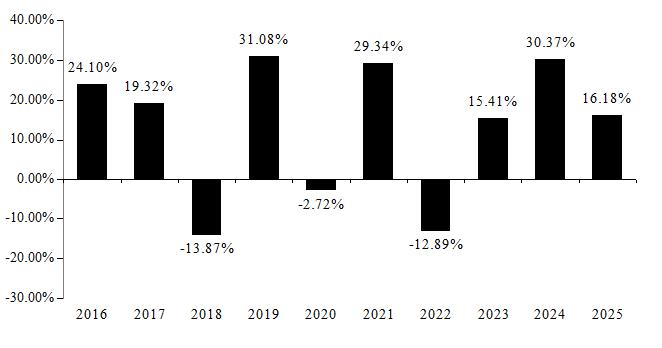
Best Quarter (ended 12/31/2020): 25.13%; Worst Quarter (ended 3/31/2020): -33.18%
Annual Total Returns as of December 31
Class I
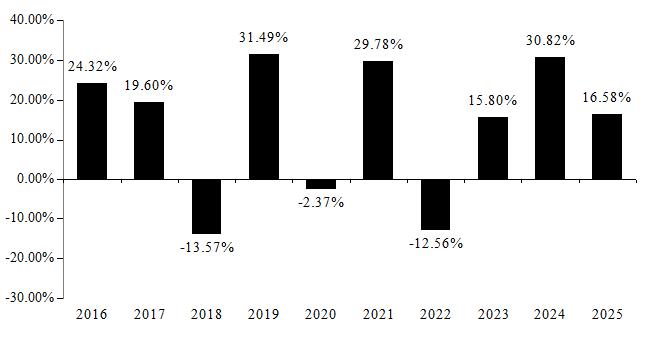
Best Quarter (ended 12/31/2020): 25.23%; Worst Quarter (ended 3/31/2020): -33.16%
| Average Annual Total Returns as of 12/31/2025 | ||||||
| 1 year | 5 year | 10 year | ||||
| JNL/Mellon Financial Sector Fund (Class A) | 16.18 | % | 14.52 | % | 12.35 | % |
| Morningstar US Market Extended Index (reflects no deduction for fees, expenses, or taxes) | 17.21 | % | 13.13 | % | 14.31 | % |
| Morningstar US Financial Services Index (reflects no deduction for fees, expenses, or taxes) | 16.86 | % | 14.74 | % | 13.91 | % |
| Average Annual Total Returns as of 12/31/2025 | ||||||
| 1 year | 5 year | 10 year | ||||
| JNL/Mellon Financial Sector Fund (Class I) | 16.58 | % | 14.92 | % | 12.70 | % |
| Morningstar US Market Extended Index (reflects no deduction for fees, expenses, or taxes) | 17.21 | % | 13.13 | % | 14.31 | % |
| Morningstar US Financial Services Index (reflects no deduction for fees, expenses, or taxes) | 16.86 | % | 14.74 | % | 13.91 | % |
The performance information shown provides some indication of the risks of investing in the Fund by showing changes in the Fund’s performance from year to year and by showing how the Fund’s average annual returns compared with those of a broad-based securities market index and an additional index that the Adviser believes more closely reflects the market segments in which the Fund invests. Performance results include the effect of expense waiver/reduction arrangements for some or all of the periods shown, and if such arrangements had not been in place, performance for those periods would have been lower. The Fund’s past performance is not necessarily an indication of how the Fund will perform in the future.
The returns shown in the bar chart and table do not include charges that will be imposed by variable insurance products. If these amounts were reflected, returns would be less than those shown.
The performance data includes the performance of the JNL/Mellon Healthcare Sector Fund, then a series of the JNL Variable Fund LLC, for periods before the Fund’s registration statement became effective.
Annual Total Returns as of December 31
Class A
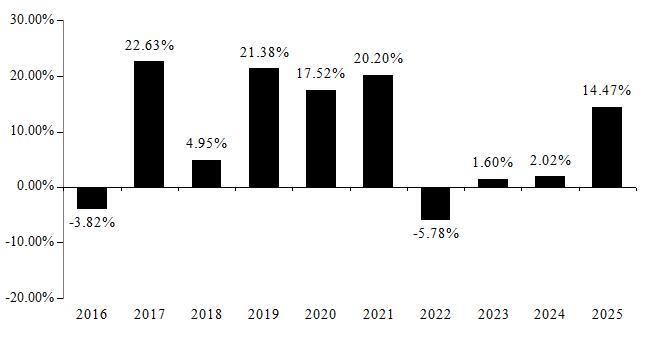
Best Quarter (ended 6/30/2020): 16.24%; Worst Quarter (ended 3/31/2020): -13.22%
Annual Total Returns as of December 31
Class I
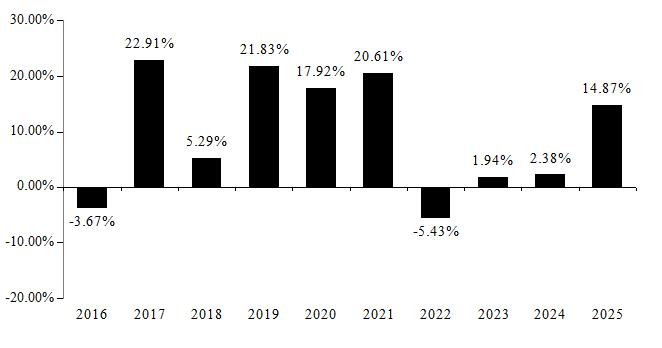
Best Quarter (ended 6/30/2020): 16.30%; Worst Quarter (ended 3/31/2020): -13.13%
| Average Annual Total Returns as of 12/31/2025 | ||||||
| 1 year | 5 year | 10 year | ||||
| JNL/Mellon Healthcare Sector Fund (Class A) | 14.47 | % | 6.09 | % | 9.03 | % |
| Morningstar US Market Extended Index (reflects no deduction for fees, expenses, or taxes) | 17.21 | % | 13.13 | % | 14.31 | % |
| Morningstar US Healthcare Index (reflects no deduction for fees, expenses, or taxes) | 15.19 | % | 6.76 | % | 9.54 | % |
| Average Annual Total Returns as of 12/31/2025 | ||||||
| 1 year | 5 year | 10 year | ||||
| JNL/Mellon Healthcare Sector Fund (Class I) | 14.87 | % | 6.46 | % | 9.37 | % |
| Morningstar US Market Extended Index (reflects no deduction for fees, expenses, or taxes) | 17.21 | % | 13.13 | % | 14.31 | % |
| Morningstar US Healthcare Index (reflects no deduction for fees, expenses, or taxes) | 15.19 | % | 6.76 | % | 9.54 | % |
The performance information shown provides some indication of the risks of investing in the Fund by showing changes
in the Fund’s performance from year to year and by showing how the Fund’s average annual returns compared with those of a
broad-based securities market index and an additional index that the Adviser believes more closely reflects the market segments in which
the Fund invests. Performance results include the effect of expense waiver/reduction arrangements for some or all of the periods shown,
and if such arrangements had not been in place, performance for those periods would have been lower. The Fund’s past performance
is not necessarily an indication of how the Fund will perform in the future.
The returns shown in the bar chart and table do not include charges that will be imposed by variable insurance products. If these amounts were reflected, returns would be less than those shown.
Annual Total Returns as of December 31
Class A
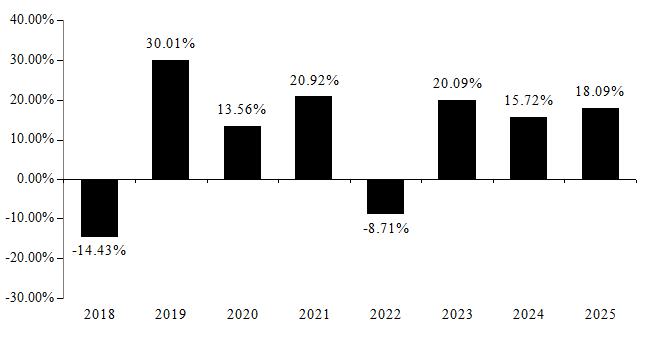
Best Quarter (ended 6/30/2020): 18.34%; Worst Quarter (ended 3/31/2020): -26.96%
Annual Total Returns as of December 31
Class I
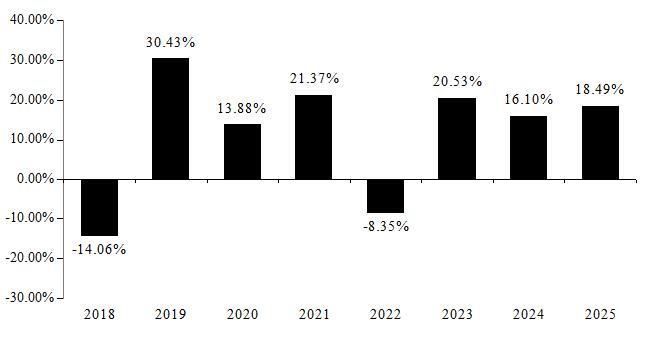
Best Quarter (ended 6/30/2020): 18.42%; Worst Quarter (ended 3/31/2020): -26.92%
| Average Annual Total Returns as of 12/31/2025 | ||||||
| 1 year | 5 year | Life of Fund (September 25, 2017) | ||||
| JNL/Mellon Industrials Sector Fund (Class A) | 18.09 | % | 12.62 | % | 11.40 | % |
| Morningstar US Market Extended Index (reflects no deduction for fees, expenses, or taxes) | 17.21 | % | 13.13 | % | 14.16 | % |
| Morningstar US Industrials Index (reflects no deduction for fees, expenses, or taxes) | 18.73 | % | 13.35 | % | 12.16 | % |
| Average Annual Total Returns as of 12/31/2025 | ||||||
| 1 year | 5 year | Life of Class (September 25, 2017) | ||||
| JNL/Mellon Industrials Sector Fund (Class I) | 18.49 | % | 13.02 | % | 11.78 | % |
| Morningstar US Market Extended Index (reflects no deduction for fees, expenses, or taxes) | 17.21 | % | 13.13 | % | 14.16 | % |
| Morningstar US Industrials Index (reflects no deduction for fees, expenses, or taxes) | 18.73 | % | 13.35 | % | 12.16 | % |
The performance information shown provides some indication of the risks of investing in the Fund by showing changes in the Fund’s performance from year to year and by showing how the Fund’s average annual returns compared with those of a broad-based securities market index and an additional index that the Adviser believes more closely reflects the market segments in which the Fund invests. Performance results include the effect of expense waiver/reduction arrangements for some or all of the periods shown, and if such arrangements had not been in place, performance for those periods would have been lower. The Fund’s past performance is not necessarily an indication of how the Fund will perform in the future.
The returns shown in the bar chart and table do not include charges that will be imposed by variable insurance products. If these amounts were reflected, returns would be less than those shown.
The performance data includes the performance of the JNL/Mellon Information Technology Sector Fund, then a series of the JNL Variable Fund LLC, for periods before the Fund’s registration statement became effective.
Annual Total Returns as of December 31
Class A
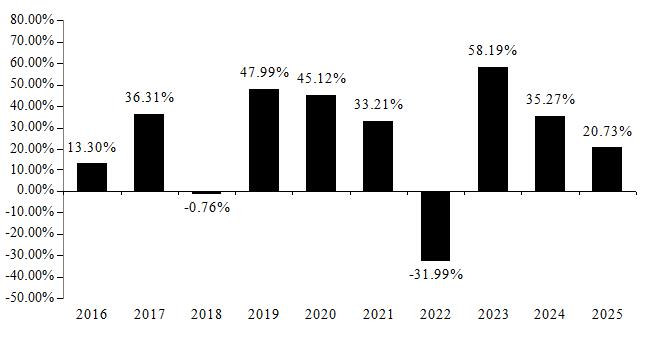
Best Quarter (ended 6/30/2020): 31.56%; Worst Quarter (ended 6/30/2022): -22.44%
Annual Total Returns as of December 31
Class I
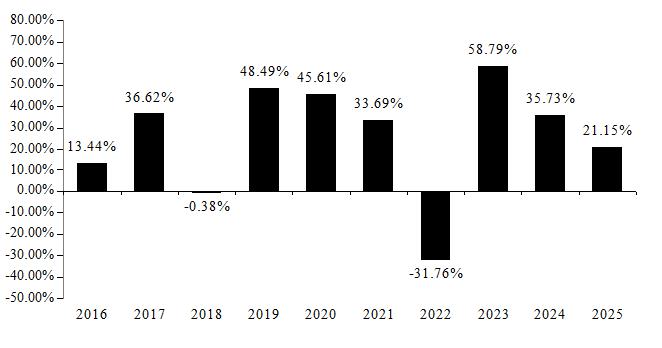
Best Quarter (ended 6/30/2020): 31.69%; Worst Quarter (ended 6/30/2022): -22.37%
| Average Annual Total Returns as of 12/31/2025 | ||||||
| 1 year | 5 year | 10 year | ||||
| JNL/Mellon Information Technology Sector Fund (Class A) | 20.73 | % | 18.54 | % | 22.65 | % |
| Morningstar US Market Extended Index (reflects no deduction for fees, expenses, or taxes) | 17.21 | % | 13.13 | % | 14.31 | % |
| Morningstar US Technology Index (reflects no deduction for fees, expenses, or taxes) | 21.43 | % | 19.33 | % | 23.29 | % |
| Average Annual Total Returns as of 12/31/2025 | ||||||
| 1 year | 5 year | 10 year | ||||
| JNL/Mellon Information Technology Sector Fund (Class I) | 21.15 | % | 18.96 | % | 23.04 | % |
| Morningstar US Market Extended Index (reflects no deduction for fees, expenses, or taxes) | 17.21 | % | 13.13 | % | 14.31 | % |
| Morningstar US Technology Index (reflects no deduction for fees, expenses, or taxes) | 21.43 | % | 19.33 | % | 23.29 | % |
The performance information shown provides some indication of the risks of investing in the Fund by showing changes
in the Fund’s performance from year to year and by showing how the Fund’s average annual returns compared with those of a
broad-based securities market index and an additional index that the Adviser believes more closely reflects the market segments in which
the Fund invests. Performance results include the effect of expense waiver/reduction arrangements for some or all of the periods shown,
and if such arrangements had not been in place, performance for those periods would have been lower. The Fund’s past performance
is not necessarily an indication of how the Fund will perform in the future.
The returns shown in the bar chart and table do not include charges that will be imposed by variable insurance products. If these amounts were reflected, returns would be less than those shown.
Annual Total Returns as of December 31
Class A
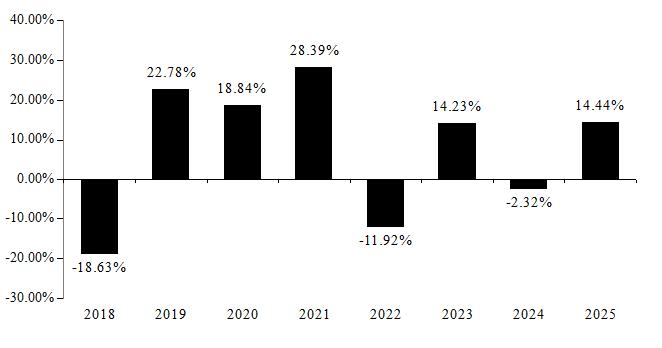
Best Quarter (ended 6/30/2020): 26.30%; Worst Quarter (ended 3/31/2020): -28.02%
Annual Total Returns as of December 31
Class I
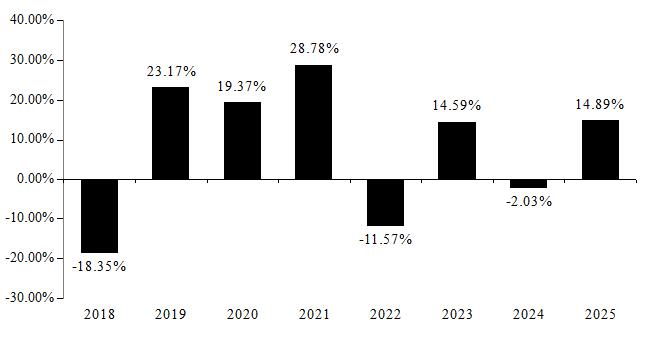
Best Quarter (ended 6/30/2020): 26.36%; Worst Quarter (ended 3/31/2020): -27.93%
| Average Annual Total Returns as of 12/31/2025 | ||||||
| 1 year | 5 year | Life of Fund (September 25, 2017) | ||||
| JNL/Mellon Materials Sector Fund (Class A) | 14.44 | % | 7.63 | % | 7.59 | % |
| Morningstar US Market Extended Index (reflects no deduction for fees, expenses, or taxes) | 17.21 | % | 13.13 | % | 14.16 | % |
| Morningstar US Basic Materials Index (reflects no deduction for fees, expenses, or taxes) | 15.30 | % | 8.49 | % | 8.74 | % |
| Average Annual Total Returns as of 12/31/2025 | ||||||
| 1 year | 5 year | Life of Class (September 25, 2017) | ||||
| JNL/Mellon Materials Sector Fund (Class I) | 14.89 | % | 7.99 | % | 7.95 | % |
| Morningstar US Market Extended Index (reflects no deduction for fees, expenses, or taxes) | 17.21 | % | 13.13 | % | 14.16 | % |
| Morningstar US Basic Materials Index (reflects no deduction for fees, expenses, or taxes) | 15.30 | % | 8.49 | % | 8.74 | % |
The performance information shown provides some indication of the risks of investing in the Fund by showing changes
in the Fund’s performance from year to year and by showing how the Fund’s average annual returns compared with those of a
broad-based securities market index and an additional index that the Adviser believes more closely reflects the market segments in which
the Fund invests. Performance results include the effect of expense waiver/reduction arrangements for some or all of the periods shown,
and if such arrangements had not been in place, performance for those periods would have been lower. The Fund’s past performance
is not necessarily an indication of how the Fund will perform in the future.
The returns shown in the bar chart and table do not include charges that will be imposed by variable insurance products. If these amounts were reflected, returns would be less than those shown.
Annual Total Returns as of December 31
Class A
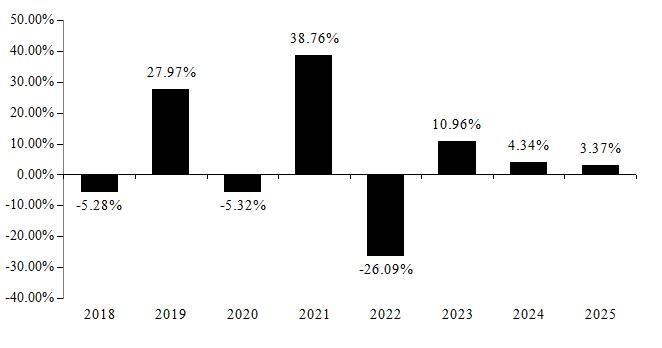
Best Quarter (ended 12/31/2023): 17.71%; Worst Quarter (ended 3/31/2020): -24.27%
Annual Total Returns as of December 31
Class I
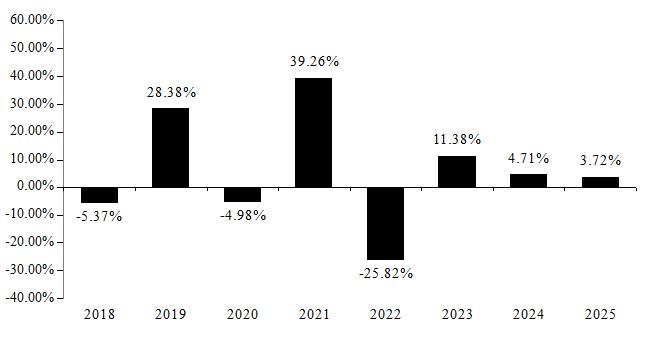
Best Quarter (ended 12/31/2023): 17.85%; Worst Quarter (ended 3/31/2020): -24.20%
| Average Annual Total Returns as of 12/31/2025 | ||||||
| 1 year | 5 year | Life of Fund (September 25, 2017) | ||||
| JNL/Mellon Real Estate Sector Fund (Class A) | 3.37 | % | 4.18 | % | 4.52 | % |
| Morningstar US Market Extended Index (reflects no deduction for fees, expenses, or taxes) | 17.21 | % | 13.13 | % | 14.16 | % |
| Morningstar US Real Estate Index (reflects no deduction for fees, expenses, or taxes) | 4.14 | % | 4.70 | % | 5.07 | % |
| Average Annual Total Returns as of 12/31/2025 | ||||||
| 1 year | 5 year | Life of Class (September 25, 2017) | ||||
| JNL/Mellon Real Estate Sector Fund (Class I) | 3.72 | % | 4.56 | % | 4.83 | % |
| Morningstar US Market Extended Index (reflects no deduction for fees, expenses, or taxes) | 17.21 | % | 13.13 | % | 14.16 | % |
| Morningstar US Real Estate Index (reflects no deduction for fees, expenses, or taxes) | 4.14 | % | 4.70 | % | 5.07 | % |
The performance information shown provides some indication of the risks of investing in the Fund by showing changes in the Fund’s performance from year to year and by showing how the Fund’s average annual returns compared with those of a broad-based securities market index. Performance results include the effect of expense waiver/reduction arrangements for some or all of the periods shown, and if such arrangements had not been in place, performance for those periods would have been lower. The Fund’s past performance is not necessarily an indication of how the Fund will perform in the future.
The returns shown in the bar chart and table do not include charges that will be imposed by variable insurance products. If these amounts were reflected, returns would be less than those shown.
Annual Total Returns as of December 31
Class I
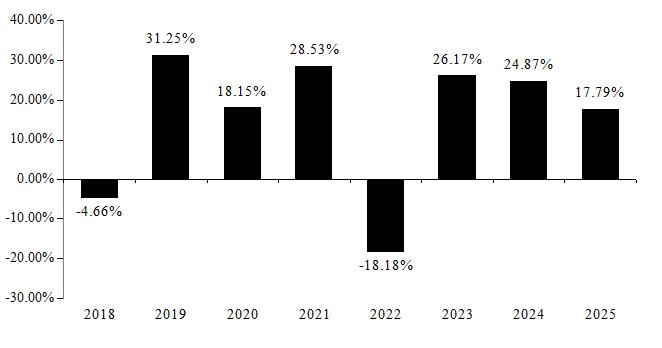
Best Quarter (ended 6/30/2020): 20.46%; Worst Quarter (ended 3/31/2020): -19.64%
| Average Annual Total Returns as of 12/31/2025 | ||||||
| 1 year | 5 year | Life
of Class (September 25, 2017) | ||||
| JNL S&P 500 Index Fund (Class I) | 17.79 | % | 14.31 | % | 14.66 | % |
| S&P 500 Index (reflects no deduction for fees, expenses, or taxes) | 17.88 | % | 14.42 | % | 14.82 | % |
The performance information shown provides some indication of the risks of investing in the Fund by showing changes
in the Fund’s performance from year to year and by showing how the Fund’s average annual returns compared with those of a
broad-based securities market index and an additional index that the Adviser believes more closely reflects the market segments in which
the Fund invests. Performance results include the effect of expense waiver/reduction arrangements for some or all of the periods shown,
and if such arrangements had not been in place, performance for those periods would have been lower. The Fund’s past performance
is not necessarily an indication of how the Fund will perform in the future.
The returns shown in the bar chart and table do not include charges that will be imposed by variable insurance products. If these amounts were reflected, returns would be less than those shown.
Annual Total Returns as of December 31
Class A
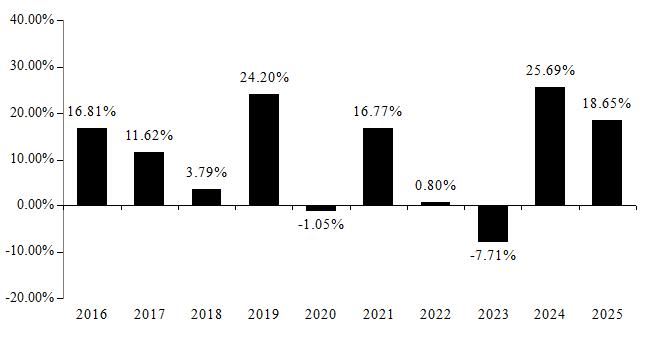
Best Quarter (ended 9/30/2024): 19.57%; Worst Quarter (ended 3/31/2020): -14.06%
Annual Total Returns as of December 31
Class I
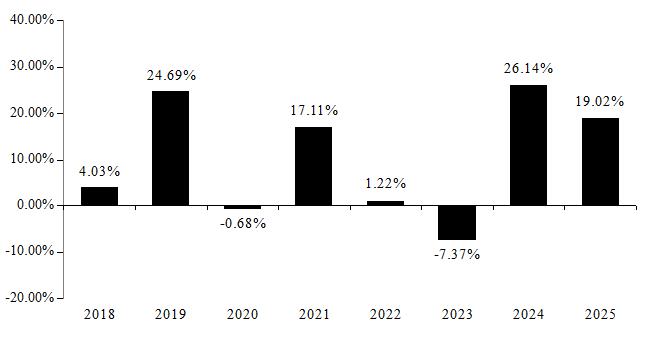
Best Quarter (ended 9/30/2024): 19.67%; Worst Quarter (ended 3/31/2020): -13.98%
| Average Annual Total Returns as of 12/31/2025 | ||||||
| 1 year | 5 year | 10 year | ||||
| JNL/Mellon Utilities Sector Fund (Class A) | 18.65 | % | 10.13 | % | 10.42 | % |
| Morningstar US Market Extended Index (reflects no deduction for fees, expenses, or taxes) | 17.21 | % | 13.13 | % | 14.31 | % |
| Morningstar US Utilities Index (reflects no deduction for fees, expenses, or taxes) | 19.43 | % | 10.90 | % | 11.11 | % |
| Average Annual Total Returns as of 12/31/2025 | ||||||
| 1 year | 5 year | Life
of Class (September 25, 2017) | ||||
| JNL/Mellon Utilities Sector Fund (Class I) | 19.02 | % | 10.51 | % | 9.56 | % |
| Morningstar US Market Extended Index (reflects no deduction for fees, expenses, or taxes) | 17.21 | % | 13.13 | % | 14.16 | % |
| Morningstar US Utilities Index (reflects no deduction for fees, expenses, or taxes) | 19.43 | % | 10.90 | % | 9.93 | % |
The performance information shown provides some indication of the risks of investing in the Fund by showing changes
in the Fund’s performance from year to year and by showing how the Fund’s average annual returns compared with those of a
broad-based securities market index and an additional index that the Adviser believes more closely reflects the market segments in which
the Fund invests. Performance prior to April 27, 2026 reflects the Fund’s results when managed by the former Sub-Adviser, Invesco Advisers,
Inc. The Fund’s past performance is not necessarily an indication of how the Fund will perform in the future.
The returns shown in the bar chart and table do not include charges that will be imposed by variable insurance products. If these amounts were reflected, returns would be less than those shown.
Annual Total Returns as of December 31
Class A
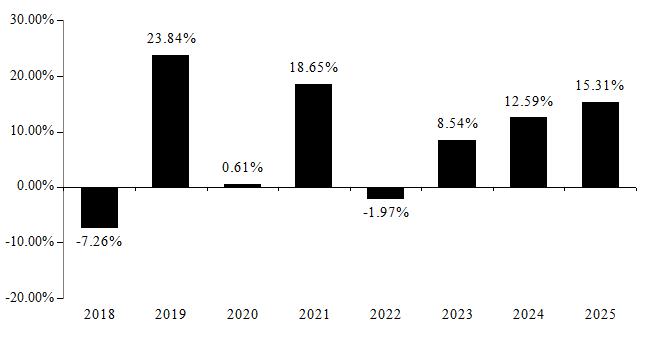
Best Quarter (ended 12/31/2020): 13.86%; Worst Quarter (ended 3/31/2020): -23.81%
Annual Total Returns as of December 31
Class I
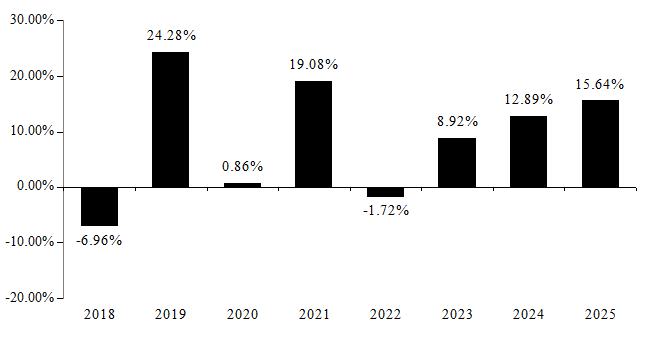
Best Quarter (ended 12/31/2020): 13.94%; Worst Quarter (ended 3/31/2020): -23.81%
| Average Annual Total Returns as of 12/31/2025 | ||||||
| 1 year | 5 year | Life
of Fund (September 25, 2017) | ||||
| JNL/MFS Equity Income Fund (Class A) | 15.31 | % | 10.39 | % | 8.46 | % |
| S&P 500 Index (reflects no deduction for fees, expenses, or taxes) | 17.88 | % | 14.42 | % | 14.82 | % |
| Morningstar US Large-Mid Cap Broad Value Index (reflects no deduction for fees, expenses, or taxes) | 18.83 | % | 13.38 | % | 11.80 | % |
| Average Annual Total Returns as of 12/31/2025 | ||||||
| 1 year | 5 year | Life
of Class (September 25, 2017) | ||||
| JNL/MFS Equity Income Fund (Class I) | 15.64 | % | 10.72 | % | 8.79 | % |
| S&P 500 Index (reflects no deduction for fees, expenses, or taxes) | 17.88 | % | 14.42 | % | 14.82 | % |
| Morningstar US Large-Mid Cap Broad Value Index (reflects no deduction for fees, expenses, or taxes) | 18.83 | % | 13.38 | % | 11.80 | % |
The performance information shown provides some indication of the risks of investing in the Fund by showing changes in the Fund’s performance from year to year and by showing how the Fund’s average annual returns compared with those of a broad-based securities market index and an additional index that the Adviser believes more closely reflects the market segments in which the Fund invests. Performance prior to April 24, 2017, reflects the Fund’s results when managed by the former sub-adviser, Goldman Sachs Assets Management, L.P. Performance results include the effect of expense waiver/reduction arrangements for some or all of the periods shown. If such arrangements had not been in place, performance for those periods would have been lower. The Fund’s past performance is not necessarily an indication of how the Fund will perform in the future.
The returns shown in the bar chart and table do not include charges that will be imposed by variable insurance products. If these amounts were reflected, returns would be less than those shown.
Effective August 13, 2018, the Fund was combined with JNL/Invesco Mid Cap Value Fund with the Fund as the surviving Fund. The performance shown is the Fund’s historic performance and does not reflect the performance of the JNL/Invesco Mid Cap Value Fund.
Effective April 27, 2020, the Fund was combined with JNL/PPM America Mid Cap Value Fund, with the Fund as the surviving Fund. The performance shown is the Fund’s historic performance and does not reflect the performance of the JNL/PPM America Mid Cap Value Fund.
Annual Total Returns as of December 31
Class A
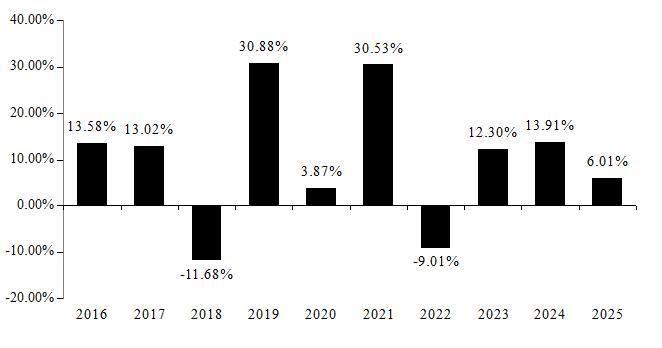
Best Quarter (ended 6/30/2020): 19.87%; Worst Quarter (ended 3/31/2020): -31.26%
Annual Total Returns as of December 31
Class I
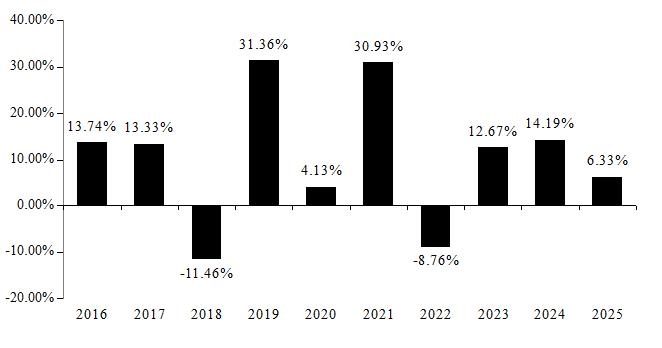
Best Quarter (ended 6/30/2020): 19.87%; Worst Quarter (ended 3/31/2020): -31.23%
| Average Annual Total Returns as of 12/31/2025 | ||||||
| 1 year | 5 year | 10 year | ||||
| JNL/MFS Mid Cap Value Fund (Class A) | 6.01 | % | 10.00 | % | 9.52 | % |
| Morningstar US Market Extended Index (reflects no deduction for fees, expenses, or taxes) | 17.21 | % | 13.13 | % | 14.31 | % |
| Morningstar US Mid Cap Broad Value Index (reflects no deduction for fees, expenses, or taxes) | 13.39 | % | 11.45 | % | 10.79 | % |
| Average Annual Total Returns as of 12/31/2025 | ||||||
| 1 year | 5 year | 10 year | ||||
| JNL/MFS Mid Cap Value Fund (Class I) | 6.33 | % | 10.33 | % | 9.82 | % |
| Morningstar US Market Extended Index (reflects no deduction for fees, expenses, or taxes) | 17.21 | % | 13.13 | % | 14.31 | % |
| Morningstar US Mid Cap Broad Value Index (reflects no deduction for fees, expenses, or taxes) | 13.39 | % | 11.45 | % | 10.79 | % |
The performance information shown provides some indication of the risks of investing in the Fund by showing changes in the Fund’s performance from year to year and by showing how the Fund’s average annual returns compared with those of broad-based securities market indices and additional indices that the Adviser believes more closely reflects the market segments in which the Fund invests. The Fund’s past performance is not necessarily an indication of how the Fund will perform in the future.
The returns shown in the bar chart and table do not include charges that will be imposed by variable insurance products. If these amounts were reflected, returns would be less than those shown.
Consistent with the Fund’s principal investment strategies, the Fund uses the Morningstar® U.S. Small-Mid Cap Index as the Fund’s tertiary benchmark.
Annual Total Returns as of December 31
Class A
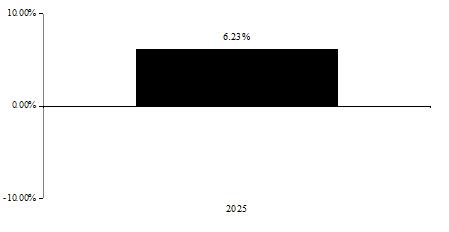
Best Quarter (ended 6/30/2025): 6.06%; Worst Quarter (ended 3/31/2025): -4.93%
Annual Total Returns as of December 31
Class I
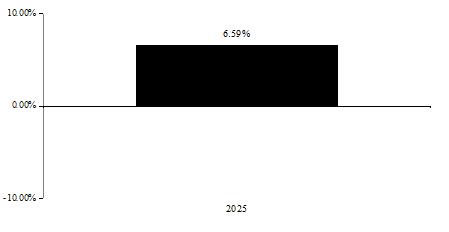
Best Quarter (ended 6/30/2025): 6.14%; Worst Quarter (ended 3/31/2025): -4.82%
| Average Annual Total Returns as of 12/31/2025 | ||||
| 1 year | Life
of Fund (April 29, 2024) | |||
| JNL/Morningstar SMID Moat Focus Index Fund (Class A) | 6.23 | % | 8.30 | % |
| Morningstar US Market Extended Index (reflects no deduction for fees, expenses, or taxes) | 17.21 | % | 20.18 | % |
| Morningstar US Small-Mid Moat Focus Index (reflects no deduction for fees, expenses, or taxes) | 7.06 | % | 9.50 | % |
| Morningstar US SMID TR USD (reflects no deduction for fees, expenses, or taxes) | 10.70 | % | 12.78 | % |
| Average Annual Total Returns as of 12/31/2025 | ||||
| 1 year | Life
of Class (April 29, 2024) | |||
| JNL/Morningstar SMID Moat Focus Index Fund (Class I) | 6.59 | % | 8.64 | % |
| Morningstar US Market Extended Index (reflects no deduction for fees, expenses, or taxes) | 17.21 | % | 20.18 | % |
| Morningstar US Small-Mid Moat Focus Index (reflects no deduction for fees, expenses, or taxes) | 7.06 | % | 9.50 | % |
| Morningstar US SMID TR USD (reflects no deduction for fees, expenses, or taxes) | 10.70 | % | 12.78 | % |
The performance information shown provides some indication of the risks of investing in the Fund by showing changes in the Fund’s performance from year to year and by showing how the Fund’s average annual returns compared with those of a broad-based securities market index and additional indices that the Adviser believes more closely reflects the market segments in which the Fund invests. Performance results include the effect of expense waiver/reduction arrangements for some or all of the periods shown, and if such arrangements had not been in place, performance for those periods would have been lower. The Fund’s past performance is not necessarily an indication of how the Fund will perform in the future.
The returns shown in the bar chart and table do not include charges that will be imposed by variable insurance products. If these amounts were reflected, returns would be less than those shown.
Consistent with the Fund’s principal investment strategies, the Fund uses the Morningstar® US Large-Mid Cap Index as the Fund’s tertiary benchmark.
Annual Total Returns as of December 31
Class A
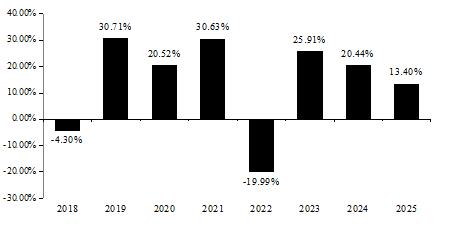
Best Quarter (ended 6/30/2020): 21.40%; Worst Quarter (ended 3/31/2020): -18.35%
Annual Total Returns as of December 31
Class I
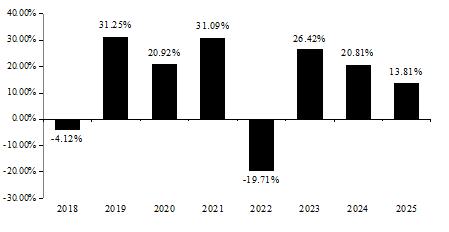
Best Quarter (ended 6/30/2020): 21.54%; Worst Quarter (ended 3/31/2020): -18.25%
| Average Annual Total Returns as of 12/31/2025 | ||||||
| 1 year | 5 year | Life
of Fund (April 24, 2017) | ||||
| JNL/Morningstar U.S. Sustainability Index Fund (Class A) | 13.40 | % | 12.44 | % | 13.74 | % |
| Morningstar US Target Market Exposure Index (reflects no deduction for fees, expenses, or taxes) | 17.80 | % | 13.88 | % | 14.96 | % |
| Morningstar US Sustainability Index (reflects no deduction for fees, expenses, or taxes) | 14.22 | % | 12.94 | % | 14.12 | % |
| Morningstar US Large-Mid Cap Index (reflects no deduction for fees, expenses, or taxes) | 17.71 | % | 13.71 | % | 14.86 | % |
| Average Annual Total Returns as of 12/31/2025 | ||||||
| 1 year | 5 year | Life
of Class (September 25, 2017) | ||||
| JNL/Morningstar U.S. Sustainability Index Fund (Class I) | 13.81 | % | 12.84 | % | 14.06 | % |
| Morningstar US Target Market Exposure Index (reflects no deduction for fees, expenses, or taxes) | 17.80 | % | 13.88 | % | 14.76 | % |
| Morningstar US Sustainability Index (reflects no deduction for fees, expenses, or taxes) | 14.22 | % | 12.94 | % | 13.93 | % |
| Morningstar US Large-Mid Cap Index (reflects no deduction for fees, expenses, or taxes) | 17.71 | % | 13.71 | % | 14.68 | % |
The performance information shown provides some indication of the risks of investing in the Fund by showing changes in the Fund’s performance from year to year and by showing how the Fund’s average annual returns compared with those of a broad-based securities market index and an additional index that the Adviser believes more closely reflects the market segments in which the Fund invests. The Fund’s past performance is not necessarily an indication of how the Fund will perform in the future.
The returns shown in the bar chart and table do not include charges that will be imposed by variable insurance products. If these amounts were reflected, returns would be less than those shown.
Effective April 27, 2020, the Fund was combined with the JNL/The London Company Focused U.S. Equity Fund (the "Acquired Fund"), a series of Jackson Variable Series Trust, with the Fund as the surviving Fund. The performance shown is the Fund's historic performance and does not reflect the performance of the Acquired Fund.
Annual Total Returns as of December 31
Class A
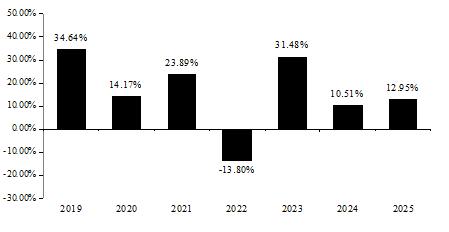
Best Quarter (ended 6/30/2020): 19.07%; Worst Quarter (ended 3/31/2020): -20.21%
Annual Total Returns as of December 31
Class I
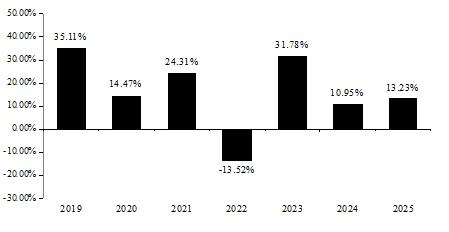
Best Quarter (ended 6/30/2020): 19.08%; Worst Quarter (ended 3/31/2020): -20.13%
| Average Annual Total Returns as of 12/31/2025 | ||||||
| 1 year | 5 year | Life
of Fund (August 13, 2018) | ||||
| JNL/Morningstar Wide Moat Index Fund (Class A) | 12.95 | % | 11.88 | % | 13.21 | % |
| S&P 500 Index (reflects no deduction for fees, expenses, or taxes) | 17.88 | % | 14.42 | % | 14.53 | % |
| Morningstar Wide Moat Focus Index (reflects no deduction for fees, expenses, or taxes) | 13.80 | % | 12.71 | % | 14.06 | % |
| Average Annual Total Returns as of 12/31/2025 | ||||||
| 1 year | 5 year | Life
of Class (August 13, 2018) | ||||
| JNL/Morningstar Wide Moat Index Fund (Class I) | 13.23 | % | 12.22 | % | 13.55 | % |
| S&P 500 Index (reflects no deduction for fees, expenses, or taxes) | 17.88 | % | 14.42 | % | 14.53 | % |
| Morningstar Wide Moat Focus Index (reflects no deduction for fees, expenses, or taxes) | 13.80 | % | 12.71 | % | 14.06 | % |
The performance information shown provides some indication of the risks of investing in the Fund by showing changes in the Fund’s performance from year to year and by showing how the Fund’s average annual returns compared with those of a broad-based securities market index and an additional index that the Adviser believes more closely reflects the market segments in which the Fund invests. The Fund’s past performance is not necessarily an indication of how the Fund will perform in the future.
The returns shown in the bar chart and table do not include charges that will be imposed by variable insurance products. If these amounts were reflected, returns would be less than those shown.
The performance data includes the performance of the JNL/Neuberger Berman Commodity Strategy Fund, then a series of the Jackson Variable Series Trust, for periods before the Fund's registration statement became effective.
Annual Total Returns as of December 31
Class A
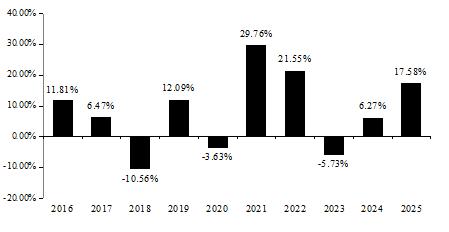
Best Quarter (ended 3/31/2022): 25.83%; Worst Quarter (ended 3/31/2020): -29.31%
Annual Total Returns as of December 31
Class I
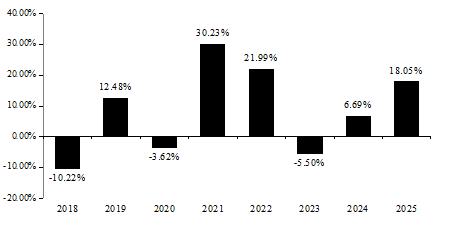
Best Quarter (ended 3/31/2022): 25.96%; Worst Quarter (ended 3/31/2020): -29.23%
| Average Annual Total Returns as of 12/31/2025 | ||||||
| 1 year | 5 year | 10 year | ||||
| JNL/Neuberger Berman Commodity Strategy Fund (Class A) | 17.58 | % | 13.19 | % | 7.89 | % |
| Morningstar Global Target Market Exposure Index (Net) (reflects no deduction for fees, expenses, or taxes) | 22.23 | % | 11.20 | % | 11.70 | % |
| Bloomberg Commodity Index (reflects no deduction for fees, expenses, or taxes) | 15.77 | % | 10.64 | % | 5.73 | % |
| Average Annual Total Returns as of 12/31/2025 | ||||||
| 1 year | 5 year | Life
of Class (September 25, 2017) | ||||
| JNL/Neuberger Berman Commodity Strategy Fund (Class I) | 18.05 | % | 13.59 | % | 8.32 | % |
| Morningstar Global Target Market Exposure Index (Net) (reflects no deduction for fees, expenses, or taxes) | 22.23 | % | 11.20 | % | 11.15 | % |
| Bloomberg Commodity Index (reflects no deduction for fees, expenses, or taxes) | 15.77 | % | 10.64 | % | 5.85 | % |
The performance information shown provides some indication of the risks of investing in the Fund by showing changes in the Fund’s performance from year to year and by showing how the Fund’s average annual returns compared with those of a broad-based securities market index and an additional index that the Adviser believes more closely reflects the market segments in which the Fund invests. The Fund’s past performance is not necessarily an indication of how the Fund will perform in the future.
The returns shown in the bar chart and table do not include charges that will be imposed by variable insurance products. If these amounts were reflected, returns would be less than those shown.
Annual Total Returns as of December 31
Class A
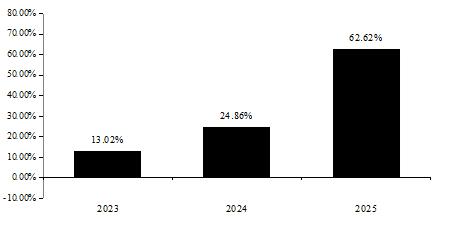
Best Quarter (ended 3/31/2025): 16.86%; Worst Quarter (ended 9/30/2023): -4.10%
Annual Total Returns as of December 31
Class I
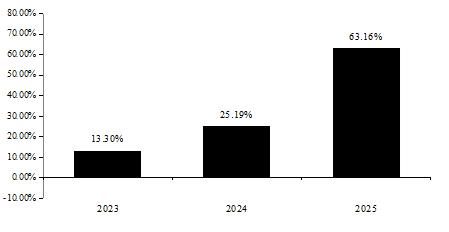
Best Quarter (ended 3/31/2025): 16.94%; Worst Quarter (ended 9/30/2023): -3.98%
| Average Annual Total Returns as of 12/31/2025 | ||||
| 1 year | Life
of Fund (April 25, 2022) | |||
| JNL/Neuberger Berman Gold Plus Strategy Fund (Class A) | 62.62 | % | 22.79 | % |
| Morningstar Global Target Market Exposure Index (Net) (reflects no deduction for fees, expenses, or taxes) | 22.23 | % | 13.59 | % |
| Bloomberg Gold Subindex (reflects no deduction for fees, expenses, or taxes) | 62.46 | % | 23.57 | % |
| Average Annual Total Returns as of 12/31/2025 | ||||
| 1 year | Life
of Class (April 25, 2022) | |||
| JNL/Neuberger Berman Gold Plus Strategy Fund (Class I) | 63.16 | % | 23.18 | % |
| Morningstar Global Target Market Exposure Index (Net) (reflects no deduction for fees, expenses, or taxes) | 22.23 | % | 13.59 | % |
| Bloomberg Gold Subindex (reflects no deduction for fees, expenses, or taxes) | 62.46 | % | 23.57 | % |
The performance information shown provides some indication of the risks of investing in the Fund by showing changes in the Fund’s performance from year to year and by showing how the Fund’s average annual returns compared with those of a broad-based securities market index. The Fund’s past performance is not necessarily an indication of how the Fund will perform in the future.
The returns shown in the bar chart and table do not include charges that will be imposed by variable insurance products. If these amounts were reflected, returns would be less than those shown.
Effective April 28, 2025, the Fund was combined with the JNL/Western Asset Global Multi-Sector Bond Fund (“Acquired Fund”), with the Fund as the surviving Fund. The performance shown is the Fund’s historical performance and does not reflect the performance of the Acquired Fund.
Effective April 27, 2026, the Fund was combined with JNL/American Funds Capital World Bond Fund (“Acquired Fund”), with the Fund as the surviving Fund. The performance shown is the Fund’s historic performance and does not reflect the performance of the Acquired Fund.
Annual Total Returns as of December 31
Class A
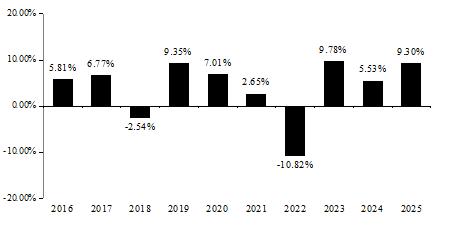
Best Quarter (ended 6/30/2020): 10.34%; Worst Quarter (ended 3/31/2020): -9.94%
Annual Total Returns as of December 31
Class I
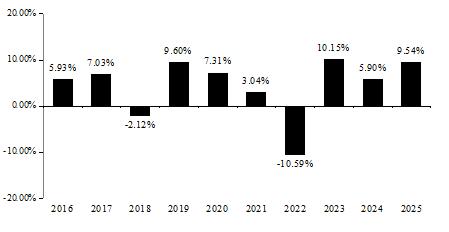
Best Quarter (ended 6/30/2020): 10.45%; Worst Quarter (ended 3/31/2020): -9.86%
| Average Annual Total Returns as of 12/31/2025 | ||||||
| 1 year | 5 year | 10 year | ||||
| JNL/Neuberger Berman Strategic Income Fund (Class A) | 9.30 | % | 3.00 | % | 4.09 | % |
| Bloomberg U.S. Aggregate Index (reflects no deduction for fees, expenses, or taxes) | 7.30 | % | -0.36 | % | 2.01 | % |
| Average Annual Total Returns as of 12/31/2025 | ||||||
| 1 year | 5 year | 10 year | ||||
| JNL/Neuberger Berman Strategic Income Fund (Class I) | 9.54 | % | 3.32 | % | 4.39 | % |
| Bloomberg U.S. Aggregate Index (reflects no deduction for fees, expenses, or taxes) | 7.30 | % | -0.36 | % | 2.01 | % |
The performance information shown provides some indication of the risks of investing in the Fund by showing changes in the Fund’s performance from year to year and by showing how the Fund’s average annual returns compared with those of a broad-based securities market index and an additional index that the Adviser believes more closely reflects the market segments in which the Fund invests. Performance results include the effect of expense waiver/reduction arrangements for some or all of the periods shown. If such arrangements had not been in place, performance for those periods would have been lower. The Fund’s past performance is not necessarily an indication of how the Fund will perform in the future.
The returns shown in the bar chart and table do not include charges that will be imposed by variable insurance products. If these amounts were reflected, returns would be less than those shown.
Effective June 24, 2019, the Fund was combined with JNL/Epoch Global Shareholder Yield Fund (the “Acquired Fund”), with the Fund as the surviving Fund. The performance shown is the Fund's historic performance and does not reflect the performance of the Acquired Fund.
The performance data includes the performance of the JNL/Mellon Equity Income Fund, then a series of the Jackson Variable Series Trust, for periods before the Fund’s registration statement became effective.
Annual Total Returns as of December 31
Class A
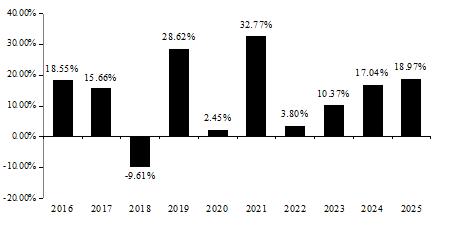
Best Quarter (ended 12/31/2020): 20.63%; Worst Quarter (ended 3/31/2020): -31.23%
Annual Total Returns as of December 31
Class I
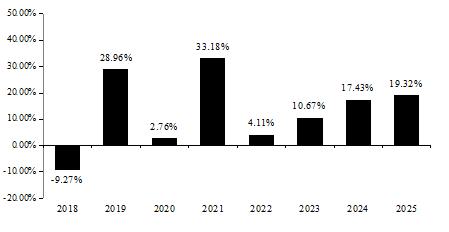
Best Quarter (ended 12/31/2020): 20.72%; Worst Quarter (ended 3/31/2020): -31.17%
| Average Annual Total Returns as of 12/31/2025 | ||||||
| 1 year | 5 year | 10 year | ||||
| JNL/Newton Equity Income Fund (Class A) | 18.97 | % | 16.19 | % | 13.21 | % |
| Morningstar US Target Market Exposure Index (reflects no deduction for fees, expenses, or taxes) | 17.80 | % | 13.88 | % | 14.77 | % |
| Morningstar US Large-Mid Cap Broad Value Index (reflects no deduction for fees, expenses, or taxes) | 18.83 | % | 13.38 | % | 12.50 | % |
| Average Annual Total Returns as of 12/31/2025 | ||||||
| 1 year | 5 year | Life
of Class (September 25, 2017) | ||||
| JNL/Newton Equity Income Fund (Class I) | 19.32 | % | 16.54 | % | 13.31 | % |
| Morningstar US Target Market Exposure Index (reflects no deduction for fees, expenses, or taxes) | 17.80 | % | 13.88 | % | 14.76 | % |
| Morningstar US Large-Mid Cap Broad Value Index (reflects no deduction for fees, expenses, or taxes) | 18.83 | % | 13.38 | % | 11.80 | % |
The performance information shown provides some indication of the risks of investing in the Fund by showing changes in the Fund’s performance from year to year and by showing how the Fund’s average annual returns compared with those of a broad-based securities market index. The Fund’s past performance is not necessarily an indication of how the Fund will perform in the future.
The returns shown in the bar chart and table do not include charges that will be imposed by variable insurance products. If these amounts were reflected, returns would be less than those shown.
Effective April 27, 2020, the Fund was combined with JNL/Neuberger Berman Currency Fund, a series of Jackson Variable Series Trust, with the Fund as the surviving Fund. The performance shown is the Fund's historic performance and does not reflect the performance of the JNL/Neuberger Berman Currency Fund.
Effective April 27, 2020, the Fund was combined with JNL/Scout Unconstrained Bond Fund, with the Fund as the surviving Fund. The performance shown is the Fund's historic performance and does not reflect the performance of the JNL/Scout Unconstrained Bond Fund.
Annual Total Returns as of December 31
Class A
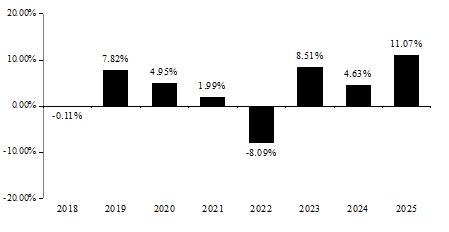
Best Quarter (ended 12/31/2023): 6.45%; Worst Quarter (ended 3/31/2020): -6.28%
Annual Total Returns as of December 31
Class I
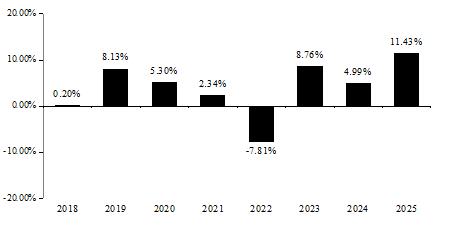
Best Quarter (ended 12/31/2023): 6.53%; Worst Quarter (ended 3/31/2020): -6.24%
| Average Annual Total Returns as of 12/31/2025 | ||||||
| 1 year | 5 year | Life
of Fund (September 25, 2017) | ||||
| JNL/PIMCO Income Fund (Class A) | 11.07 | % | 3.40 | % | 3.66 | % |
| Bloomberg U.S. Aggregate Index (reflects no deduction for fees, expenses, or taxes) | 7.30 | % | -0.36 | % | 1.72 | % |
| Average Annual Total Returns as of 12/31/2025 | ||||||
| 1 year | 5 year | Life
of Class (September 25, 2017) | ||||
| JNL/PIMCO Income Fund (Class I) | 11.43 | % | 3.72 | % | 3.98 | % |
| Bloomberg U.S. Aggregate Index (reflects no deduction for fees, expenses, or taxes) | 7.30 | % | -0.36 | % | 1.72 | % |
The performance information shown provides some indication of the risks of investing in the Fund by showing changes in the Fund’s performance from year to year and by showing how the Fund’s average annual returns compared with those of a broad-based securities market index and an additional index that the Adviser believes more closely reflects the market segments in which the Fund invests. The Fund’s past performance is not necessarily an indication of how the Fund will perform in the future.
The returns shown in the bar chart and table do not include charges that will be imposed by variable insurance products. If these amounts were reflected, returns would be less than those shown.
The performance data includes the performance of the JNL/PIMCO Investment Grade Credit Bond Fund, then a series of the Jackson Variable Series Trust, for periods before the Fund's registration statement became effective.
Annual Total Returns as of December 31
Class A
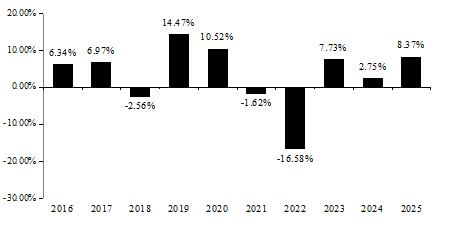
Best Quarter (ended 6/30/2020): 8.39%; Worst Quarter (ended 6/30/2022): -8.24%
Annual Total Returns as of December 31
Class I
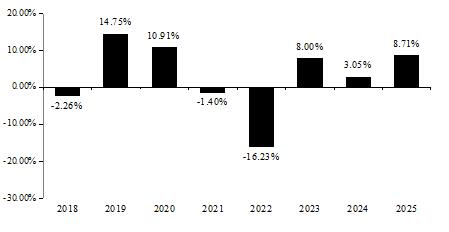
Best Quarter (ended 6/30/2020): 8.54%; Worst Quarter (ended 6/30/2022): -8.17%
| Average Annual Total Returns as of 12/31/2025 | ||||||
| 1 year | 5 year | 10 year | ||||
| JNL/PIMCO Investment Grade Credit Bond Fund (Class A) | 8.37 | % | -0.31 | % | 3.28 | % |
| Bloomberg U.S. Aggregate Index (reflects no deduction for fees, expenses, or taxes) | 7.30 | % | -0.36 | % | 2.01 | % |
| Bloomberg U.S. Credit Index (reflects no deduction for fees, expenses, or taxes) | 7.83 | % | -0.05 | % | 3.15 | % |
| Average Annual Total Returns as of 12/31/2025 | ||||||
| 1 year | 5 year | Life
of Class (September 25, 2017) | ||||
| JNL/PIMCO Investment Grade Credit Bond Fund (Class I) | 8.71 | % | -0.01 | % | 2.74 | % |
| Bloomberg U.S. Aggregate Index (reflects no deduction for fees, expenses, or taxes) | 7.30 | % | -0.36 | % | 1.72 | % |
| Bloomberg U.S. Credit Index (reflects no deduction for fees, expenses, or taxes) | 7.83 | % | -0.05 | % | 2.52 | % |
The performance information shown provides some indication of the risks of investing in the Fund by showing changes in the Fund’s performance from year to year and by showing how the Fund’s average annual returns compared with those of a broad-based securities market index and an additional index that the Adviser believes more closely reflects the market segments in which the Fund invests. Performance results include the effect of expense waiver/reduction arrangements for some or all of the periods shown. If such arrangements had not been in place, performance for those periods would have been lower. The Fund’s past performance is not necessarily an indication of how the Fund will perform in the future.
The returns shown in the bar chart and table do not include charges that will be imposed by variable insurance products. If these amounts were reflected, returns would be less than those shown.
Effective August 13, 2018, the Fund was combined with JNL Real Assets Fund ("Acquired Fund"), a series of Jackson Variable Series Trust, with the Fund as the surviving Fund. The performance shown is the Fund's historic performance and does not reflect the performance of the Acquired Fund.
Annual Total Returns as of December 31
Class A
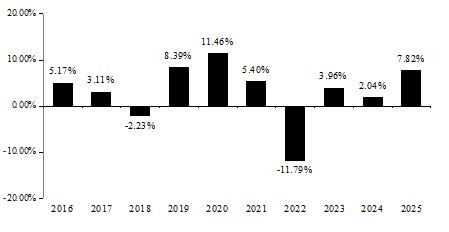
Best Quarter (ended 6/30/2020): 5.64%; Worst Quarter (ended 6/30/2022): -6.27%
Annual Total Returns as of December 31
Class I
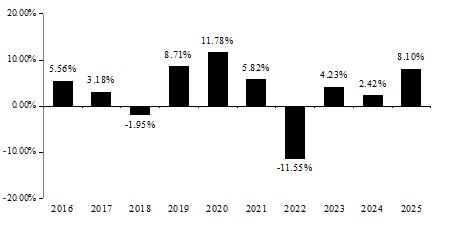
Best Quarter (ended 6/30/2020): 5.74%; Worst Quarter (ended 6/30/2022): -6.14%
| Average Annual Total Returns as of 12/31/2025 | ||||||
| 1 year | 5 year | 10 year | ||||
| JNL/PIMCO Real Return Fund (Class A) | 7.82 | % | 1.24 | % | 3.14 | % |
| Bloomberg U.S. Aggregate Index (reflects no deduction for fees, expenses, or taxes) | 7.30 | % | -0.36 | % | 2.01 | % |
| Bloomberg U.S. Treasury: U.S. TIPS Index (reflects no deduction for fees, expenses, or taxes) | 7.01 | % | 1.13 | % | 3.09 | % |
| Average Annual Total Returns as of 12/31/2025 | ||||||
| 1 year | 5 year | 10 year | ||||
| JNL/PIMCO Real Return Fund (Class I) | 8.10 | % | 1.55 | % | 3.43 | % |
| Bloomberg U.S. Aggregate Index (reflects no deduction for fees, expenses, or taxes) | 7.30 | % | -0.36 | % | 2.01 | % |
| Bloomberg U.S. Treasury: U.S. TIPS Index (reflects no deduction for fees, expenses, or taxes) | 7.01 | % | 1.13 | % | 3.09 | % |
Performance for the Fund has not been included because the Fund commenced operations on the date of this Prospectus. Performance, which provides some indication of the risks of investing in the Fund, will be available once the Fund has completed one full calendar year of operations.
The performance information shown provides some indication of the risks of investing in the Fund by showing changes in the Fund’s performance from year to year and by showing how the Fund’s average annual returns compared with those of a broad-based securities market index and an additional index that the Adviser believes more closely reflects the market segments in which the Fund invests. The Fund’s past performance is not necessarily an indication of how the Fund will perform in the future.
The returns shown in the bar chart and table do not include charges that will be imposed by variable insurance products. If these amounts were reflected, returns would be less than those shown.
Effective June 24, 2019, the Fund was combined with JNL/PPM America Long Short Credit Fund (“Acquired Fund”), a series of Jackson Variable Series Trust, with the Fund as the surviving Fund. The performance shown is the Fund's historic performance and does not reflect the performance of the Acquired Fund.
Effective April 27, 2026, the Fund was combined with JNL/T. Rowe Price U.S. High Yield Fund (“Acquired Fund”), with the Fund as the surviving Fund. The performance shown is the Fund's historic performance and does not reflect the performance of the Acquired Fund.
Annual Total Returns as of December 31
Class A
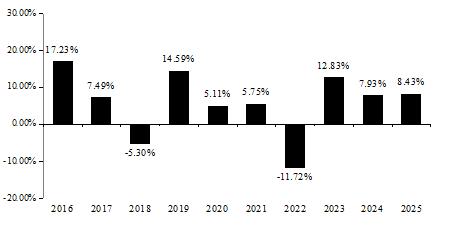
Best Quarter (ended 6/30/2020): 8.58%; Worst Quarter (ended 3/31/2020): -13.60%
Annual Total Returns as of December 31
Class I
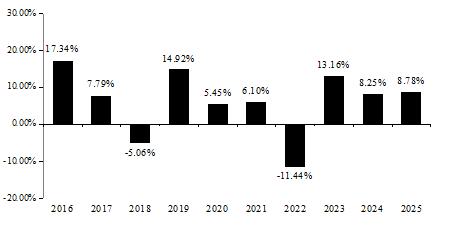
Best Quarter (ended 6/30/2020): 8.56%; Worst Quarter (ended 3/31/2020): -13.47%
| Average Annual Total Returns as of 12/31/2025 | ||||||
| 1 year | 5 year | 10 year | ||||
| JNL/PPM America High Yield Bond Fund (Class A) | 8.43 | % | 4.27 | % | 5.89 | % |
| Bloomberg U.S. Aggregate Index (reflects no deduction for fees, expenses, or taxes) | 7.30 | % | -0.36 | % | 2.01 | % |
| Bloomberg U.S. High Yield 2% Issuer Cap Index (reflects no deduction for fees, expenses, or taxes) | 8.62 | % | 4.50 | % | 6.52 | % |
| Average Annual Total Returns as of 12/31/2025 | ||||||
| 1 year | 5 year | 10 year | ||||
| JNL/PPM America High Yield Bond Fund (Class I) | 8.78 | % | 4.60 | % | 6.18 | % |
| Bloomberg U.S. Aggregate Index (reflects no deduction for fees, expenses, or taxes) | 7.30 | % | -0.36 | % | 2.01 | % |
| Bloomberg U.S. High Yield 2% Issuer Cap Index (reflects no deduction for fees, expenses, or taxes) | 8.62 | % | 4.50 | % | 6.52 | % |
The performance information shown provides some indication of the risks of investing in the Fund by showing changes in the Fund’s performance from year to year and by showing how the Fund’s average annual returns compared with those of broad-based securities market indices and an additional index that the Adviser believes more closely reflects the market segments in which the Fund invests. The Fund’s past performance is not necessarily an indication of how the Fund will perform in the future.
The returns shown in the bar chart and table do not include charges that will be imposed by variable insurance products. If these amounts were reflected, returns would be less than those shown.
Annual Total Returns as of December 31
Class A
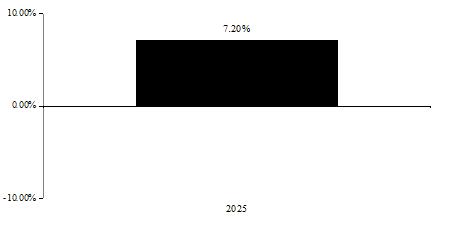
Best Quarter (ended 3/31/2025): 2.31%; Worst Quarter (ended 12/31/2025): 0.72%
Annual Total Returns as of December 31
Class I
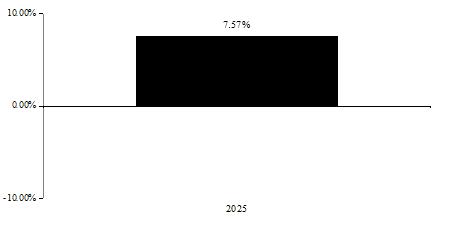
Best Quarter (ended 9/30/2025): 2.48%; Worst Quarter (ended 12/31/2025): 0.81%
| Average Annual Total Returns as of 12/31/2025 | ||||
| 1 year | Life
of Fund (April 29, 2024) | |||
| JNL/PPM America Investment Grade Credit Fund (Class A) | 7.20 | % | 6.76 | % |
| Bloomberg U.S. Aggregate Index (reflects no deduction for fees, expenses, or taxes) | 7.30 | % | 7.12 | % |
| Bloomberg U.S. Credit Index (reflects no deduction for fees, expenses, or taxes) | 7.83 | % | 7.72 | % |
| Average Annual Total Returns as of 12/31/2025 | ||||
| 1 year | Life
of Class (April 29, 2024) | |||
| JNL/PPM America Investment Grade Credit Fund (Class I) | 7.57 | % | 7.16 | % |
| Bloomberg U.S. Aggregate Index (reflects no deduction for fees, expenses, or taxes) | 7.30 | % | 7.12 | % |
| Bloomberg U.S. Credit Index (reflects no deduction for fees, expenses, or taxes) | 7.83 | % | 7.72 | % |
The performance information shown provides some indication of the risks of investing in the Fund by showing changes in the Fund’s performance from year to year and by showing how the Fund’s average annual returns compared with those of a broad-based securities market index. The Fund’s past performance is not necessarily an indication of how the Fund will perform in the future.
The returns shown in the bar chart and table do not include charges that will be imposed by variable insurance products. If these amounts were reflected, returns would be less than those shown.
The performance data below includes the performance of the JNL/PPM America Total Return Fund, then a series of JNL Investors Series Trust, for periods before the Fund's registration statement became effective.
Annual Total Returns as of December 31
Class A
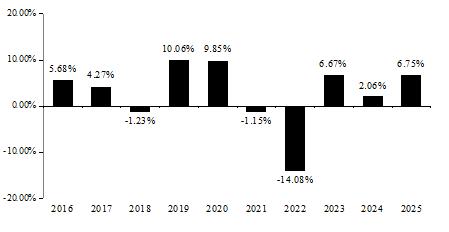
Best Quarter (ended 12/31/2023): 7.22%; Worst Quarter (ended 3/31/2022): -6.46%
Annual Total Returns as of December 31
Class I
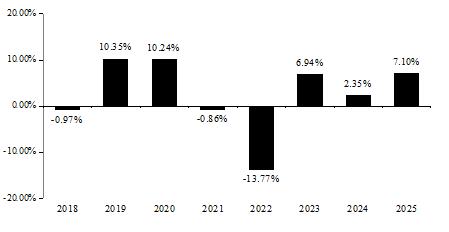
Best Quarter (ended 12/31/2023): 7.30%; Worst Quarter (ended 3/31/2022): -6.34%
| Average Annual Total Returns as of 12/31/2025 | ||||||
| 1 year | 5 year | 10 year | ||||
| JNL/PPM America Total Return Fund (Class A) | 6.75 | % | -0.26 | % | 2.65 | % |
| Bloomberg U.S. Aggregate Index (reflects no deduction for fees, expenses, or taxes) | 7.30 | % | -0.36 | % | 2.01 | % |
| Average Annual Total Returns as of 12/31/2025 | ||||||
| 1 year | 5 year | Life
of Class (September 25, 2017) | ||||
| JNL/PPM America Total Return Fund (Class I) | 7.10 | % | 0.04 | % | 2.40 | % |
| Bloomberg U.S. Aggregate Index (reflects no deduction for fees, expenses, or taxes) | 7.30 | % | -0.36 | % | 1.72 | % |
The performance information shown provides some indication of the risks of investing in the Fund by showing changes in the Fund’s performance from year to year and by showing how the Fund’s average annual returns compared with those of a broad-based securities market index and additional indices that the Adviser believes more closely reflects the market segments in which the Fund invests. Performance results include the effect of expense waiver/reduction arrangements for some or all of the periods shown. If such arrangements had not been in place, performance for those periods would have been lower. The Fund’s past performance is not necessarily an indication of how the Fund will perform in the future.
The returns shown in the bar chart and table do not include charges that will be imposed by variable insurance products. If these amounts were reflected, returns would be less than those shown.
Performance shown below reflects the historical performance of the JNL/Mellon Capital S&P® SMid 60 Fund, then a series of JNL Variable Fund LLC, for periods before the Fund's registration statement became effective on June 24, 2019.
Consistent with the Fund’s principal investment strategies, the Fund uses the Morningstar® U.S. Small Cap Extended IndexSM as the Fund’s tertiary benchmark.
Annual Total Returns as of December 31
Class A
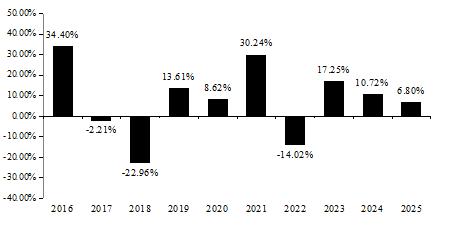
Best Quarter (ended 12/31/2020): 26.04%; Worst Quarter (ended 3/31/2020): -33.98%
Annual Total Returns as of December 31
Class I
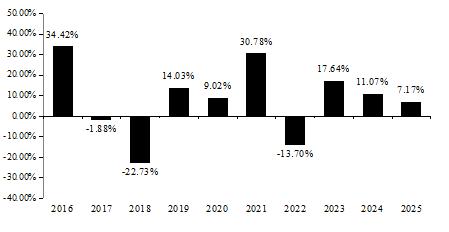
Best Quarter (ended 12/31/2020): 26.06%; Worst Quarter (ended 3/31/2020): -33.89%
| Average Annual Total Returns as of 12/31/2025 | ||||||
| 1 year | 5 year | 10 year | ||||
| JNL/RAFI® Fundamental U.S. Small Cap Fund (Class A) | 6.80 | % | 9.19 | % | 6.85 | % |
| Morningstar US Market Extended Index (reflects no deduction for fees, expenses, or taxes) | 17.21 | % | 13.13 | % | 14.31 | % |
| RAFI Fundamental US Small Company Index (reflects no deduction for fees, expenses, or taxes) | 7.51 | % | 9.93 | % | 10.38 | % |
| Morningstar US Small Cap Extended Index (reflects no deduction for fees, expenses, or taxes) | 11.86 | % | 6.94 | % | 9.67 | % |
| Average Annual Total Returns as of 12/31/2025 | ||||||
| 1 year | 5 year | 10 year | ||||
| JNL/RAFI® Fundamental U.S. Small Cap Fund (Class I) | 7.17 | % | 9.59 | % | 7.19 | % |
| Morningstar US Market Extended Index (reflects no deduction for fees, expenses, or taxes) | 17.21 | % | 13.13 | % | 14.31 | % |
| RAFI Fundamental US Small Company Index (reflects no deduction for fees, expenses, or taxes) | 7.51 | % | 9.93 | % | 10.38 | % |
| Morningstar US Small Cap Extended Index (reflects no deduction for fees, expenses, or taxes) | 11.86 | % | 6.94 | % | 9.67 | % |
The performance information shown provides some indication of the risks of investing in the Fund by showing changes in the Fund’s performance from year to year and by showing how the Fund’s average annual returns compared with those of a broad-based securities market index and an additional index that the Adviser believes more closely reflects the market segments in which the Fund invests. The Fund’s past performance is not necessarily an indication of how the Fund will perform in the future.
The returns shown in the bar chart and table do not include charges that will be imposed by variable insurance products. If these amounts were reflected, returns would be less than those shown.
Performance shown below reflects the historical performance of the JNL/Mellon Capital JNL 5 Fund, then a series of JNL Variable Fund LLC, for periods before the Fund's registration statement became effective on June 24, 2019.
Annual Total Returns as of December 31
Class A
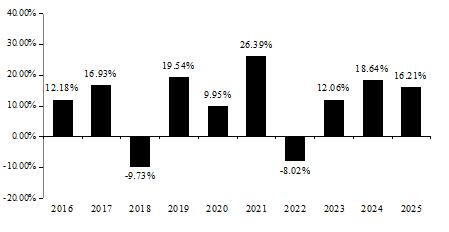
Best Quarter (ended 6/30/2020): 18.64%; Worst Quarter (ended 3/31/2020): -24.81%
Annual Total Returns as of December 31
Class I
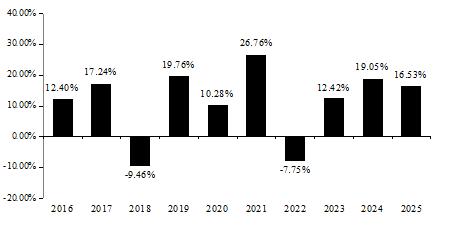
Best Quarter (ended 6/30/2020): 18.68%; Worst Quarter (ended 3/31/2020): -24.76%
| Average Annual Total Returns as of 12/31/2025 | ||||||
| 1 year | 5 year | 10 year | ||||
| JNL/RAFI® Multi-Factor U.S. Equity Fund (Class A) | 16.21 | % | 12.43 | % | 10.83 | % |
| Morningstar US Market Extended Index (reflects no deduction for fees, expenses, or taxes) | 17.21 | % | 13.13 | % | 14.31 | % |
| RAFI Multi-Factor US Index (reflects no deduction for fees, expenses, or taxes) | 16.95 | % | 13.16 | % | 12.61 | % |
| Average Annual Total Returns as of 12/31/2025 | ||||||
| 1 year | 5 year | 10 year | ||||
| JNL/RAFI® Multi-Factor U.S. Equity Fund (Class I) | 16.53 | % | 12.77 | % | 11.13 | % |
| Morningstar US Market Extended Index (reflects no deduction for fees, expenses, or taxes) | 17.21 | % | 13.13 | % | 14.31 | % |
| RAFI Multi-Factor US Index (reflects no deduction for fees, expenses, or taxes) | 16.95 | % | 13.16 | % | 12.61 | % |
The performance information shown provides some indication of the risks of investing in the Fund by showing changes in the Fund’s performance from year to year and by showing how the Fund’s average annual returns compared with those of a broad-based securities market index and an additional index that the Adviser believes more closely reflects the market segments in which the Fund invests. Performance results include the effect of expense waiver/reduction arrangements for some or all of the periods shown. If such arrangements had not been in place, performance for those periods would have been lower. The Fund’s past performance is not necessarily an indication of how the Fund will perform in the future.
The returns shown in the bar chart and table do not include charges that will be imposed by variable insurance products. If these amounts were reflected, returns would be less than those shown.
The performance data includes the performance of the JNL/T. Rowe Price Capital Appreciation Fund, then a series of the Jackson Variable Series Trust, for periods before the Fund’s registration statement became effective.
Effective April 27, 2026, the Fund was combined with JNL/T. Rowe Price Balanced Fund (“Acquired Fund”), with the Fund as the surviving Fund. The performance shown is the Fund's historic performance and does not reflect the performance of the Acquired Fund.
Annual Total Returns as of December 31
Class A
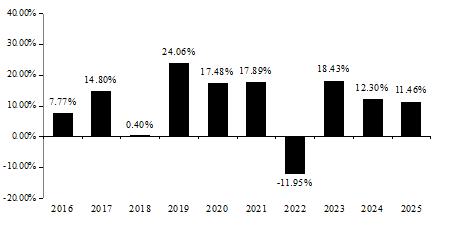
Best Quarter (ended 6/30/2020): 13.44%; Worst Quarter (ended 3/31/2020): -11.85%
Annual Total Returns as of December 31
Class I
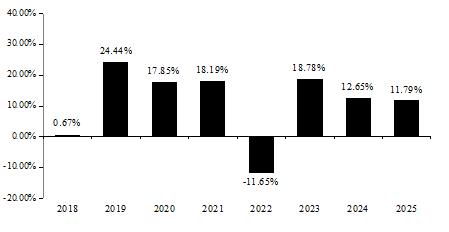
Best Quarter (ended 6/30/2020): 13.56%; Worst Quarter (ended 3/31/2020): -11.79%
| Average Annual Total Returns as of 12/31/2025 | ||||||
| 1 year | 5 year | 10 year | ||||
| JNL/T. Rowe Price Capital Appreciation Fund (Class A) | 11.46 | % | 9.00 | % | 10.79 | % |
| S&P 500 Index (reflects no deduction for fees, expenses, or taxes) | 17.88 | % | 14.42 | % | 14.82 | % |
| 60% S&P 500 Index, 40% Bloomberg U.S. Aggregate Index (reflects no deduction for fees, expenses, or taxes) | 13.70 | % | 8.47 | % | 9.78 | % |
| Bloomberg U.S. Aggregate Index (reflects no deduction for fees, expenses, or taxes) | 7.30 | % | -0.36 | % | 2.01 | % |
| Average Annual Total Returns as of 12/31/2025 | ||||||
| 1 year | 5 year | Life
of Class (September 25, 2017) | ||||
| JNL/T. Rowe Price Capital Appreciation Fund (Class I) | 11.79 | % | 9.33 | % | 11.07 | % |
| S&P 500 Index (reflects no deduction for fees, expenses, or taxes) | 17.88 | % | 14.42 | % | 14.82 | % |
| 60% S&P 500 Index, 40% Bloomberg U.S. Aggregate Index (reflects no deduction for fees, expenses, or taxes) | 13.70 | % | 8.47 | % | 9.69 | % |
| Bloomberg U.S. Aggregate Index (reflects no deduction for fees, expenses, or taxes) | 7.30 | % | -0.36 | % | 1.72 | % |
The performance information shown provides some indication of the risks of investing in the Fund by showing changes in the Fund’s performance from year to year and by showing how the Fund’s average annual returns compared with those of a broad-based securities market index. Performance results include the effect of expense waiver/reduction arrangements for some or all of the periods shown. If such arrangements had not been in place, performance for those periods would have been lower. The Fund’s past performance is not necessarily an indication of how the Fund will perform in the future.
The returns shown in the bar chart and table do not include charges that will be imposed by variable insurance products. If these amounts were reflected, returns would be less than those shown.
Annual Total Returns as of December 31
Class A
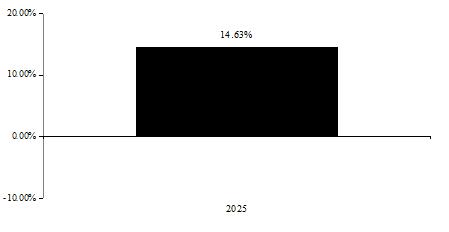
Best Quarter (ended 6/30/2025): 9.16%; Worst Quarter (ended 3/31/2025): -3.03%
Annual Total Returns as of December 31
Class I
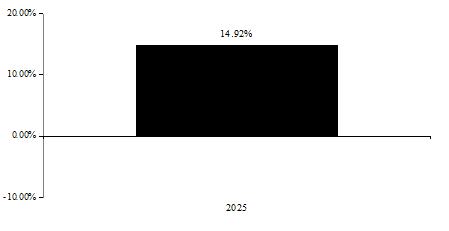
Best Quarter (ended 6/30/2025): 9.14%; Worst Quarter (ended 3/31/2025): -2.92%
| Average Annual Total Returns as of 12/31/2025 | ||||
| 1 year | Life
of Fund (October 21, 2024) | |||
| JNL/T. Rowe Price Capital Appreciation Equity Fund (Class A) | 14.63 | % | 11.24 | % |
| S&P 500 Index (reflects no deduction for fees, expenses, or taxes) | 17.88 | % | 15.26 | % |
| Average Annual Total Returns as of 12/31/2025 | ||||
| 1 year | Life
of Class (October 21, 2024) | |||
| JNL/T. Rowe Price Capital Appreciation Equity Fund (Class I) | 14.92 | % | 11.57 | % |
| S&P 500 Index (reflects no deduction for fees, expenses, or taxes) | 17.88 | % | 15.26 | % |
The performance information shown provides some indication of the risks of investing in the Fund by showing changes in the Fund’s performance from year to year and by showing how the Fund’s average annual returns compared with those of a broad-based securities market index and an additional index that the Adviser believes more closely reflects the market segments in which the Fund invests. Performance results include the effect of expense waiver/reduction arrangements for some or all of the periods shown. If such arrangements had not been in place, performance for those periods would have been lower. The Fund’s past performance is not necessarily an indication of how the Fund will perform in the future.
The returns shown in the bar chart and table do not include charges that will be imposed by variable insurance products. If these amounts were reflected, returns would be less than those shown.
Effective April 26, 2021, the Fund was combined with JNL/Vanguard Capital Growth Fund (“Acquired Fund”), with the Fund as the surviving Fund. The performance shown is the Fund's historic performance and does not reflect the performance of the Acquired Fund.
Annual Total Returns as of December 31
Class A
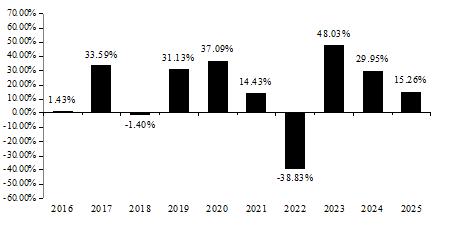
Best Quarter (ended 6/30/2020): 28.11%; Worst Quarter (ended 6/30/2022): -25.72%
Annual Total Returns as of December 31
Class I
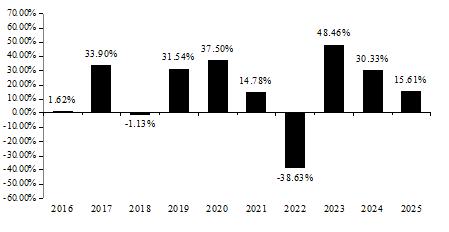
Best Quarter (ended 6/30/2020): 28.21%; Worst Quarter (ended 6/30/2022): -25.67%
| Average Annual Total Returns as of 12/31/2025 | ||||||
| 1 year | 5 year | 10 year | ||||
| JNL/T. Rowe Price Growth Stock Fund (Class A) | 15.26 | % | 9.19 | % | 14.06 | % |
| S&P 500 Index (reflects no deduction for fees, expenses, or taxes) | 17.88 | % | 14.42 | % | 14.82 | % |
| Morningstar US Large-Mid Cap Broad Growth Index (reflects no deduction for fees, expenses, or taxes) | 16.67 | % | 13.44 | % | 16.49 | % |
| Average Annual Total Returns as of 12/31/2025 | ||||||
| 1 year | 5 year | 10 year | ||||
| JNL/T. Rowe Price Growth Stock Fund (Class I) | 15.61 | % | 9.52 | % | 14.38 | % |
| S&P 500 Index (reflects no deduction for fees, expenses, or taxes) | 17.88 | % | 14.42 | % | 14.82 | % |
| Morningstar US Large-Mid Cap Broad Growth Index (reflects no deduction for fees, expenses, or taxes) | 16.67 | % | 13.44 | % | 16.49 | % |
The performance information shown provides some indication of the risks of investing in the Fund by showing changes in the Fund’s performance from year to year and by showing how the Fund’s average annual returns compared with those of a broad-based securities market index and an additional index that the Adviser believes more closely reflects the market segments in which the Fund invests. Performance results include the effect of expense waiver/reduction arrangements for some or all of the periods shown. If such arrangements had not been in place, performance for those periods would have been lower. The Fund’s past performance is not necessarily an indication of how the Fund will perform in the future.
The returns shown in the bar chart and table do not include charges that will be imposed by variable insurance products. If these amounts were reflected, returns would be less than those shown.
Annual Total Returns as of December 31
Class A
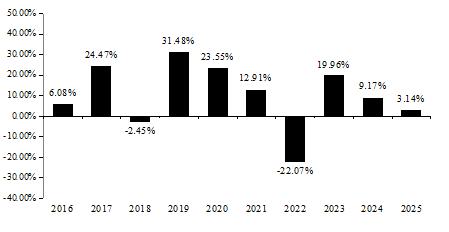
Best Quarter (ended 6/30/2020): 27.86%; Worst Quarter (ended 3/31/2020): -23.41%
Annual Total Returns as of December 31
Class I
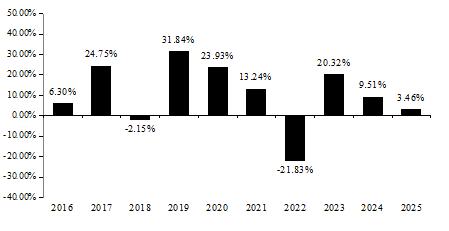
Best Quarter (ended 6/30/2020): 27.95%; Worst Quarter (ended 3/31/2020): -23.34%
| Average Annual Total Returns as of 12/31/2025 | ||||||
| 1 year | 5 year | 10 year | ||||
| JNL/T. Rowe Price Mid-Cap Growth Fund (Class A) | 3.14 | % | 3.52 | % | 9.54 | % |
| Morningstar US Market Extended Index (reflects no deduction for fees, expenses, or taxes) | 17.21 | % | 13.13 | % | 14.31 | % |
| Morningstar US Mid Cap Broad Growth Index (reflects no deduction for fees, expenses, or taxes) | 6.78 | % | 6.07 | % | 11.88 | % |
| Average Annual Total Returns as of 12/31/2025 | ||||||
| 1 year | 5 year | 10 year | ||||
| JNL/T. Rowe Price Mid-Cap Growth Fund (Class I) | 3.46 | % | 3.83 | % | 9.85 | % |
| Morningstar US Market Extended Index (reflects no deduction for fees, expenses, or taxes) | 17.21 | % | 13.13 | % | 14.31 | % |
| Morningstar US Mid Cap Broad Growth Index (reflects no deduction for fees, expenses, or taxes) | 6.78 | % | 6.07 | % | 11.88 | % |
The performance information shown provides some indication of the risks of investing in the Fund by showing changes in the Fund’s performance from year to year and by showing how the Fund’s average annual returns compared with those of a broad-based securities market index and an additional index that the Adviser believes more closely reflects the market segments in which the Fund invests. Performance results include the effect of expense waiver/reduction arrangements for some or all of the periods shown. If such arrangements had not been in place, performance for those periods would have been lower. The Fund’s past performance is not necessarily an indication of how the Fund will perform in the future.
The returns shown in the bar chart and table do not include charges that will be imposed by variable insurance products. If these amounts were reflected, returns would be less than those shown.
Annual Total Returns as of December 31
Class A
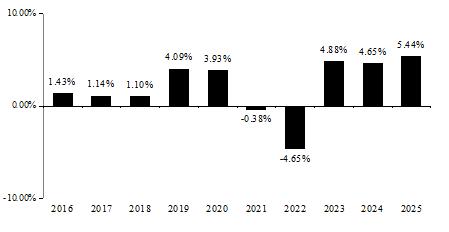
Best Quarter (ended 6/30/2020): 4.00%; Worst Quarter (ended 3/31/2022): -2.66%
Annual Total Returns as of December 31
Class I
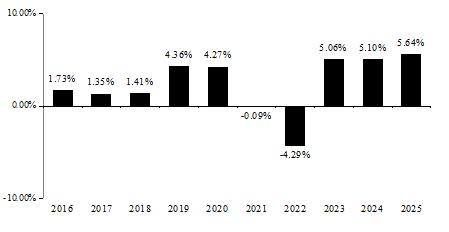
Best Quarter (ended 6/30/2020): 4.14%; Worst Quarter (ended 3/31/2022): -2.52%
| Average Annual Total Returns as of 12/31/2025 | ||||||
| 1 year | 5 year | 10 year | ||||
| JNL/T. Rowe Price Short-Term Bond Fund (Class A) | 5.44 | % | 1.91 | % | 2.12 | % |
| Bloomberg U.S. Aggregate Index (reflects no deduction for fees, expenses, or taxes) | 7.30 | % | -0.36 | % | 2.01 | % |
| Bloomberg 1-3 Yr Gov/Credit Index (reflects no deduction for fees, expenses, or taxes) | 5.35 | % | 1.97 | % | 2.09 | % |
| Average Annual Total Returns as of 12/31/2025 | ||||||
| 1 year | 5 year | 10 year | ||||
| JNL/T. Rowe Price Short-Term Bond Fund (Class I) | 5.64 | % | 2.21 | % | 2.41 | % |
| Bloomberg U.S. Aggregate Index (reflects no deduction for fees, expenses, or taxes) | 7.30 | % | -0.36 | % | 2.01 | % |
| Bloomberg 1-3 Yr Gov/Credit Index (reflects no deduction for fees, expenses, or taxes) | 5.35 | % | 1.97 | % | 2.09 | % |
The performance information shown provides some indication of the risks of investing in the Fund by showing changes in the Fund’s performance from year to year and by showing how the Fund’s average annual returns compared with those of a broad-based securities market index and an additional index that the Adviser believes m ore closely reflects the market segments in which the Fund invests. Performance results include the effect of expense waiver/reduction arrangements for some or all of the periods shown. If such arrangements had not been in place, performance for those periods would have been lower. The Fund’s past performance is not necessarily an indication of how the Fund will perform in the future.
The returns shown in the bar chart and table do not include charges that will be imposed by variable insurance products. If these amounts were reflected, returns would be less than those shown.
Annual Total Returns as of December 31
Class A
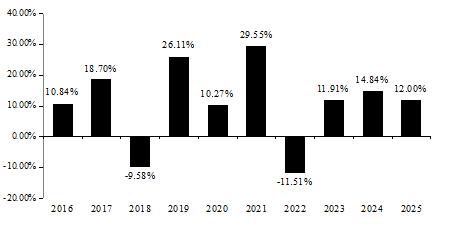
Best Quarter (ended 12/31/2020): 18.54%; Worst Quarter (ended 3/31/2020): -25.37%
Annual Total Returns as of December 31
Class I
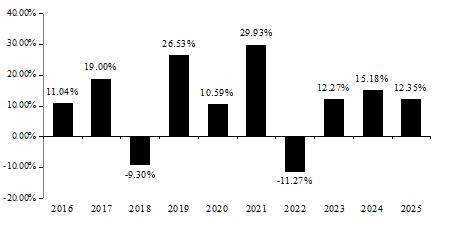
Best Quarter (ended 12/31/2020): 18.67%; Worst Quarter (ended 3/31/2020): -25.30%
| Average Annual Total Returns as of 12/31/2025 | ||||||
| 1 year | 5 year | 10 year | ||||
| JNL/T. Rowe Price Value Fund (Class A) | 12.00 | % | 10.54 | % | 10.56 | % |
| Morningstar US Target Market Exposure Index (reflects no deduction for fees, expenses, or taxes) | 17.80 | % | 13.88 | % | 14.77 | % |
| Morningstar US Large-Mid Cap Broad Value Index (reflects no deduction for fees, expenses, or taxes) | 18.83 | % | 13.38 | % | 12.50 | % |
| Average Annual Total Returns as of 12/31/2025 | ||||||
| 1 year | 5 year | 10 year | ||||
| JNL/T. Rowe Price Value Fund (Class I) | 12.35 | % | 10.87 | % | 10.88 | % |
| Morningstar US Target Market Exposure Index (reflects no deduction for fees, expenses, or taxes) | 17.80 | % | 13.88 | % | 14.77 | % |
| Morningstar US Large-Mid Cap Broad Value Index (reflects no deduction for fees, expenses, or taxes) | 18.83 | % | 13.38 | % | 12.50 | % |
The performance information shown provides some indication of the risks of investing in the Fund by showing changes in the Fund’s performance from year to year and by showing how the Fund’s average annual returns compared with those of a broad-based securities market index and additional indices that the Adviser believes more closely reflects the market segments in which the Fund invests. Performance results include the effect of expense waiver/reduction arrangements for some or all of the periods shown, and if such arrangements had not been in place, performance for those periods would have been lower. The Fund’s past performance is not necessarily an indication of how the Fund will perform in the future.
The returns shown in the bar chart and table do not include charges that will be imposed by variable insurance products. If these amounts were reflected, returns would be less than those shown.
Consistent with the Fund’s principal investment strategies, the Fund uses the 40% Morningstar® Global Target Market Exposure Index (Net), 60% Bloomberg U.S. Aggregate Index as the Fund’s tertiary benchmark.
Annual Total Returns as of December 31
Class A
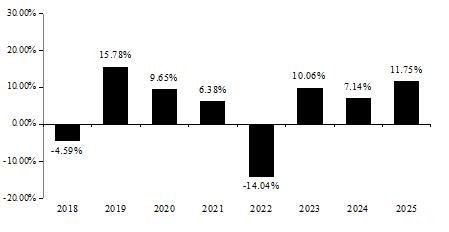
Best Quarter (ended 6/30/2020): 10.62%; Worst Quarter (ended 3/31/2020): -10.80%
Annual Total Returns as of December 31
Class I
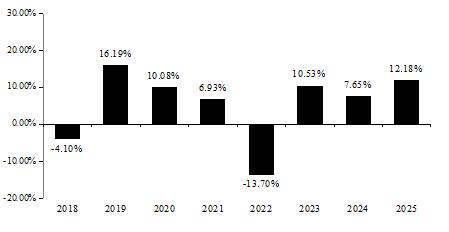
Best Quarter (ended 6/30/2020): 10.79%; Worst Quarter (ended 3/31/2020): -10.69%
| Average Annual Total Returns as of 12/31/2025 | ||||||
| 1 year | 5 year | Life
of Fund (September 25, 2017) | ||||
| JNL/Vanguard Moderate ETF Allocation Fund (Class A) | 11.75 | % | 3.80 | % | 4.97 | % |
| Bloomberg U.S. Aggregate Index (reflects no deduction for fees, expenses, or taxes) | 7.30 | % | -0.36 | % | 1.72 | % |
| Morningstar Moderately Conservative Target Risk Index (reflects no deduction for fees, expenses, or taxes) | 12.87 | % | 4.06 | % | 5.60 | % |
| 40% Morningstar Global Target Market Exposure Index (Net), 60% Bloomberg U.S. Aggregate Index (reflects no deduction for fees, expenses, or taxes) | 13.17 | % | 4.26 | % | 5.64 | % |
| Morningstar Global Target Market Exposure Index (Net) (reflects no deduction for fees, expenses, or taxes) | 22.23 | % | 11.20 | % | 11.15 | % |
| Average Annual Total Returns as of 12/31/2025 | ||||||
| 1 year | 5 year | Life
of Class (September 25, 2017) | ||||
| JNL/Vanguard Moderate ETF Allocation Fund (Class I) | 12.18 | % | 4.26 | % | 5.42 | % |
| Bloomberg U.S. Aggregate Index (reflects no deduction for fees, expenses, or taxes) | 7.30 | % | -0.36 | % | 1.72 | % |
| Morningstar Moderately Conservative Target Risk Index (reflects no deduction for fees, expenses, or taxes) | 12.87 | % | 4.06 | % | 5.60 | % |
| 40% Morningstar Global Target Market Exposure Index (Net), 60% Bloomberg U.S. Aggregate Index (reflects no deduction for fees, expenses, or taxes) | 13.17 | % | 4.26 | % | 5.64 | % |
| Morningstar Global Target Market Exposure Index (Net) (reflects no deduction for fees, expenses, or taxes) | 22.23 | % | 11.20 | % | 11.15 | % |
The performance information shown provides some indication of the risks of investing in the Fund by showing changes in the Fund’s performance from year to year and by showing how the Fund’s average annual returns compared with those of a broad-based securities market index and additional indices that the Adviser believes more closely reflects the market segments in which the Fund invests. Performance results include the effect of expense waiver/reduction arrangements for some or all of the periods shown, and if such arrangements had not been in place, performance for those periods would have been lower. The Fund’s past performance is not necessarily an indication of how the Fund will perform in the future.
The returns shown in the bar chart and table do not include charges that will be imposed by variable insurance products. If these amounts were reflected, returns would be less than those shown.
Effective April 26, 2021, the Fund was combined with JNL/DFA Moderate Growth Allocation Fund ("Acquired Fund"), with the Fund as the surviving Fund. The performance shown is the Fund's historic performance and does not reflect the performance of the Acquired Fund.
Consistent with the Fund’s principal investment strategies, the Fund uses the 60% Morningstar® Global Target Market Exposure Index (Net), 40% Bloomberg U.S. Aggregate Index as the Fund’s tertiary benchmark.
Annual Total Returns as of December 31
Class A
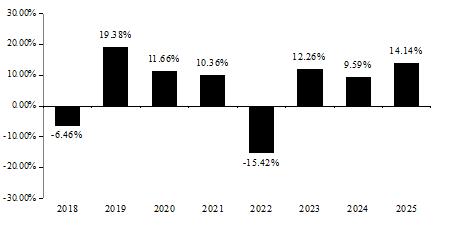
Best Quarter (ended 6/30/2020): 13.84%; Worst Quarter (ended 3/31/2020): -15.11%
Annual Total Returns as of December 31
Class I
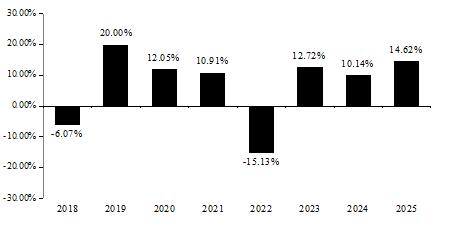
Best Quarter (ended 6/30/2020): 13.88%; Worst Quarter (ended 3/31/2020): -15.04%
| Average Annual Total Returns as of 12/31/2025 | ||||||
| 1 year | 5 year | Life
of Fund (September 25, 2017) | ||||
| JNL/Vanguard Moderate Growth ETF Allocation Fund (Class A) | 14.14 | % | 5.56 | % | 6.59 | % |
| Morningstar Global Target Market Exposure Index (Net) (reflects no deduction for fees, expenses, or taxes) | 22.23 | % | 11.20 | % | 11.15 | % |
| Morningstar Moderate Target Risk Index (reflects no deduction for fees, expenses, or taxes) | 15.95 | % | 5.95 | % | 7.18 | % |
| 60% Morningstar Global Target Market Exposure Index (Net), 40% Bloomberg U.S. Aggregate Index (reflects no deduction for fees, expenses, or taxes) | 16.16 | % | 6.57 | % | 7.53 | % |
| Bloomberg U.S. Aggregate Index (reflects no deduction for fees, expenses, or taxes) | 7.30 | % | -0.36 | % | 1.72 | % |
| Average Annual Total Returns as of 12/31/2025 | ||||||
| 1 year | 5 year | Life
of Class (September 25, 2017) | ||||
| JNL/Vanguard Moderate Growth ETF Allocation Fund (Class I) | 14.62 | % | 6.02 | % | 7.05 | % |
| Morningstar Global Target Market Exposure Index (Net) (reflects no deduction for fees, expenses, or taxes) | 22.23 | % | 11.20 | % | 11.15 | % |
| Morningstar Moderate Target Risk Index (reflects no deduction for fees, expenses, or taxes) | 15.95 | % | 5.95 | % | 7.18 | % |
| 60% Morningstar Global Target Market Exposure Index (Net), 40% Bloomberg U.S. Aggregate Index (reflects no deduction for fees, expenses, or taxes) | 16.16 | % | 6.57 | % | 7.53 | % |
| Bloomberg U.S. Aggregate Index (reflects no deduction for fees, expenses, or taxes) | 7.30 | % | -0.36 | % | 1.72 | % |
The performance information shown provides some indication of the risks of investing in the Fund by showing changes in the Fund’s performance from year to year and by showing how the Fund’s average annual returns compared with those of a broad-based securities market index and additional indices that the Adviser believes more closely reflects the market segments in which the Fund invests. Performance results include the effect of expense waiver/reduction arrangements for some or all of the periods shown, and if such arrangements had not been in place, performance for those periods would have been lower. The Fund’s past performance is not necessarily an indication of how the Fund will perform in the future.
The returns shown in the bar chart and table do not include charges that will be imposed by variable insurance products. If these amounts were reflected, returns would be less than those shown.
Effective April 26, 2021, the Fund was combined with JNL/DFA Growth Allocation Fund and JNL/Mellon Index 5 Fund ("Acquired Funds"), with the Fund as the surviving Fund. The performance shown is the Fund's historic performance and does not reflect the performance of the Acquired Funds.
Consistent with the Fund’s principal investment strategies, the Fund uses the 80% Morningstar® Global Target Market Exposure Index (Net), 20% Bloomberg U.S. Aggregate Index as the Fund’s tertiary benchmark.
Annual Total Returns as of December 31
Class A
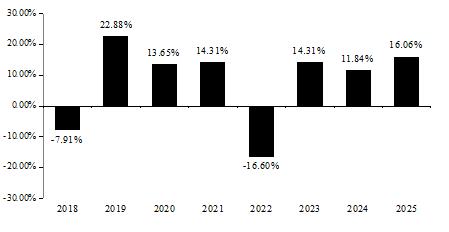
Best Quarter (ended 6/30/2020): 17.00%; Worst Quarter (ended 3/31/2020): -19.21%
Annual Total Returns as of December 31
Class I
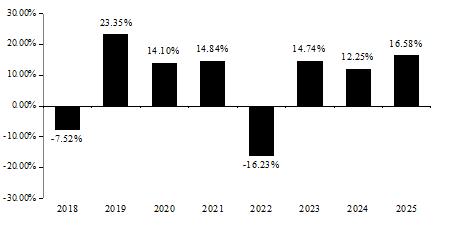
Best Quarter (ended 6/30/2020): 17.01%; Worst Quarter (ended 3/31/2020): -19.10%
| Average Annual Total Returns as of 12/31/2025 | ||||||
| 1 year | 5 year | Life
of Fund (September 25, 2017) | ||||
| JNL/Vanguard Growth ETF Allocation Fund (Class A) | 16.06 | % | 7.18 | % | 8.13 | % |
| Morningstar Global Target Market Exposure Index (Net) (reflects no deduction for fees, expenses, or taxes) | 22.23 | % | 11.20 | % | 11.15 | % |
| Morningstar Moderately Aggressive Target Risk Index (reflects no deduction for fees, expenses, or taxes) | 18.45 | % | 7.94 | % | 8.79 | % |
| 80% Morningstar Global Target Market Exposure Index (Net), 20% Bloomberg U.S. Aggregate Index (reflects no deduction for fees, expenses, or taxes) | 19.18 | % | 8.89 | % | 9.37 | % |
| Bloomberg U.S. Aggregate Index (reflects no deduction for fees, expenses, or taxes) | 7.30 | % | -0.36 | % | 1.72 | % |
| Average Annual Total Returns as of 12/31/2025 | ||||||
| 1 year | 5 year | Life
of Class (September 25, 2017) | ||||
| JNL/Vanguard Growth ETF Allocation Fund (Class I) | 16.58 | % | 7.63 | % | 8.59 | % |
| Morningstar Global Target Market Exposure Index (Net) (reflects no deduction for fees, expenses, or taxes) | 22.23 | % | 11.20 | % | 11.15 | % |
| Morningstar Moderately Aggressive Target Risk Index (reflects no deduction for fees, expenses, or taxes) | 18.45 | % | 7.94 | % | 8.79 | % |
| 80% Morningstar Global Target Market Exposure Index (Net), 20% Bloomberg U.S. Aggregate Index (reflects no deduction for fees, expenses, or taxes) | 19.18 | % | 8.89 | % | 9.37 | % |
| Bloomberg U.S. Aggregate Index (reflects no deduction for fees, expenses, or taxes) | 7.30 | % | -0.36 | % | 1.72 | % |
The performance information shown provides some indication of the risks of investing in the Fund by showing changes in the Fund’s performance from year to year and by showing how the Fund’s average annual returns compared with those of a broad-based securities market index. The Fund’s past performance is not necessarily an indication of how the Fund will perform in the future.
The returns shown in the bar chart and table do not include charges that will be imposed by variable insurance products. If these amounts were reflected, returns would be less than those shown.
The performance data includes the performance of the JNL/WCM Focused International Equity Fund, then a series of the Jackson Variable Series Trust, for periods before the Fund's registration statement became effective.
Annual Total Returns as of December 31
Class A
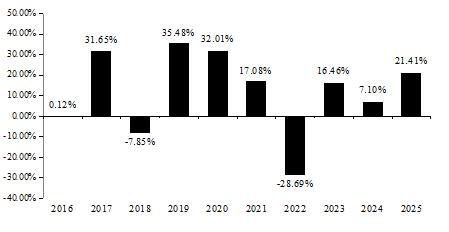
Best Quarter (ended 6/30/2020): 25.90%; Worst Quarter (ended 6/30/2022): -17.62%
Annual Total Returns as of December 31
Class I
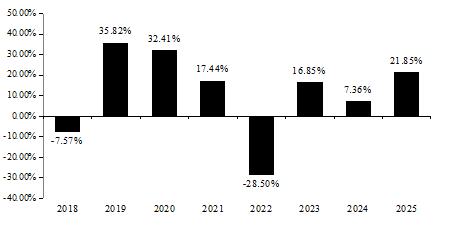
Best Quarter (ended 6/30/2020): 25.99%; Worst Quarter (ended 6/30/2022): -17.58%
| Average Annual Total Returns as of 12/31/2025 | ||||||
| 1 year | 5 year | 10 year | ||||
| JNL/WCM Focused International Equity Fund (Class A) | 21.41 | % | 4.80 | % | 10.63 | % |
| Morningstar Global ex-US Target Market Exposure Index (Net) (reflects no deduction for fees, expenses, or taxes) | 31.87 | % | 8.05 | % | 8.54 | % |
| Average Annual Total Returns as of 12/31/2025 | ||||||
| 1 year | 5 year | Life
of Class (September 25, 2017) | ||||
| JNL/WCM Focused International Equity Fund (Class I) | 21.85 | % | 5.12 | % | 10.22 | % |
| Morningstar Global ex-US Target Market Exposure Index (Net) (reflects no deduction for fees, expenses, or taxes) | 31.87 | % | 8.05 | % | 7.32 | % |
The performance information shown provides some indication of the risks of investing in the Fund by showing changes in the Fund’s performance from year to year and by showing how the Fund’s average annual returns compared with those of a broad-based securities market index and an additional index that the Adviser believes more closely reflects the market segments in which the Fund invests. The Fund’s past performance is not necessarily an indication of how the Fund will perform in the future.
The returns shown in the bar chart and table do not include charges that will be imposed by variable insurance products. If these amounts were reflected, returns would be less than those shown.
Annual Total Returns as of December 31
Class A
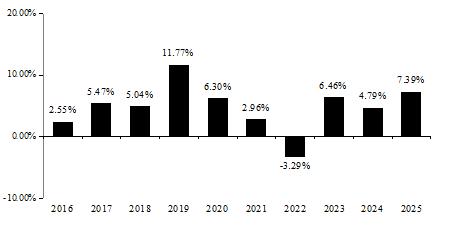
Best Quarter (ended 12/31/2020): 10.48%; Worst Quarter (ended 3/31/2020): -13.68%
Annual Total Returns as of December 31
Class I
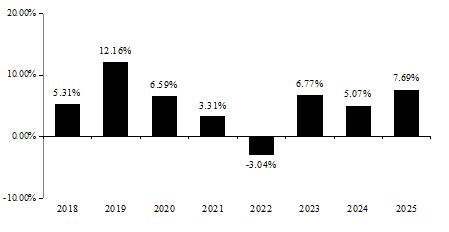
Best Quarter (ended 12/31/2020): 10.59%; Worst Quarter (ended 3/31/2020): -13.64%
| Average Annual Total Returns as of 12/31/2025 | ||||||
| 1 year | 5 year | 10 year | ||||
| JNL/Westchester Capital Event Driven Fund (Class A) | 7.39 | % | 3.59 | % | 4.88 | % |
| Bloomberg U.S. Aggregate Index (reflects no deduction for fees, expenses, or taxes) | 7.30 | % | -0.36 | % | 2.01 | % |
| Wilshire Liquid Alternative Event Driven Index (reflects no deduction for fees, expenses, or taxes) | 3.50 | % | 1.61 | % | 2.55 | % |
| Average Annual Total Returns as of 12/31/2025 | ||||||
| 1 year | 5 year | Life
of Class (September 25, 2017) | ||||
| JNL/Westchester Capital Event Driven Fund (Class I) | 7.69 | % | 3.89 | % | 5.38 | % |
| Bloomberg U.S. Aggregate Index (reflects no deduction for fees, expenses, or taxes) | 7.30 | % | -0.36 | % | 1.72 | % |
| Wilshire Liquid Alternative Event Driven Index (reflects no deduction for fees, expenses, or taxes) | 3.50 | % | 1.61 | % | 2.38 | % |
The performance information shown provides some indication of the risks of investing in the Fund by showing changes in the Fund’s performance from year to year and by showing how the Fund’s average annual returns compared with those of a broad-based securities market index and an additional index that the Adviser believes more closely reflects the market segments in which the Fund invests. The Fund’s past performance is not necessarily an indication of how the Fund will perform in the future.
The returns shown in the bar chart and table do not include charges that will be imposed by variable insurance products. If these amounts were reflected, returns would be less than those shown.
Annual Total Returns as of December 31
Class A
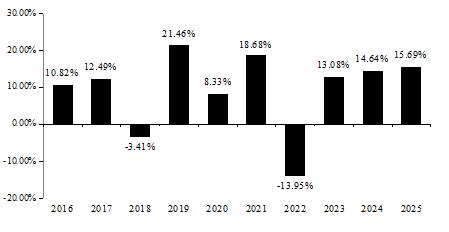
Best Quarter (ended 6/30/2020): 11.39%; Worst Quarter (ended 3/31/2020): -14.62%
Annual Total Returns as of December 31
Class I
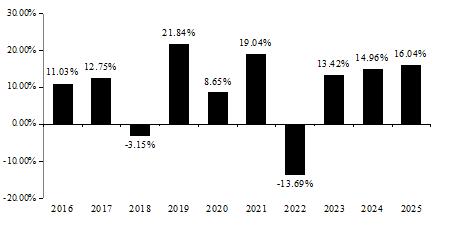
Best Quarter (ended 6/30/2020): 11.45%; Worst Quarter (ended 3/31/2020): -14.55%
| Average Annual Total Returns as of 12/31/2025 | ||||||
| 1 year | 5 year | 10 year | ||||
| JNL/WMC Balanced Fund (Class A) | 15.69 | % | 8.90 | % | 9.27 | % |
| S&P 500 Index (reflects no deduction for fees, expenses, or taxes) | 17.88 | % | 14.42 | % | 14.82 | % |
| 65% S&P 500 Index, 35% Bloomberg U.S. Aggregate Index (reflects no deduction for fees, expenses, or taxes) | 14.23 | % | 9.21 | % | 10.42 | % |
| Bloomberg U.S. Aggregate Index (reflects no deduction for fees, expenses, or taxes) | 7.30 | % | -0.36 | % | 2.01 | % |
| Average Annual Total Returns as of 12/31/2025 | ||||||
| 1 year | 5 year | 10 year | ||||
| JNL/WMC Balanced Fund (Class I) | 16.04 | % | 9.22 | % | 9.57 | % |
| S&P 500 Index (reflects no deduction for fees, expenses, or taxes) | 17.88 | % | 14.42 | % | 14.82 | % |
| 65% S&P 500 Index, 35% Bloomberg U.S. Aggregate Index (reflects no deduction for fees, expenses, or taxes) | 14.23 | % | 9.21 | % | 10.42 | % |
| Bloomberg U.S. Aggregate Index (reflects no deduction for fees, expenses, or taxes) | 7.30 | % | -0.36 | % | 2.01 | % |
The performance information shown provides some indication of the risks of investing in the Fund by showing changes in the Fund’s performance from year to year and by showing how the Fund’s average annual returns compared with those of a broad-based securities market index and an additional index that the Adviser believes more closely reflects the market segments in which the Fund invests. Performance results include the effect of expense waiver/reduction arrangements for some or all of the periods shown. If such arrangements had not been in place, performance for those periods would have been lower. Performance prior to April 26, 2021 reflects the Fund's results when the Fund did not have a sub-adviser and operated as a feeder fund in a master-feeder arrangement. The Fund’s past performance is not necessarily an indication of how the Fund will perform in the future.
The returns shown in the bar chart and table do not include charges that will be imposed by variable insurance products. If these amounts were reflected, returns would be less than those shown.
Annual Total Returns as of December 31
Class A
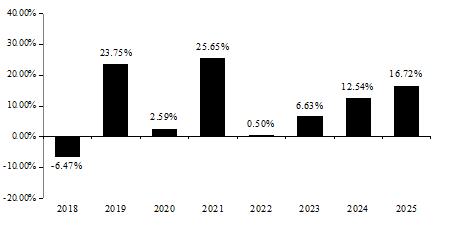
Best Quarter (ended 12/31/2022): 13.23%; Worst Quarter (ended 3/31/2020): -22.83%
Annual Total Returns as of December 31
Class I
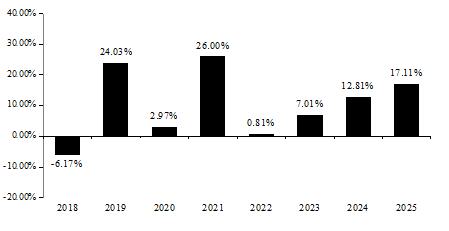
Best Quarter (ended 12/31/2022): 13.30%; Worst Quarter (ended 3/31/2020): -22.75%
| Average Annual Total Returns as of 12/31/2025 | ||||||
| 1 year | 5 year | Life
of Fund (September 25, 2017) | ||||
| JNL/WMC Equity Income Fund (Class A) | 16.72 | % | 12.08 | % | 10.25 | % |
| Morningstar US Target Market Exposure Index (reflects no deduction for fees, expenses, or taxes) | 17.80 | % | 13.88 | % | 14.76 | % |
| Morningstar Dividend Composite Index (reflects no deduction for fees, expenses, or taxes) | 15.49 | % | 12.45 | % | 11.92 | % |
| Average Annual Total Returns as of 12/31/2025 | ||||||
| 1 year | 5 year | Life
of Class (September 25, 2017) | ||||
| JNL/WMC Equity Income Fund (Class I) | 17.11 | % | 12.42 | % | 10.60 | % |
| Morningstar US Target Market Exposure Index (reflects no deduction for fees, expenses, or taxes) | 17.80 | % | 13.88 | % | 14.76 | % |
| Morningstar Dividend Composite Index (reflects no deduction for fees, expenses, or taxes) | 15.49 | % | 12.45 | % | 11.92 | % |
The performance information shown provides some indication of the risks of investing in the Fund by showing changes in the Fund’s performance from year to year and by showing how the Fund’s average annual returns compared with those of a broad-based securities market index and an additional index that the Adviser believes more closely reflects the market segments in which the Fund invests. The Fund’s past performance is not necessarily an indication of how the Fund will perform in the future.
The returns shown in the bar chart and table do not include charges that will be imposed by variable insurance products. If these amounts were reflected, returns would be less than those shown.
Annual Total Returns as of December 31
Class A
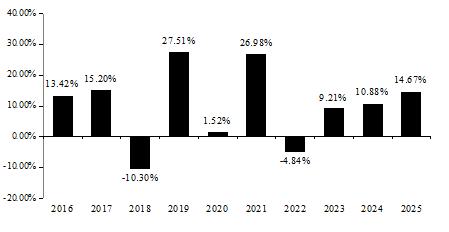
Best Quarter (ended 12/31/2020): 15.10%; Worst Quarter (ended 3/31/2020): -25.79%
Annual Total Returns as of December 31
Class I
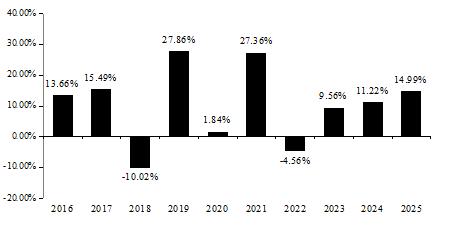
Best Quarter (ended 12/31/2020): 15.18%; Worst Quarter (ended 3/31/2020): -25.70%
| Average Annual Total Returns as of 12/31/2025 | ||||||
| 1 year | 5 year | 10 year | ||||
| JNL/WMC Value Fund (Class A) | 14.67 | % | 10.91 | % | 9.80 | % |
| Morningstar US Target Market Exposure Index (reflects no deduction for fees, expenses, or taxes) | 17.80 | % | 13.88 | % | 14.77 | % |
| Morningstar US Large-Mid Cap Broad Value Index (reflects no deduction for fees, expenses, or taxes) | 18.83 | % | 13.38 | % | 12.50 | % |
| Average Annual Total Returns as of 12/31/2025 | ||||||
| 1 year | 5 year | 10 year | ||||
| JNL/WMC Value Fund (Class I) | 14.99 | % | 11.24 | % | 10.11 | % |
| Morningstar US Target Market Exposure Index (reflects no deduction for fees, expenses, or taxes) | 17.80 | % | 13.88 | % | 14.77 | % |
| Morningstar US Large-Mid Cap Broad Value Index (reflects no deduction for fees, expenses, or taxes) | 18.83 | % | 13.38 | % | 12.50 | % |
The performance information shown provides some indication of the risks of investing in the Fund by showing changes in the Fund’s performance from year to year and by showing how the Fund’s average annual returns compared with those of a broad-based securities market index and additional indices that the Adviser believes more closely reflects the market segments in which the Fund invests. Performance results include the effect of expense waiver/reduction arrangements for some or all of the periods shown. If such arrangements had not been in place, performance for those periods would have been lower. Performance prior to on or about July 1, 2019 reflects the Fund's results when managed by the former sub-adviser, Standard & Poor's Investment Advisory Services LLC. Performance prior to October 21, 2024 reflects the Fund's results when managed by the former sub-adviser, Goldman Sachs Asset Management, L.P. The Fund’s past performance is not necessarily an indication of how the Fund will perform in the future.
The returns shown in the bar chart and table do not include charges that will be imposed by variable insurance products. If these amounts were reflected, returns would be less than those shown.
Consistent with the Fund’s principal investment strategies, the Fund uses the 80% Bloomberg U.S. Aggregate Index, 14.30% S&P 500 Index, 5.70% Morningstar Developed Markets ex-North America Target Market Exposure Index (Net) as the Fund’s tertiary benchmark.
Annual Total Returns as of December 31
Class A
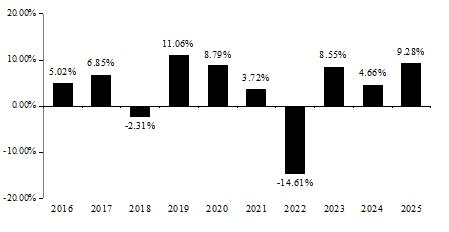
Best Quarter (ended 6/30/2020): 8.46%; Worst Quarter (ended 6/30/2022): -8.41%
Annual Total Returns as of December 31
Class I
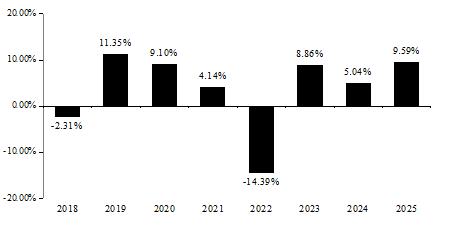
Best Quarter (ended 6/30/2020): 8.49%; Worst Quarter (ended 6/30/2022): -8.38%
| Average Annual Total Returns as of 12/31/2025 | ||||||
| 1 year | 5 year | 10 year | ||||
| JNL/JPMorgan Managed Conservative Fund (Class A) | 9.28 | % | 1.92 | % | 3.83 | % |
| Bloomberg U.S. Aggregate Index (reflects no deduction for fees, expenses, or taxes) | 7.30 | % | -0.36 | % | 2.01 | % |
| Morningstar Conservative Target Risk Index (reflects no deduction for fees, expenses, or taxes) | 10.40 | % | 1.81 | % | 3.98 | % |
| 80% Bloomberg U.S. Aggregate Index, 14.30% S&P 500 Index, 5.70% Morningstar Developed Markets ex-North America Target Market Exposure Index (Net) (reflects no deduction for fees, expenses, or taxes) | 10.13 | % | 2.28 | % | 4.27 | % |
| S&P 500 Index (reflects no deduction for fees, expenses, or taxes) | 17.88 | % | 14.42 | % | 14.82 | % |
| Morningstar Developed Markets ex-North America Target Market Exposure Index (Net) (reflects no deduction for fees, expenses, or taxes) | 31.61 | % | 9.00 | % | 8.27 | % |
| Average Annual Total Returns as of 12/31/2025 | ||||||
| 1 year | 5 year | Life
of Class (September 25, 2017) | ||||
| JNL/JPMorgan Managed Conservative Fund (Class I) | 9.59 | % | 2.24 | % | 3.64 | % |
| Bloomberg U.S. Aggregate Index (reflects no deduction for fees, expenses, or taxes) | 7.30 | % | -0.36 | % | 1.72 | % |
| Morningstar Conservative Target Risk Index (reflects no deduction for fees, expenses, or taxes) | 10.40 | % | 1.81 | % | 3.58 | % |
| 80% Bloomberg U.S. Aggregate Index, 14.30% S&P 500 Index, 5.70% Morningstar Developed Markets ex-North America Target Market Exposure Index (Net) (reflects no deduction for fees, expenses, or taxes) | 10.13 | % | 2.28 | % | 4.01 | % |
| S&P 500 Index (reflects no deduction for fees, expenses, or taxes) | 17.88 | % | 14.42 | % | 14.82 | % |
| Morningstar Developed Markets ex-North America Target Market Exposure Index (Net) (reflects no deduction for fees, expenses, or taxes) | 31.61 | % | 9.00 | % | 7.58 | % |
The performance information shown provides some indication of the risks of investing in the Fund by showing changes in the Fund’s performance from year to year and by showing how the Fund’s average annual returns compared with those of a broad-based securities market index and additional indices that the Adviser believes more closely reflects the market segments in which the Fund invests. Performance results include the effect of expense waiver/reduction arrangements for some or all of the periods shown. If such arrangements had not been in place, performance for those periods would have been lower. Performance prior to on or about July 1, 2019 reflects the Fund's results when managed by the former sub-adviser, Standard & Poor's Investment Advisory Services LLC. Performance prior to October 21, 2024 reflects the Fund's results when managed by the former sub-adviser, Goldman Sachs Asset Management, L.P. The Fund’s past performance is not necessarily an indication of how the Fund will perform in the future.
The returns shown in the bar chart and table do not include charges that will be imposed by variable insurance products. If these amounts were reflected, returns would be less than those shown.
Consistent with the Fund’s principal investment strategies, the Fund uses the 60% Bloomberg U.S. Aggregate Index, 28% S&P 500 Index, 12% Morningstar Developed Markets ex-North America Target Market Exposure Index (Net) as the Fund’s tertiary benchmark.
Annual Total Returns as of December 31
Class A
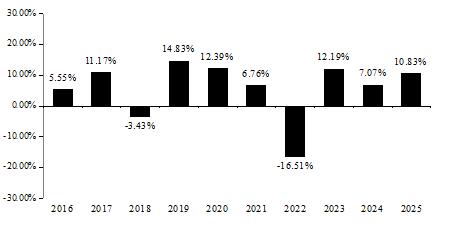
Best Quarter (ended 6/30/2020): 11.55%; Worst Quarter (ended 6/30/2022): -10.63%
Annual Total Returns as of December 31
Class I
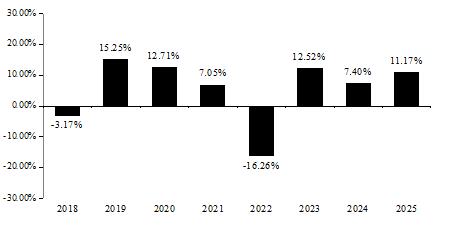
Best Quarter (ended 6/30/2020): 11.66%; Worst Quarter (ended 6/30/2022): -10.54%
| Average Annual Total Returns as of 12/31/2025 | ||||||
| 1 year | 5 year | 10 year | ||||
| JNL/JPMorgan Managed Moderate Fund (Class A) | 10.83 | % | 3.48 | % | 5.67 | % |
| Bloomberg U.S. Aggregate Index (reflects no deduction for fees, expenses, or taxes) | 7.30 | % | -0.36 | % | 2.01 | % |
| Morningstar Moderately Conservative Target Risk Index (reflects no deduction for fees, expenses, or taxes) | 12.87 | % | 4.06 | % | 6.10 | % |
| 60% Bloomberg U.S. Aggregate Index, 28% S&P 500 Index, 12% Morningstar Developed Markets ex-North America Target Market Exposure Index (Net) (reflects no deduction for fees, expenses, or taxes) | 13.07 | % | 4.90 | % | 6.46 | % |
| S&P 500 Index (reflects no deduction for fees, expenses, or taxes) | 17.88 | % | 14.42 | % | 14.82 | % |
| Morningstar Developed Markets ex-North America Target Market Exposure Index (Net) (reflects no deduction for fees, expenses, or taxes) | 31.61 | % | 9.00 | % | 8.27 | % |
| Average Annual Total Returns as of 12/31/2025 | ||||||
| 1 year | 5 year | Life
of Class (September 25, 2017) | ||||
| JNL/JPMorgan Managed Moderate Fund (Class I) | 11.17 | % | 3.79 | % | 5.47 | % |
| Bloomberg U.S. Aggregate Index (reflects no deduction for fees, expenses, or taxes) | 7.30 | % | -0.36 | % | 1.72 | % |
| Morningstar Moderately Conservative Target Risk Index (reflects no deduction for fees, expenses, or taxes) | 12.87 | % | 4.06 | % | 5.60 | % |
| 60% Bloomberg U.S. Aggregate Index, 28% S&P 500 Index, 12% Morningstar Developed Markets ex-North America Target Market Exposure Index (Net) (reflects no deduction for fees, expenses, or taxes) | 13.07 | % | 4.90 | % | 6.23 | % |
| S&P 500 Index (reflects no deduction for fees, expenses, or taxes) | 17.88 | % | 14.42 | % | 14.82 | % |
| Morningstar Developed Markets ex-North America Target Market Exposure Index (Net) (reflects no deduction for fees, expenses, or taxes) | 31.61 | % | 9.00 | % | 7.58 | % |
The performance information shown provides some indication of the risks of investing in the Fund by showing changes in the Fund’s performance from year to year and by showing how the Fund’s average annual returns compared with those of a broad-based securities market index and additional indices that the Adviser believes more closely reflects the market segments in which the Fund invests. Performance results include the effect of expense waiver/reduction arrangements for some or all of the periods shown. If such arrangements had not been in place, performance for those periods would have been lower. Performance prior to on or about July 1, 2019 reflects the Fund's results when managed by the former sub-adviser, Standard & Poor's Investment Advisory Services LLC. Performance prior to October 21, 2024 reflects the Fund's results when managed by the former sub-adviser, Goldman Sachs Asset Management, L.P. The Fund’s past performance is not necessarily an indication of how the Fund will perform in the future.
The returns shown in the bar chart and table do not include charges that will be imposed by variable insurance products. If these amounts were reflected, returns would be less than those shown.
Consistent with the Fund’s principal investment strategies, the Fund uses the 42% S&P 500 Index, 40% Bloomberg U.S. Aggregate Index, 18% Morningstar Developed Markets ex-North America Target Market Exposure Index (Net) as the Fund’s tertiary benchmark.
Annual Total Returns as of December 31
Class A
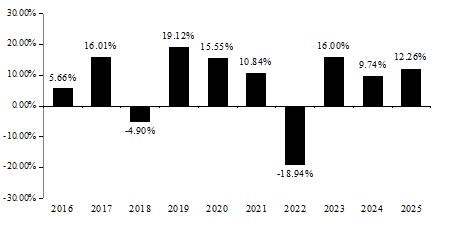
Best Quarter (ended 6/30/2020): 15.21%; Worst Quarter (ended 3/31/2020): -14.29%
Annual Total Returns as of December 31
Class I
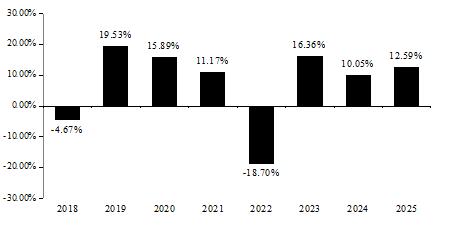
Best Quarter (ended 6/30/2020): 15.33%; Worst Quarter (ended 3/31/2020): -14.24%
| Average Annual Total Returns as of 12/31/2025 | ||||||
| 1 year | 5 year | 10 year | ||||
| JNL/JPMorgan Managed Moderate Growth Fund (Class A) | 12.26 | % | 5.13 | % | 7.50 | % |
| Morningstar Global Target Market Exposure Index (Net) (reflects no deduction for fees, expenses, or taxes) | 22.23 | % | 11.20 | % | 11.70 | % |
| Morningstar Moderate Target Risk Index (reflects no deduction for fees, expenses, or taxes) | 15.95 | % | 5.95 | % | 7.83 | % |
| 42% S&P 500 Index, 40% Bloomberg U.S. Aggregate Index, 18% Morningstar Developed Markets ex-North America Target Market Exposure Index (Net) (reflects no deduction for fees, expenses, or taxes) | 16.01 | % | 7.55 | % | 8.65 | % |
| Bloomberg U.S. Aggregate Index (reflects no deduction for fees, expenses, or taxes) | 7.30 | % | -0.36 | % | 2.01 | % |
| S&P 500 Index (reflects no deduction for fees, expenses, or taxes) | 17.88 | % | 14.42 | % | 14.82 | % |
| Morningstar Developed Markets ex-North America Target Market Exposure Index (Net) (reflects no deduction for fees, expenses, or taxes) | 31.61 | % | 9.00 | % | 8.27 | % |
| Average Annual Total Returns as of 12/31/2025 | ||||||
| 1 year | 5 year | Life
of Class (September 25, 2017) | ||||
| JNL/JPMorgan Managed Moderate Growth Fund (Class I) | 12.59 | % | 5.44 | % | 7.28 | % |
| Morningstar Global Target Market Exposure Index (Net) (reflects no deduction for fees, expenses, or taxes) | 22.23 | % | 11.20 | % | 11.15 | % |
| Morningstar Moderate Target Risk Index (reflects no deduction for fees, expenses, or taxes) | 15.95 | % | 5.95 | % | 7.18 | % |
| 42% S&P 500 Index, 40% Bloomberg U.S. Aggregate Index, 18% Morningstar Developed Markets ex-North America Target Market Exposure Index (Net) (reflects no deduction for fees, expenses, or taxes) | 16.01 | % | 7.55 | % | 8.43 | % |
| Bloomberg U.S. Aggregate Index (reflects no deduction for fees, expenses, or taxes) | 7.30 | % | -0.36 | % | 1.72 | % |
| S&P 500 Index (reflects no deduction for fees, expenses, or taxes) | 17.88 | % | 14.42 | % | 14.82 | % |
| Morningstar Developed Markets ex-North America Target Market Exposure Index (Net) (reflects no deduction for fees, expenses, or taxes) | 31.61 | % | 9.00 | % | 7.58 | % |
The performance information shown provides some indication of the risks of investing in the Fund by showing changes in the Fund’s performance from year to year and by showing how the Fund’s average annual returns compared with those of a broad-based securities market index and additional indices that the Adviser believes more closely reflects the market segments in which the Fund invests. Performance results include the effect of expense waiver/reduction arrangements for some or all of the periods shown. If such arrangements had not been in place, performance for those periods would have been lower. Performance prior to on or about July 1, 2019 reflects the Fund's results when managed by the former sub-adviser, Standard & Poor's Investment Advisory Services LLC. Performance prior to October 21, 2024 reflects the Fund's results when managed by the former sub-adviser, Goldman Sachs Asset Management, L.P. The Fund’s past performance is not necessarily an indication of how the Fund will perform in the future.
The returns shown in the bar chart and table do not include charges that will be imposed by variable insurance products. If these amounts were reflected, returns would be less than those shown.
Consistent with the Fund’s principal investment strategies, the Fund uses the 56% S&P 500 Index, 20% Bloomberg U.S. Aggregate Index, 24% Morningstar Developed Markets ex-North America Target Market Exposure Index (Net) as the Fund’s tertiary benchmark.
Annual Total Returns as of December 31
Class A
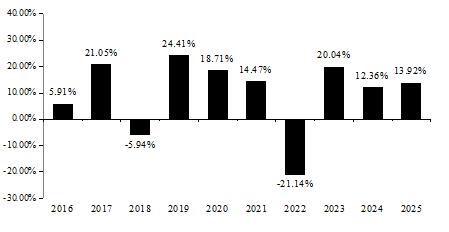
Best Quarter (ended 6/30/2020): 18.79%; Worst Quarter (ended 3/31/2020): -17.54%
Annual Total Returns as of December 31
Class I
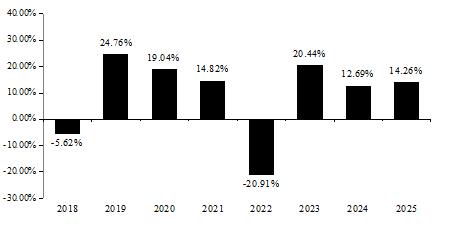
Best Quarter (ended 6/30/2020): 18.87%; Worst Quarter (ended 3/31/2020): -17.46%
| Average Annual Total Returns as of 12/31/2025 | ||||||
| 1 year | 5 year | 10 year | ||||
| JNL/JPMorgan Managed Growth Fund (Class A) | 13.92 | % | 6.76 | % | 9.47 | % |
| Morningstar Global Target Market Exposure Index (Net) (reflects no deduction for fees, expenses, or taxes) | 22.23 | % | 11.20 | % | 11.70 | % |
| Morningstar Moderately Aggressive Target Risk Index (reflects no deduction for fees, expenses, or taxes) | 18.45 | % | 7.94 | % | 9.59 | % |
| 56% S&P 500 Index, 20% Bloomberg U.S. Aggregate Index, 24% Morningstar Developed Markets ex-North America Target Market Exposure Index (Net) (reflects no deduction for fees, expenses, or taxes) | 18.98 | % | 10.21 | % | 10.79 | % |
| Bloomberg U.S. Aggregate Index (reflects no deduction for fees, expenses, or taxes) | 7.30 | % | -0.36 | % | 2.01 | % |
| S&P 500 Index (reflects no deduction for fees, expenses, or taxes) | 17.88 | % | 14.42 | % | 14.82 | % |
| Morningstar Developed Markets ex-North America Target Market Exposure Index (Net) (reflects no deduction for fees, expenses, or taxes) | 31.61 | % | 9.00 | % | 8.27 | % |
| Average Annual Total Returns as of 12/31/2025 | ||||||
| 1 year | 5 year | Life
of Class (September 25, 2017) | ||||
| JNL/JPMorgan Managed Growth Fund (Class I) | 14.26 | % | 7.09 | % | 9.26 | % |
| Morningstar Global Target Market Exposure Index (Net) (reflects no deduction for fees, expenses, or taxes) | 22.23 | % | 11.20 | % | 11.15 | % |
| Morningstar Moderately Aggressive Target Risk Index (reflects no deduction for fees, expenses, or taxes) | 18.45 | % | 7.94 | % | 8.79 | % |
| 56% S&P 500 Index, 20% Bloomberg U.S. Aggregate Index, 24% Morningstar Developed Markets ex-North America Target Market Exposure Index (Net) (reflects no deduction for fees, expenses, or taxes) | 18.98 | % | 10.21 | % | 10.58 | % |
| Bloomberg U.S. Aggregate Index (reflects no deduction for fees, expenses, or taxes) | 7.30 | % | -0.36 | % | 1.72 | % |
| S&P 500 Index (reflects no deduction for fees, expenses, or taxes) | 17.88 | % | 14.42 | % | 14.82 | % |
| Morningstar Developed Markets ex-North America Target Market Exposure Index (Net) (reflects no deduction for fees, expenses, or taxes) | 31.61 | % | 9.00 | % | 7.58 | % |
The performance information shown provides some indication of the risks of investing in the Fund by showing changes in the Fund’s performance from year to year and by showing how the Fund’s average annual returns compared with those of a broad-based securities market index and additional indices that the Adviser believes more closely reflects the market segments in which the Fund invests. Performance results include the effect of expense waiver/reduction arrangements for some or all of the periods shown. If such arrangements had not been in place, performance for those periods would have been lower. Performance prior to on or about July 1, 2019 reflects the Fund's results when managed by the former sub-adviser, Standard & Poor's Investment Advisory Services LLC. Performance prior to October 21, 2024 reflects the Fund's results when managed by the former sub-adviser, Goldman Sachs Asset Management, L.P. The Fund’s past performance is not necessarily an indication of how the Fund will perform in the future.
The returns shown in the bar chart and table do not include charges that will be imposed by variable insurance products. If these amounts were reflected, returns would be less than those shown.
Consistent with the Fund’s principal investment strategies, the Fund uses the 63% S&P 500 Index, 27% Morningstar Developed Markets ex-North America Target Market Exposure Index (Net), 10% Bloomberg U.S. Aggregate Index as the Fund’s tertiary benchmark.
Annual Total Returns as of December 31
Class A
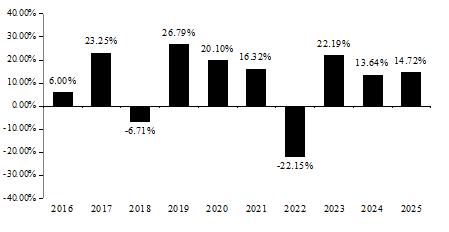
Best Quarter (ended 6/30/2020): 20.43%; Worst Quarter (ended 3/31/2020): -19.34%
Annual Total Returns as of December 31
Class I
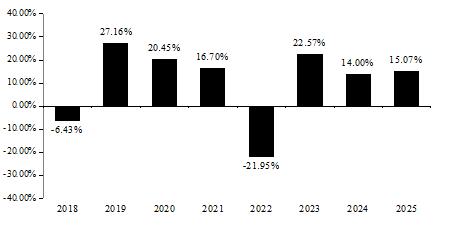
Best Quarter (ended 6/30/2020): 20.46%; Worst Quarter (ended 3/31/2020): -19.24%
| Average Annual Total Returns as of 12/31/2025 | ||||||
| 1 year | 5 year | 10 year | ||||
| JNL/JPMorgan Managed Aggressive Growth Fund (Class A) | 14.72 | % | 7.60 | % | 10.35 | % |
| Morningstar Global Target Market Exposure Index (Net) (reflects no deduction for fees, expenses, or taxes) | 22.23 | % | 11.20 | % | 11.70 | % |
| Morningstar Aggressive Target Risk Index (reflects no deduction for fees, expenses, or taxes) | 20.43 | % | 9.59 | % | 10.89 | % |
| 63% S&P 500 Index, 27% Morningstar Developed Markets ex-North America Target Market Exposure Index (Net), 10% Bloomberg U.S. Aggregate Index (reflects no deduction for fees, expenses, or taxes) | 20.48 | % | 11.54 | % | 11.85 | % |
| Bloomberg U.S. Aggregate Index (reflects no deduction for fees, expenses, or taxes) | 7.30 | % | -0.36 | % | 2.01 | % |
| S&P 500 Index (reflects no deduction for fees, expenses, or taxes) | 17.88 | % | 14.42 | % | 14.82 | % |
| Morningstar Developed Markets ex-North America Target Market Exposure Index (Net) (reflects no deduction for fees, expenses, or taxes) | 31.61 | % | 9.00 | % | 8.27 | % |
| Average Annual Total Returns as of 12/31/2025 | ||||||
| 1 year | 5 year | Life
of Class (September 25, 2017) | ||||
| JNL/JPMorgan Managed Aggressive Growth Fund (Class I) | 15.07 | % | 7.93 | % | 10.14 | % |
| Morningstar Global Target Market Exposure Index (Net) (reflects no deduction for fees, expenses, or taxes) | 22.23 | % | 11.20 | % | 11.15 | % |
| Morningstar Aggressive Target Risk Index (reflects no deduction for fees, expenses, or taxes) | 20.43 | % | 9.59 | % | 9.99 | % |
| 63% S&P 500 Index, 27% Morningstar Developed Markets ex-North America Target Market Exposure Index (Net), 10% Bloomberg U.S. Aggregate Index (reflects no deduction for fees, expenses, or taxes) | 20.48 | % | 11.54 | % | 11.64 | % |
| Bloomberg U.S. Aggregate Index (reflects no deduction for fees, expenses, or taxes) | 7.30 | % | -0.36 | % | 1.72 | % |
| S&P 500 Index (reflects no deduction for fees, expenses, or taxes) | 17.88 | % | 14.42 | % | 14.82 | % |
| Morningstar Developed Markets ex-North America Target Market Exposure Index (Net) (reflects no deduction for fees, expenses, or taxes) | 31.61 | % | 9.00 | % | 7.58 | % |
The performance information shown provides some indication of the risks of investing in the Fund by showing changes in the Fund’s performance from year to year and by showing how the Fund’s average annual returns compared with those of a broad-based securities market index and additional indices that the Adviser believes more closely reflects the market segments in which the Fund invests. The Fund’s past performance is not necessarily an indication of how the Fund will perform in the future.
The returns shown in the bar chart and table do not include charges that will be imposed by variable insurance products. If these amounts were reflected, returns would be less than those shown.
The performance data includes the performance of the Fund, then a series of the Jackson Variable Series Trust for periods before the Fund’s registration statement became effective. Effective April 27, 2020, the Fund was combined with JNL/Nicholas Convertible Arbitrage Fund (the “Acquired Fund”), a series of Jackson Variable Series Trust, with the Fund as the surviving Fund. The performance shown is the Fund's historic performance and does not reflect the performance of the Acquired Fund.
Consistent with the Fund’s principal investment strategies, the Fund uses the 20% Morningstar® Global Target Market Exposure Index (Net), 80% Bloomberg U.S. Aggregate Index as the Fund’s tertiary benchmark.
Annual Total Returns as of December 31
Class A
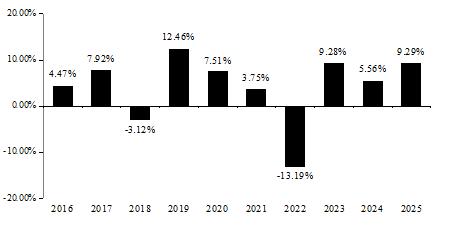
Best Quarter (ended 6/30/2020): 8.27%; Worst Quarter (ended 3/31/2020): -8.21%
Annual Total Returns as of December 31
Class I
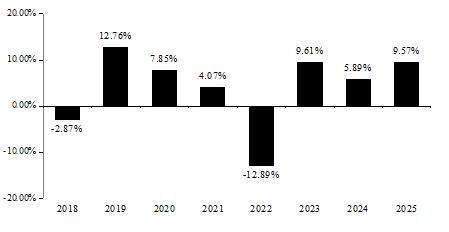
Best Quarter (ended 6/30/2020): 8.29%; Worst Quarter (ended 3/31/2020): -8.08%
| Average Annual Total Returns as of 12/31/2025 | ||||||
| 1 year | 5 year | 10 year | ||||
| JNL Conservative Allocation Fund (Class A) | 9.29 | % | 2.57 | % | 4.13 | % |
| Bloomberg U.S. Aggregate Index (reflects no deduction for fees, expenses, or taxes) | 7.30 | % | -0.36 | % | 2.01 | % |
| Morningstar Conservative Target Risk Index (reflects no deduction for fees, expenses, or taxes) | 10.40 | % | 1.81 | % | 3.98 | % |
| 20% Morningstar Global Target Market Exposure Index (Net), 80% Bloomberg U.S. Aggregate Index (reflects no deduction for fees, expenses, or taxes) | 10.22 | % | 1.94 | % | 4.02 | % |
| Morningstar Global Target Market Exposure Index (Net) (reflects no deduction for fees, expenses, or taxes) | 22.23 | % | 11.20 | % | 11.70 | % |
| Average Annual Total Returns as of 12/31/2025 | ||||||
| 1 year | 5 year | Life
of Class (September 25, 2017) | ||||
| JNL Conservative Allocation Fund (Class I) | 9.57 | % | 2.88 | % | 3.99 | % |
| Bloomberg U.S. Aggregate Index (reflects no deduction for fees, expenses, or taxes) | 7.30 | % | -0.36 | % | 1.72 | % |
| Morningstar Conservative Target Risk Index (reflects no deduction for fees, expenses, or taxes) | 10.40 | % | 1.81 | % | 3.58 | % |
| 20% Morningstar Global Target Market Exposure Index (Net), 80% Bloomberg U.S. Aggregate Index (reflects no deduction for fees, expenses, or taxes) | 10.22 | % | 1.94 | % | 3.70 | % |
| Morningstar Global Target Market Exposure Index (Net) (reflects no deduction for fees, expenses, or taxes) | 22.23 | % | 11.20 | % | 11.15 | % |
The performance information shown provides some indication of the risks of investing in the Fund by showing changes in the Fund’s performance from year to year and by showing how the Fund’s average annual returns compared with those of a broad-based securities market index and additional indices that the Adviser believes more closely reflects the market segments in which the Fund invests. The Fund’s past performance is not necessarily an indication of how the Fund will perform in the future.
The returns shown in the bar chart and table do not include charges that will be imposed by variable insurance products. If these amounts were reflected, returns would be less than those shown.
The performance data includes the performance of the Fund, then a series of the Jackson Variable Series Trust for periods before the Fund’s registration statement became effective. Effective April 27, 2020, the Fund was combined with JNL Institutional Alt 50 Fund (the "Acquired Fund"), a series of JNL Series Trust, with the Fund as the surviving Fund. The performance shown is the Fund's historic performance and does not reflect the performance of the Acquired Fund.
Consistent with the Fund’s principal investment strategies, the Fund uses the 40% Morningstar® Global Target Market Exposure Index (Net), 60% Bloomberg U.S. Aggregate Index as the Fund’s tertiary benchmark.
Annual Total Returns as of December 31
Class A
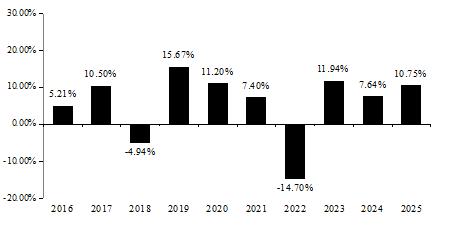
Best Quarter (ended 6/30/2020): 11.63%; Worst Quarter (ended 3/31/2020): -11.47%
Annual Total Returns as of December 31
Class I
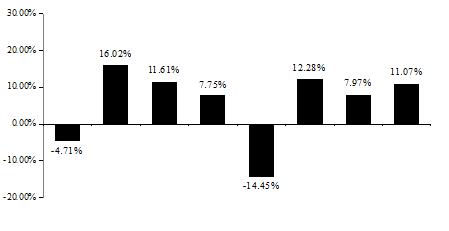
Best Quarter (ended 6/30/2020): 11.78%; Worst Quarter (ended 3/31/2020): -11.40%
| Average Annual Total Returns as of 12/31/2025 | ||||||
| 1 year | 5 year | 10 year | ||||
| JNL Moderate Allocation Fund (Class A) | 10.75 | % | 4.10 | % | 5.68 | % |
| Bloomberg U.S. Aggregate Index (reflects no deduction for fees, expenses, or taxes) | 7.30 | % | -0.36 | % | 2.01 | % |
| Morningstar Moderately Conservative Target Risk Index (reflects no deduction for fees, expenses, or taxes) | 12.87 | % | 4.06 | % | 6.10 | % |
| 40% Morningstar Global Target Market Exposure Index (Net), 60% Bloomberg U.S. Aggregate Index (reflects no deduction for fees, expenses, or taxes) | 13.17 | % | 4.26 | % | 6.01 | % |
| Morningstar Global Target Market Exposure Index (Net) (reflects no deduction for fees, expenses, or taxes) | 22.23 | % | 11.20 | % | 11.70 | % |
| Average Annual Total Returns as of 12/31/2025 | ||||||
| 1 year | 5 year | Life
of Class (September 25, 2017) | ||||
| JNL Moderate Allocation Fund (Class I) | 11.07 | % | 4.42 | % | 5.57 | % |
| Bloomberg U.S. Aggregate Index (reflects no deduction for fees, expenses, or taxes) | 7.30 | % | -0.36 | % | 1.72 | % |
| Morningstar Moderately Conservative Target Risk Index (reflects no deduction for fees, expenses, or taxes) | 12.87 | % | 4.06 | % | 5.60 | % |
| 40% Morningstar Global Target Market Exposure Index (Net), 60% Bloomberg U.S. Aggregate Index (reflects no deduction for fees, expenses, or taxes) | 13.17 | % | 4.26 | % | 5.64 | % |
| Morningstar Global Target Market Exposure Index (Net) (reflects no deduction for fees, expenses, or taxes) | 22.23 | % | 11.20 | % | 11.15 | % |
The performance information shown provides some indication of the risks of investing in the Fund by showing changes in the Fund’s performance from year to year and by showing how the Fund’s average annual returns compared with those of a broad-based securities market index and additional indices that the Adviser believes more closely reflects the market segments in which the Fund invests. The Fund’s past performance is not necessarily an indication of how the Fund will perform in the future.
The returns shown in the bar chart and table do not include charges that will be imposed by variable insurance products. If these amounts were reflected, returns would be less than those shown.
Effective September 25, 2017, the Fund was combined with the JNAM Guidance – Moderate Growth Fund, a series of Jackson Variable Series Trust, with the Fund as the surviving Fund. The performance shown is the Fund’s historic performance and does not reflect the performance of the JNAM Guidance – Moderate Growth Fund.
The performance data includes the performance of the Fund, then a series of the Jackson Variable Series Trust for periods before the Fund’s registration statement became effective. Effective April 27, 2020, the Fund was combined with JNL Institutional Alt 25 Fund, a series of JNL Series Trust, with the Fund as the surviving Fund. The performance shown is the Fund's historic performance and does not reflect the performance of the JNL Institutional Alt 25 Fund.
Effective April 26, 2021, the Fund was combined with the JNL/AQR Managed Futures Strategy Fund (“Acquired Fund”), with the Fund as the surviving Fund. The performance shown is the Fund’s historical performance and does not reflect the performance of the Acquired Fund.
Consistent with the Fund’s principal investment strategies, the Fund uses the 60% Morningstar® Global Target Market Exposure Index (Net), 40% Bloomberg U.S. Aggregate Index as the Fund’s tertiary benchmark.
Annual Total Returns as of December 31
Class A
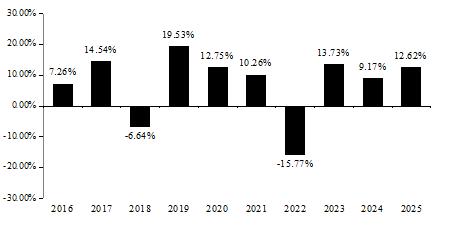
Best Quarter (ended 6/30/2020): 14.77%; Worst Quarter (ended 3/31/2020): -15.95%
Annual Total Returns as of December 31
Class I
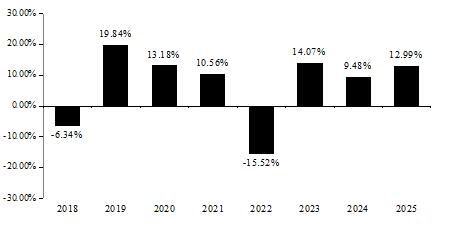
Best Quarter (ended 6/30/2020): 14.89%; Worst Quarter (ended 3/31/2020): -15.84%
| Average Annual Total Returns as of 12/31/2025 | ||||||
| 1 year | 5 year | 10 year | ||||
| JNL Moderate Growth Allocation Fund (Class A) | 12.62 | % | 5.36 | % | 7.22 | % |
| Morningstar Global Target Market Exposure Index (Net) (reflects no deduction for fees, expenses, or taxes) | 22.23 | % | 11.20 | % | 11.70 | % |
| Morningstar Moderate Target Risk Index (reflects no deduction for fees, expenses, or taxes) | 15.95 | % | 5.95 | % | 7.83 | % |
| 60% Morningstar Global Target Market Exposure Index (Net), 40% Bloomberg U.S. Aggregate Index (reflects no deduction for fees, expenses, or taxes) | 16.16 | % | 6.57 | % | 7.95 | % |
| Bloomberg U.S. Aggregate Index (reflects no deduction for fees, expenses, or taxes) | 7.30 | % | -0.36 | % | 2.01 | % |
| Average Annual Total Returns as of 12/31/2025 | ||||||
| 1 year | 5 year | Life
of Class (September 25, 2017) | ||||
| JNL Moderate Growth Allocation Fund (Class I) | 12.99 | % | 5.68 | % | 6.85 | % |
| Morningstar Global Target Market Exposure Index (Net) (reflects no deduction for fees, expenses, or taxes) | 22.23 | % | 11.20 | % | 11.15 | % |
| Morningstar Moderate Target Risk Index (reflects no deduction for fees, expenses, or taxes) | 15.95 | % | 5.95 | % | 7.18 | % |
| 60% Morningstar Global Target Market Exposure Index (Net), 40% Bloomberg U.S. Aggregate Index (reflects no deduction for fees, expenses, or taxes) | 16.16 | % | 6.57 | % | 7.53 | % |
| Bloomberg U.S. Aggregate Index (reflects no deduction for fees, expenses, or taxes) | 7.30 | % | -0.36 | % | 1.72 | % |
The performance information shown provides some indication of the risks of investing in the Fund by showing changes in the Fund’s performance from year to year and by showing how the Fund’s average annual returns compared with those of a broad-based securities market index and additional indices that the Adviser believes more closely reflects the market segments in which the Fund invests. The Fund’s past performance is not necessarily an indication of how the Fund will perform in the future.
The returns shown in the bar chart and table do not include charges that will be imposed by variable insurance products. If these amounts were reflected, returns would be less than those shown.
Effective September 25, 2017, the Fund was combined with the JNAM Guidance – Growth Fund (the “Acquired Fund”), a series of Jackson Variable Series Trust, with the Fund as the surviving Fund. The performance shown is the Fund’s historic performance and does not reflect the performance of the Acquired Fund.
Effective April 25, 2022, the Fund was combined with the JNL/Franklin Templeton Growth Allocation Fund (“Acquired Fund”), with the Fund as the surviving Fund. The performance shown is the Fund’s historical performance and does not reflect the performance of the Acquired Fund.
Consistent with the Fund’s principal investment strategies, the Fund uses the 80% Morningstar® Global Target Market Exposure Index (Net), 20% Bloomberg U.S. Aggregate Index as the Fund’s tertiary benchmark.
Annual Total Returns as of December 31
Class A
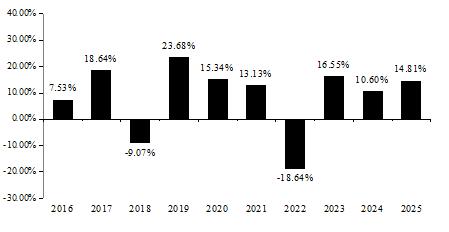
Best Quarter (ended 6/30/2020): 18.77%; Worst Quarter (ended 3/31/2020): -20.33%
Annual Total Returns as of December 31
Class I
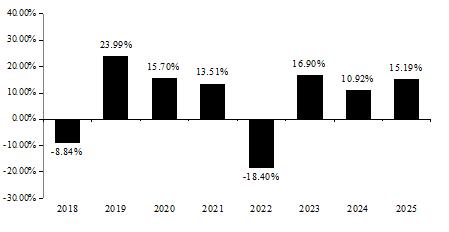
Best Quarter (ended 6/30/2020): 18.78%; Worst Quarter (ended 3/31/2020): -20.20%
| Average Annual Total Returns as of 12/31/2025 | ||||||
| 1 year | 5 year | 10 year | ||||
| JNL Growth Allocation Fund (Class A) | 14.81 | % | 6.38 | % | 8.47 | % |
| Morningstar Global Target Market Exposure Index (Net) (reflects no deduction for fees, expenses, or taxes) | 22.23 | % | 11.20 | % | 11.70 | % |
| Morningstar Moderately Aggressive Target Risk Index (reflects no deduction for fees, expenses, or taxes) | 18.45 | % | 7.94 | % | 9.59 | % |
| 80% Morningstar Global Target Market Exposure Index (Net), 20% Bloomberg U.S. Aggregate Index (reflects no deduction for fees, expenses, or taxes) | 19.18 | % | 8.89 | % | 9.85 | % |
| Bloomberg U.S. Aggregate Index (reflects no deduction for fees, expenses, or taxes) | 7.30 | % | -0.36 | % | 2.01 | % |
| Average Annual Total Returns as of 12/31/2025 | ||||||
| 1 year | 5 year | Life
of Class (September 25, 2017) | ||||
| JNL Growth Allocation Fund (Class I) | 15.19 | % | 6.71 | % | 7.98 | % |
| Morningstar Global Target Market Exposure Index (Net) (reflects no deduction for fees, expenses, or taxes) | 22.23 | % | 11.20 | % | 11.15 | % |
| Morningstar Moderately Aggressive Target Risk Index (reflects no deduction for fees, expenses, or taxes) | 18.45 | % | 7.94 | % | 8.79 | % |
| 80% Morningstar Global Target Market Exposure Index (Net), 20% Bloomberg U.S. Aggregate Index (reflects no deduction for fees, expenses, or taxes) | 19.18 | % | 8.89 | % | 9.37 | % |
| Bloomberg U.S. Aggregate Index (reflects no deduction for fees, expenses, or taxes) | 7.30 | % | -0.36 | % | 1.72 | % |
The performance information shown provides some indication of the risks of investing in the Fund by showing changes in the Fund’s performance from year to year and by showing how the Fund’s average annual returns compared with those of a broad-based securities market index and additional indices that the Adviser believes more closely reflects the market segments in which the Fund invests. The Fund’s past performance is not necessarily an indication of how the Fund will perform in the future.
The returns shown in the bar chart and table do not include charges that will be imposed by variable insurance products. If these amounts were reflected, returns would be less than those shown.
Effective September 25, 2017, the Fund was combined with the JNAM Guidance – Equity 100 Fund and JNAM Guidance – Maximum Growth Fund (together, the “Acquired Funds”), series of Jackson Variable Series Trust, with the Fund as the surviving Fund. The performance shown is the Fund’s historic performance and does not reflect the performance of the Acquired Funds.
Consistent with the Fund’s principal investment strategies, the Fund uses the 90% Morningstar® Global Target Market Exposure Index (Net), 10% Bloomberg U.S. Aggregate Index as the Fund’s tertiary benchmark.
Annual Total Returns as of December 31
Class A
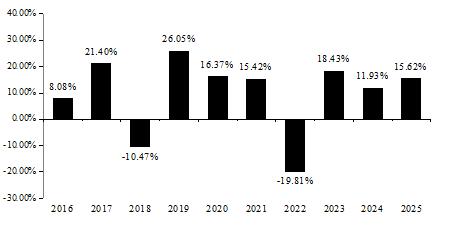
Best Quarter (ended 6/30/2020): 21.48%; Worst Quarter (ended 3/31/2020): -23.47%
Annual Total Returns as of December 31
Class I
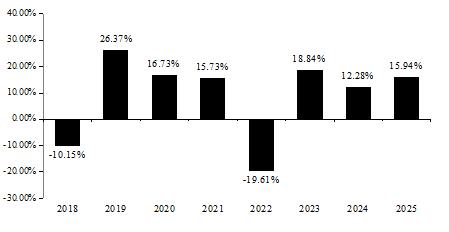
Best Quarter (ended 6/30/2020): 21.49%; Worst Quarter (ended 3/31/2020): -23.37%
| Average Annual Total Returns as of 12/31/2025 | ||||||
| 1 year | 5 year | 10 year | ||||
| JNL Aggressive Growth Allocation Fund (Class A) | 15.62 | % | 7.24 | % | 9.35 | % |
| Morningstar Global Target Market Exposure Index (Net) (reflects no deduction for fees, expenses, or taxes) | 22.23 | % | 11.20 | % | 11.70 | % |
| Morningstar Aggressive Target Risk Index (reflects no deduction for fees, expenses, or taxes) | 20.43 | % | 9.59 | % | 10.89 | % |
| 90% Morningstar Global Target Market Exposure Index (Net), 10% Bloomberg U.S. Aggregate Index (reflects no deduction for fees, expenses, or taxes) | 20.70 | % | 10.04 | % | 10.78 | % |
| Bloomberg U.S. Aggregate Index (reflects no deduction for fees, expenses, or taxes) | 7.30 | % | -0.36 | % | 2.01 | % |
| Average Annual Total Returns as of 12/31/2025 | ||||||
| 1 year | 5 year | Life
of Class (September 25, 2017) | ||||
| JNL Aggressive Growth Allocation Fund (Class I) | 15.94 | % | 7.56 | % | 8.74 | % |
| Morningstar Global Target Market Exposure Index (Net) (reflects no deduction for fees, expenses, or taxes) | 22.23 | % | 11.20 | % | 11.15 | % |
| Morningstar Aggressive Target Risk Index (reflects no deduction for fees, expenses, or taxes) | 20.43 | % | 9.59 | % | 9.99 | % |
| 90% Morningstar Global Target Market Exposure Index (Net), 10% Bloomberg U.S. Aggregate Index (reflects no deduction for fees, expenses, or taxes) | 20.70 | % | 10.04 | % | 10.26 | % |
| Bloomberg U.S. Aggregate Index (reflects no deduction for fees, expenses, or taxes) | 7.30 | % | -0.36 | % | 1.72 | % |
The performance information shown provides some indication of the risks of investing in the Fund by showing changes in the Fund’s performance from year to year and by showing how the Fund’s average annual returns compared with those of a broad-based securities market index. Performance results include the effect of expense waiver/reduction arrangements for some or all of the periods shown. If such arrangements had not been in place, performance for those periods would have been lower . The Fund’s past performance is not necessarily an indication of how the Fund will perform in the future.
The returns shown in the bar chart and table do not include charges that will be imposed by variable insurance products. If these amounts were reflected, returns would be less than those shown.
Annual Total Returns as of December 31
Class I
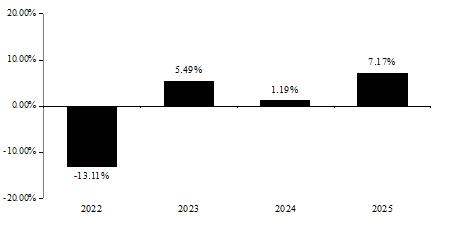
Best Quarter (ended 12/31/2023): 6.71%; Worst Quarter (ended 3/31/2022): -5.86%
| Average Annual Total Returns as of 12/31/2025 | ||||
| 1 year | Life
of Class (April 26, 2021) | |||
| JNL Bond Index Fund (Class I) | 7.17 | % | 0.02 | % |
| Bloomberg U.S. Aggregate Index (reflects no deduction for fees, expenses, or taxes) | 7.30 | % | 0.14 | % |
The performance information shown provides some indication of the risks of investing in the Fund by showing changes in the Fund’s performance from year to year and by showing how the Fund’s average annual returns compared with those of a broad-based securities market index. Performance results include the effect of expense waiver/reduction arrangements for some or all of the periods shown. If such arrangements had not been in place, performance for those periods would have been lower . The Fund’s past performance is not necessarily an indication of how the Fund will perform in the future.
The returns shown in the bar chart and table do not include charges that will be imposed by variable insurance products. If these amounts were reflected, returns would be less than those shown.
Annual Total Returns as of December 31
Class I
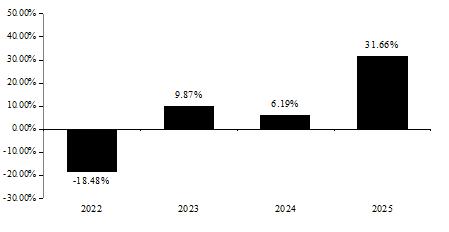
Best Quarter (ended 6/30/2025): 11.32%; Worst Quarter (ended 9/30/2022): -11.01%
| Average Annual Total Returns as of 12/31/2025 | ||||
| 1 year | Life of Class (April 26, 2021) | |||
| JNL Emerging Markets Index Fund (Class I) | 31.66 | % | 3.07 | % |
| Morningstar Emerging Markets Target Market Exposure Index (Net) (reflects no deduction for fees, expenses, or taxes) | 31.62 | % | 3.71 | % |
The performance information shown provides some indication of the risks of investing in the Fund by showing changes in the Fund’s performance from year to year and by showing how the Fund’s average annual returns compared with those of a broad-based securities market index. Performance results include the effect of expense waiver/reduction arrangements for some or all of the periods shown. If such arrangements had not been in place, performance for those periods would have been lower . The Fund’s past performance is not necessarily an indication of how the Fund will perform in the future.
The returns shown in the bar chart and table do not include charges that will be imposed by variable insurance products. If these amounts were reflected, returns would be less than those shown.
Annual Total Returns as of December 31
Class I
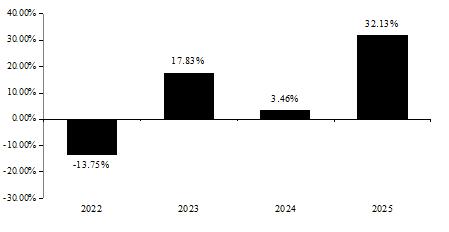
Best Quarter (ended 12/31/2022): 18.65%; Worst Quarter (ended 6/30/2022): -13.42%
| Average Annual Total Returns as of 12/31/2025 | ||||
| 1 year | Life
of Class (April 26, 2021) | |||
| JNL International Index Fund (Class I) | 32.13 | % | 7.93 | % |
| Morningstar Developed Markets ex-North America Target Market Exposure Index (Net) (reflects no deduction for fees, expenses, or taxes) | 31.61 | % | 7.97 | % |
The performance information shown provides some indication of the risks of investing in the Fund by showing changes in the Fund’s performance from year to year and by showing how the Fund’s average annual returns compared with those of a broad-based securities market index and an additional index that the Adviser believes more closely reflects the market segments in which the Fund invests. Performance results include the effect of expense waiver/reduction arrangements for some or all of the periods shown. If such arrangements had not been in place, performance for those periods would have been lower The Fund’s past performance is not necessarily an indication of how the Fund will perform in the future.
The returns shown in the bar chart and table do not include charges that will be imposed by variable insurance products. If these amounts were reflected, returns would be less than those shown.
Annual Total Returns as of December 31
Class I
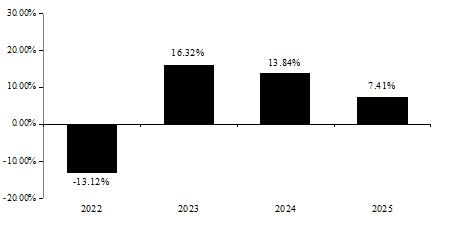
Best Quarter (ended 12/31/2023): 11.64%; Worst Quarter (ended 6/30/2022): -15.41%
| Average Annual Total Returns as of 12/31/2025 | ||||
| 1 year | Life
of Class (April 26, 2021) | |||
| JNL Mid Cap Index Fund (Class I) | 7.41 | % | 5.59 | % |
| Morningstar US Market Extended Index (reflects no deduction for fees, expenses, or taxes) | 17.21 | % | 11.36 | % |
| S&P MidCap 400 Index (reflects no deduction for fees, expenses, or taxes) | 7.50 | % | 5.67 | % |
The performance information shown provides some indication of the risks of investing in the Fund by showing changes in the Fund’s performance from year to year and by showing how the Fund’s average annual returns compared with those of a broad-based securities market index and an additional index that the Adviser believes more closely reflects the market segments in which the Fund invests. Performance results include the effect of expense waiver/reduction arrangements for some or all of the periods shown. If such arrangements had not been in place, performance for those periods would have been lower . The Fund’s past performance is not necessarily an indication of how the Fund will perform in the future.
The returns shown in the bar chart and table do not include charges that will be imposed by variable insurance products. If these amounts were reflected, returns would be less than those shown.
Annual Total Returns as of December 31
Class I
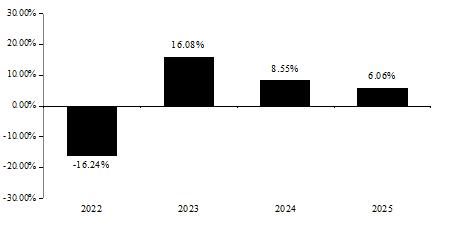
Best Quarter (ended 12/31/2023): 15.16%; Worst Quarter (ended 6/30/2022): -14.17%
| Average Annual Total Returns as of 12/31/2025 | ||||
| 1 year | Life
of Class (April 26, 2021) | |||
| JNL Small Cap Index Fund (Class I) | 6.06 | % | 3.45 | % |
| Morningstar US Market Extended Index (reflects no deduction for fees, expenses, or taxes) | 17.21 | % | 11.36 | % |
| S&P SmallCap 600 Index (reflects no deduction for fees, expenses, or taxes) | 6.02 | % | 3.51 | % |