The performance information shown provides some indication of the risks of investing in the Fund by showing changes in the Fund’s performance from year to year and by showing how the Fund’s average annual returns compared with those of a broad-based securities market index and an additional index that the Adviser believes more closely reflects the market segments in which the Fund invests. Performance results include the effect of expense waiver/reduction arrangements for some or all of the periods shown. If such arrangements had not been in place, performance for those periods would have been lower. The Fund’s past performance is not necessarily an indication of how the Fund will perform in the future.
Prior to September 19, 2016, the Fund was operated as a prime money market fund. Effective September 19, 2016, the Fund operates as a government money market fund and, as such, invests at least 99.5% of its total assets in cash, government securities and/or repurchase agreements that are “collateralized fully” (i.e., backed by cash or government securities). Performance prior to February 1, 2024 reflects the Fund’s results when managed by the former sub-adviser, Wellington Management Company LLP.
The 7-day yield of the Class I (formerly named Institutional Class) on December 31, 2025, was 3.62%.
The 7-day yield of the Class SL on December 31, 2025, was 3.72%.
Annual Total Returns as of December 31
Class I
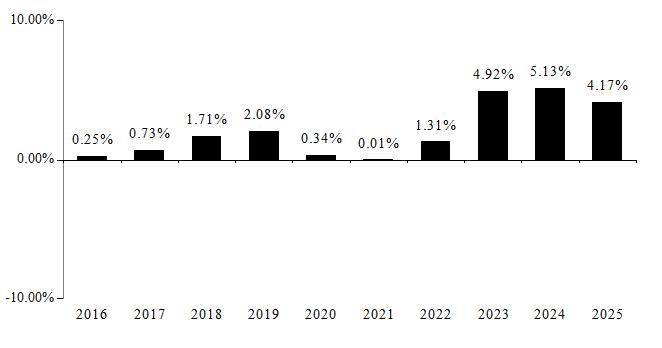
Best Quarter (ended 12/31/2023): 1.32%; Worst Quarter (ended 3/31/2022): 0.00%
Annual Total Returns as of December 31
Class SL
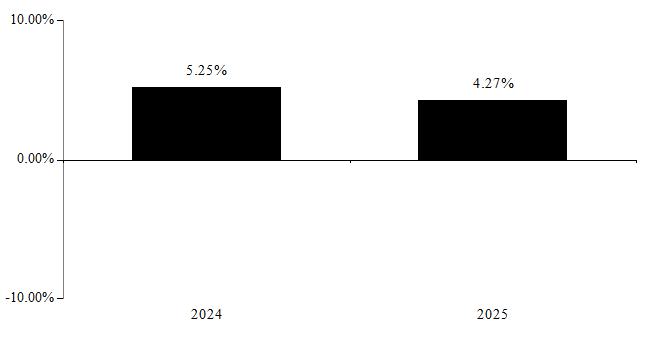
Best Quarter (ended 3/31/2024): 1.32%; Worst Quarter (ended 12/31/2025): 0.99%
| Average Annual Total Returns as of 12/31/2025 | ||||||
| 1 year | 5 year | 10 year | ||||
| JNL Government Money Market Fund (Class I) | 4.17 | % | 3.09 | % | 2.05 | % |
| Bloomberg U.S. Aggregate Index (reflects no deduction for fees, expenses, or taxes) | 7.30 | % | -0.36 | % | 2.01 | % |
| Bloomberg USD 1 Month Swap Rate Cash Deposit Index SPLICE (reflects no deduction for fees, expenses, or taxes)* | 4.38 | % | 3.32 | % | 2.20 | % |
| * | Index performance through December 30, 2020 reflects the performance of the FTSE U.S. Treasury Bill Index (1-month). Index performance beginning December 31, 2020 reflects the performance of the Bloomberg USD 1 Month Swap Rate Cash Deposit Index. |
| Average Annual Total Returns as of 12/31/2025 | ||||
| 1 year | Life of Class (May 01, 2023) | |||
| JNL Government Money Market Fund (Class SL) | 4.27 | % | 4.88 | % |
| Bloomberg U.S. Aggregate Index (reflects no deduction for fees, expenses, or taxes) | 7.30 | % | 3.87 | % |
| Bloomberg USD 1 Month Swap Rate Cash Deposit Index SPLICE (reflects no deduction for fees, expenses, or taxes)* | 4.38 | % | 5.03 | % |
| * | Index performance through December 30, 2020 reflects the performance of the FTSE U.S. Treasury Bill Index (1-month). Index performance beginning December 31, 2020 reflects the performance of the Bloomberg USD 1 Month Swap Rate Cash Deposit Index. |