v3.26.1
Pay vs Performance Disclosure - USD ($)
12 Months Ended
Dec. 31, 2025
Dec. 31, 2024
Dec. 31, 2023
Dec. 31, 2022
Dec. 31, 2021
Pay vs Performance Disclosure          
Pay vs Performance Disclosure, Table

In accordance with rules adopted by the SEC pursuant to the Dodd-Frank Wall Street Reform and Consumer Protection Act of 2010, we provide the following disclosure regarding executive compensation for our principal executive officer (“PEO”) and our other named executive officers (the “Non-PEO NEOs”) and Company performance for the fiscal years listed in the table below (the "Pay Versus Performance Table"). The Compensation Committee did not consider the pay versus performance disclosure below in making its executive compensation decisions for any of the years presented in this management proxy circular.


Value of Initial Fixed $100 Investment Based on:


Year
(a)

Summary Compensation Table Total for PEO
($)(b)
(1)

Compensation Actually Paid to PEO
($)(c)
(1)(2)(3)

Average Summary Compensation Table Total for Non-PEO NEOs
($)(d)
(1)

Average Compensation Actually Paid to Non-PEO NEOs
($)(e)
(1)(2)(3)

Total Shareholder Return
($)(f)

Peer Group Total Shareholder Return
($)(g)
(4)

Net Income
($) (in thousands)
(h)

Adjusted EBITDA
($) (in thousands)
(i)
(5)

2025

10,042,292

2,431,388

2,631,872

1,290,750

100.65

134.40

53,829

220,950

2024

8,776,305

(260,043)

2,550,342

234,958

129.23

119.14

64,087

209,849

2023

8,262,118

14,434,050

2,070,243

3,420,653

142.45

106.82

72,878

196,229

2022

7,302,035

2,777,206

2,128,543

1,218,186

114.93

91.35

74,051

184,129

2021

12,375,690

24,517,738

4,197,681

8,123,250

149.15

114.82

50,331

152,736


1.)
Matthijs Glastra was our PEO for each year presented. The individuals comprising the Non-PEO NEOs for each year presented are listed below.

2021

2022

2023

2024

2025

Robert J. Buckley

Robert J. Buckley

Robert J. Buckley

Robert J. Buckley

Robert J. Buckley

Brian S. Young

Brian S. Young

Brian S. Young

Brian S. Young

John Lesica


Michele D. Welsh

Michele D. Welsh

Michele D. Welsh

Charles G. Ravetto


Alexander Manganiello


Michele D. Welsh

2.)
The amounts shown for Compensation Actually Paid have been calculated in accordance with Item 402(v) of Regulation S-K and do not reflect compensation actually earned, realized, or received by the Company’s NEOs. These amounts reflect the Summary Compensation Table Total with certain adjustments as described in footnote 3 below.
3.)
Compensation Actually Paid reflects the exclusions and inclusions of certain amounts for the PEO and the Non-PEO NEOs as set forth below. Equity values are calculated in accordance with ASC Topic 718. Amounts in the Exclusion of Stock Awards column in the tables below are the totals from the Stock Awards and Option Awards columns set forth in the Summary Compensation Table, which reflect the fair market values of the equity awards as of their respective grant date.

Year

Summary Compensation Table Total for PEO
($)


Exclusion of Stock Awards for PEO
($)


Inclusion of Equity Values for PEO
($)


Compensation Actually Paid to PEO
($)


2025


10,042,292


8,275,535


664,631


2,431,388


2024


8,776,305


7,289,471


(1,746,877

)


(260,043

)

2023


8,262,118


6,662,770


12,834,702


14,434,050


2022


7,302,035


4,680,031


155,202


2,777,206


2021


12,375,690


9,970,028


22,112,076


24,517,738


Year

Average Summary Compensation Table Total for Non-PEO NEOs
($)


Average Exclusion of Stock Awards and Option Awards for Non-PEO NEOs
($)


Inclusion of Average Equity Values for Non-PEO NEOs
($)


Average Compensation Actually Paid to Non-PEO NEOs
($)


2025


2,631,872


1,782,038


440,916


1,290,750


2024


2,550,342


1,641,986


(673,398

)


234,958


2023


2,070,243


1,421,433


2,771,843


3,420,653


2022


2,128,543


1,261,595


351,238


1,218,186


2021


4,197,681


3,202,912


7,128,481


8,123,250


The amounts in the Inclusion of Equity Values in the tables above are derived from the amounts set forth in the following tables, using the fair market values of equity awards as of the end of the year for all outstanding unvested awards and as of the date of vesting for awards that vested during the year:


Year

Year-End Fair Value of Equity Awards Granted During Current Year That Remained Unvested as of Last Day of Current Year for PEO
($)


Change in Fair Value from Last Day of Prior Year to Last Day of Current Year of Unvested Equity Awards for PEO
($)


Change in Fair Value from Last Day of Prior Year to Vesting Date of Equity Awards That Vested During Current Year for PEO
($)


Fair Value as of Last Day of Prior Year of Equity Awards Forfeited During Current Year for PEO
($)


Total - Inclusion of Equity Values for PEO
($)


2025


6,668,182


(5,496,550

)


(507,001

)


—


664,631


2024


5,704,584


(7,030,584

)


(420,877

)


—


(1,746,877

)

2023


8,907,313


3,441,199


486,190


—


12,834,702


2022


5,386,925


(4,393,507

)


(838,216

)


—


155,202


2021


13,766,568


6,348,761


1,996,747


—


22,112,076


Year

Average Year-End Fair Value of Equity Awards Granted During Current Year That Remained Unvested as of Last Day of Current Year for Non-PEO NEOs
($)


Average Change in Fair Value from Last Day of Prior Year to Last Day of Current Year of Unvested Equity Awards for Non-PEO NEOs
($)


Average Change in Fair Value from Last Day of Prior Year to Vesting Date of Equity Awards That Vested During Current Year for Non-PEO NEOs
($)


Average Vesting-Date Fair Value of Equity Awards Granted During Year that Vested During Year
($)


Average Fair Value as of Last Day of Prior Year of Equity Awards Forfeited During Current Year for Non-PEO NEOs
($)


Total - Average Inclusion of Equity Values for Non-PEO NEOs
($)


2025


1,323,341


(603,096

)


(192,337

)


5,632


(92,624

)


440,916


2024


1,084,022


(1,495,594

)


(69,211

)


7,278


(199,893

)


(673,398

)

2023


1,900,304


770,506


101,033


—


—


2,771,843


2022


1,359,913


(848,158

)


(160,517

)


—


—


351,238


2021


4,376,963


1,523,957


1,227,561


—


—


7,128,481


4.)
The Peer Group TSR set forth in the Pay Versus Performance Table above utilizes Russell 2000 Index, which we also utilize in the stock performance graph required by Item 201(e) of Regulation S-K included in our Annual Report on Form 10-K for the year ended December 31, 2025. The comparison assumes that $100 was invested in the Company and in the Russell 2000 Index, respectively, for the period starting December 31, 2020 through the end of each year presented. Historical stock performance shown is not necessarily indicative of future stock performance.
5.)
We determined Adjusted EBITDA to be the most important financial performance measure used to link Company performance to Compensation Actually Paid to our PEO and Non-PEO NEOs in 2025. As described in the Compensation Discussion and Analysis section of this management proxy circular, Adjusted EBITDA is a non-GAAP financial performance measure used in our Senior Management Incentive Plan. The Company defines Adjusted EBITDA as income before deducting interest (income) expense, income tax provision (benefit), depreciation, amortization, non-cash share-based compensation, inventory fair value adjustments related to business acquisitions, inventory related charges associated with product line closures, restructuring, acquisition and related costs, discrete costs related to the planning and design phase of a Financial and Operation system implementation, charges
related to an insurance recovery, officer transition costs, cost directly related to COVID-19 testing, and other non-operating (income) expense items, including foreign exchange transaction (gains) losses, costs related to our debt refinancing and net periodic pension costs of the Company’s frozen U.K. defined benefit pension plan. A reconciliation of the Adjusted EBITDA to the most comparable GAAP financial measure is provided in the tables at the end of the Company’s Annual Report for the year ended December 31, 2025. Adjusted EBITDA may not have been the most important financial performance measure for other fiscal years presented and we may determine a different financial performance measure to be the most important financial performance measure in future years.
       
Company Selected Measure Name Adjusted EBITDA        
Named Executive Officers, Footnote
1.)
Matthijs Glastra was our PEO for each year presented. The individuals comprising the Non-PEO NEOs for each year presented are listed below.

2021

2022

2023

2024

2025

Robert J. Buckley

Robert J. Buckley

Robert J. Buckley

Robert J. Buckley

Robert J. Buckley

Brian S. Young

Brian S. Young

Brian S. Young

Brian S. Young

John Lesica


Michele D. Welsh

Michele D. Welsh

Michele D. Welsh

Charles G. Ravetto


Alexander Manganiello


Michele D. Welsh

       
Peer Group Issuers, Footnote
4.)
The Peer Group TSR set forth in the Pay Versus Performance Table above utilizes Russell 2000 Index, which we also utilize in the stock performance graph required by Item 201(e) of Regulation S-K included in our Annual Report on Form 10-K for the year ended December 31, 2025. The comparison assumes that $100 was invested in the Company and in the Russell 2000 Index, respectively, for the period starting December 31, 2020 through the end of each year presented. Historical stock performance shown is not necessarily indicative of future stock performance.
       
PEO Total Compensation Amount $ 10,042,292 $ 8,776,305 $ 8,262,118 $ 7,302,035 $ 12,375,690
PEO Actually Paid Compensation Amount $ 2,431,388 (260,043) 14,434,050 2,777,206 24,517,738
Adjustment To PEO Compensation, Footnote
3.)
Compensation Actually Paid reflects the exclusions and inclusions of certain amounts for the PEO and the Non-PEO NEOs as set forth below. Equity values are calculated in accordance with ASC Topic 718. Amounts in the Exclusion of Stock Awards column in the tables below are the totals from the Stock Awards and Option Awards columns set forth in the Summary Compensation Table, which reflect the fair market values of the equity awards as of their respective grant date.

Year

Summary Compensation Table Total for PEO
($)


Exclusion of Stock Awards for PEO
($)


Inclusion of Equity Values for PEO
($)


Compensation Actually Paid to PEO
($)


2025


10,042,292


8,275,535


664,631


2,431,388


2024


8,776,305


7,289,471


(1,746,877

)


(260,043

)

2023


8,262,118


6,662,770


12,834,702


14,434,050


2022


7,302,035


4,680,031


155,202


2,777,206


2021


12,375,690


9,970,028


22,112,076


24,517,738


The amounts in the Inclusion of Equity Values in the tables above are derived from the amounts set forth in the following tables, using the fair market values of equity awards as of the end of the year for all outstanding unvested awards and as of the date of vesting for awards that vested during the year:


Year

Year-End Fair Value of Equity Awards Granted During Current Year That Remained Unvested as of Last Day of Current Year for PEO
($)


Change in Fair Value from Last Day of Prior Year to Last Day of Current Year of Unvested Equity Awards for PEO
($)


Change in Fair Value from Last Day of Prior Year to Vesting Date of Equity Awards That Vested During Current Year for PEO
($)


Fair Value as of Last Day of Prior Year of Equity Awards Forfeited During Current Year for PEO
($)


Total - Inclusion of Equity Values for PEO
($)


2025


6,668,182


(5,496,550

)


(507,001

)


—


664,631


2024


5,704,584


(7,030,584

)


(420,877

)


—


(1,746,877

)

2023


8,907,313


3,441,199


486,190


—


12,834,702


2022


5,386,925


(4,393,507

)


(838,216

)


—


155,202


2021


13,766,568


6,348,761


1,996,747


—


22,112,076


Non-PEO NEO Average Total Compensation Amount $ 2,631,872 2,550,342 2,070,243 2,128,543 4,197,681
Non-PEO NEO Average Compensation Actually Paid Amount $ 1,290,750 234,958 3,420,653 1,218,186 8,123,250
Adjustment to Non-PEO NEO Compensation Footnote
3.)
Compensation Actually Paid reflects the exclusions and inclusions of certain amounts for the PEO and the Non-PEO NEOs as set forth below. Equity values are calculated in accordance with ASC Topic 718. Amounts in the Exclusion of Stock Awards column in the tables below are the totals from the Stock Awards and Option Awards columns set forth in the Summary Compensation Table, which reflect the fair market values of the equity awards as of their respective grant date.

Year

Average Summary Compensation Table Total for Non-PEO NEOs
($)


Average Exclusion of Stock Awards and Option Awards for Non-PEO NEOs
($)


Inclusion of Average Equity Values for Non-PEO NEOs
($)


Average Compensation Actually Paid to Non-PEO NEOs
($)


2025


2,631,872


1,782,038


440,916


1,290,750


2024


2,550,342


1,641,986


(673,398

)


234,958


2023


2,070,243


1,421,433


2,771,843


3,420,653


2022


2,128,543


1,261,595


351,238


1,218,186


2021


4,197,681


3,202,912


7,128,481


8,123,250


Year

Average Year-End Fair Value of Equity Awards Granted During Current Year That Remained Unvested as of Last Day of Current Year for Non-PEO NEOs
($)


Average Change in Fair Value from Last Day of Prior Year to Last Day of Current Year of Unvested Equity Awards for Non-PEO NEOs
($)


Average Change in Fair Value from Last Day of Prior Year to Vesting Date of Equity Awards That Vested During Current Year for Non-PEO NEOs
($)


Average Vesting-Date Fair Value of Equity Awards Granted During Year that Vested During Year
($)


Average Fair Value as of Last Day of Prior Year of Equity Awards Forfeited During Current Year for Non-PEO NEOs
($)


Total - Average Inclusion of Equity Values for Non-PEO NEOs
($)


2025


1,323,341


(603,096

)


(192,337

)


5,632


(92,624

)


440,916


2024


1,084,022


(1,495,594

)


(69,211

)


7,278


(199,893

)


(673,398

)

2023


1,900,304


770,506


101,033


—


—


2,771,843


2022


1,359,913


(848,158

)


(160,517

)


—


—


351,238


2021


4,376,963


1,523,957


1,227,561


—


—


7,128,481


Compensation Actually Paid vs. Total Shareholder Return

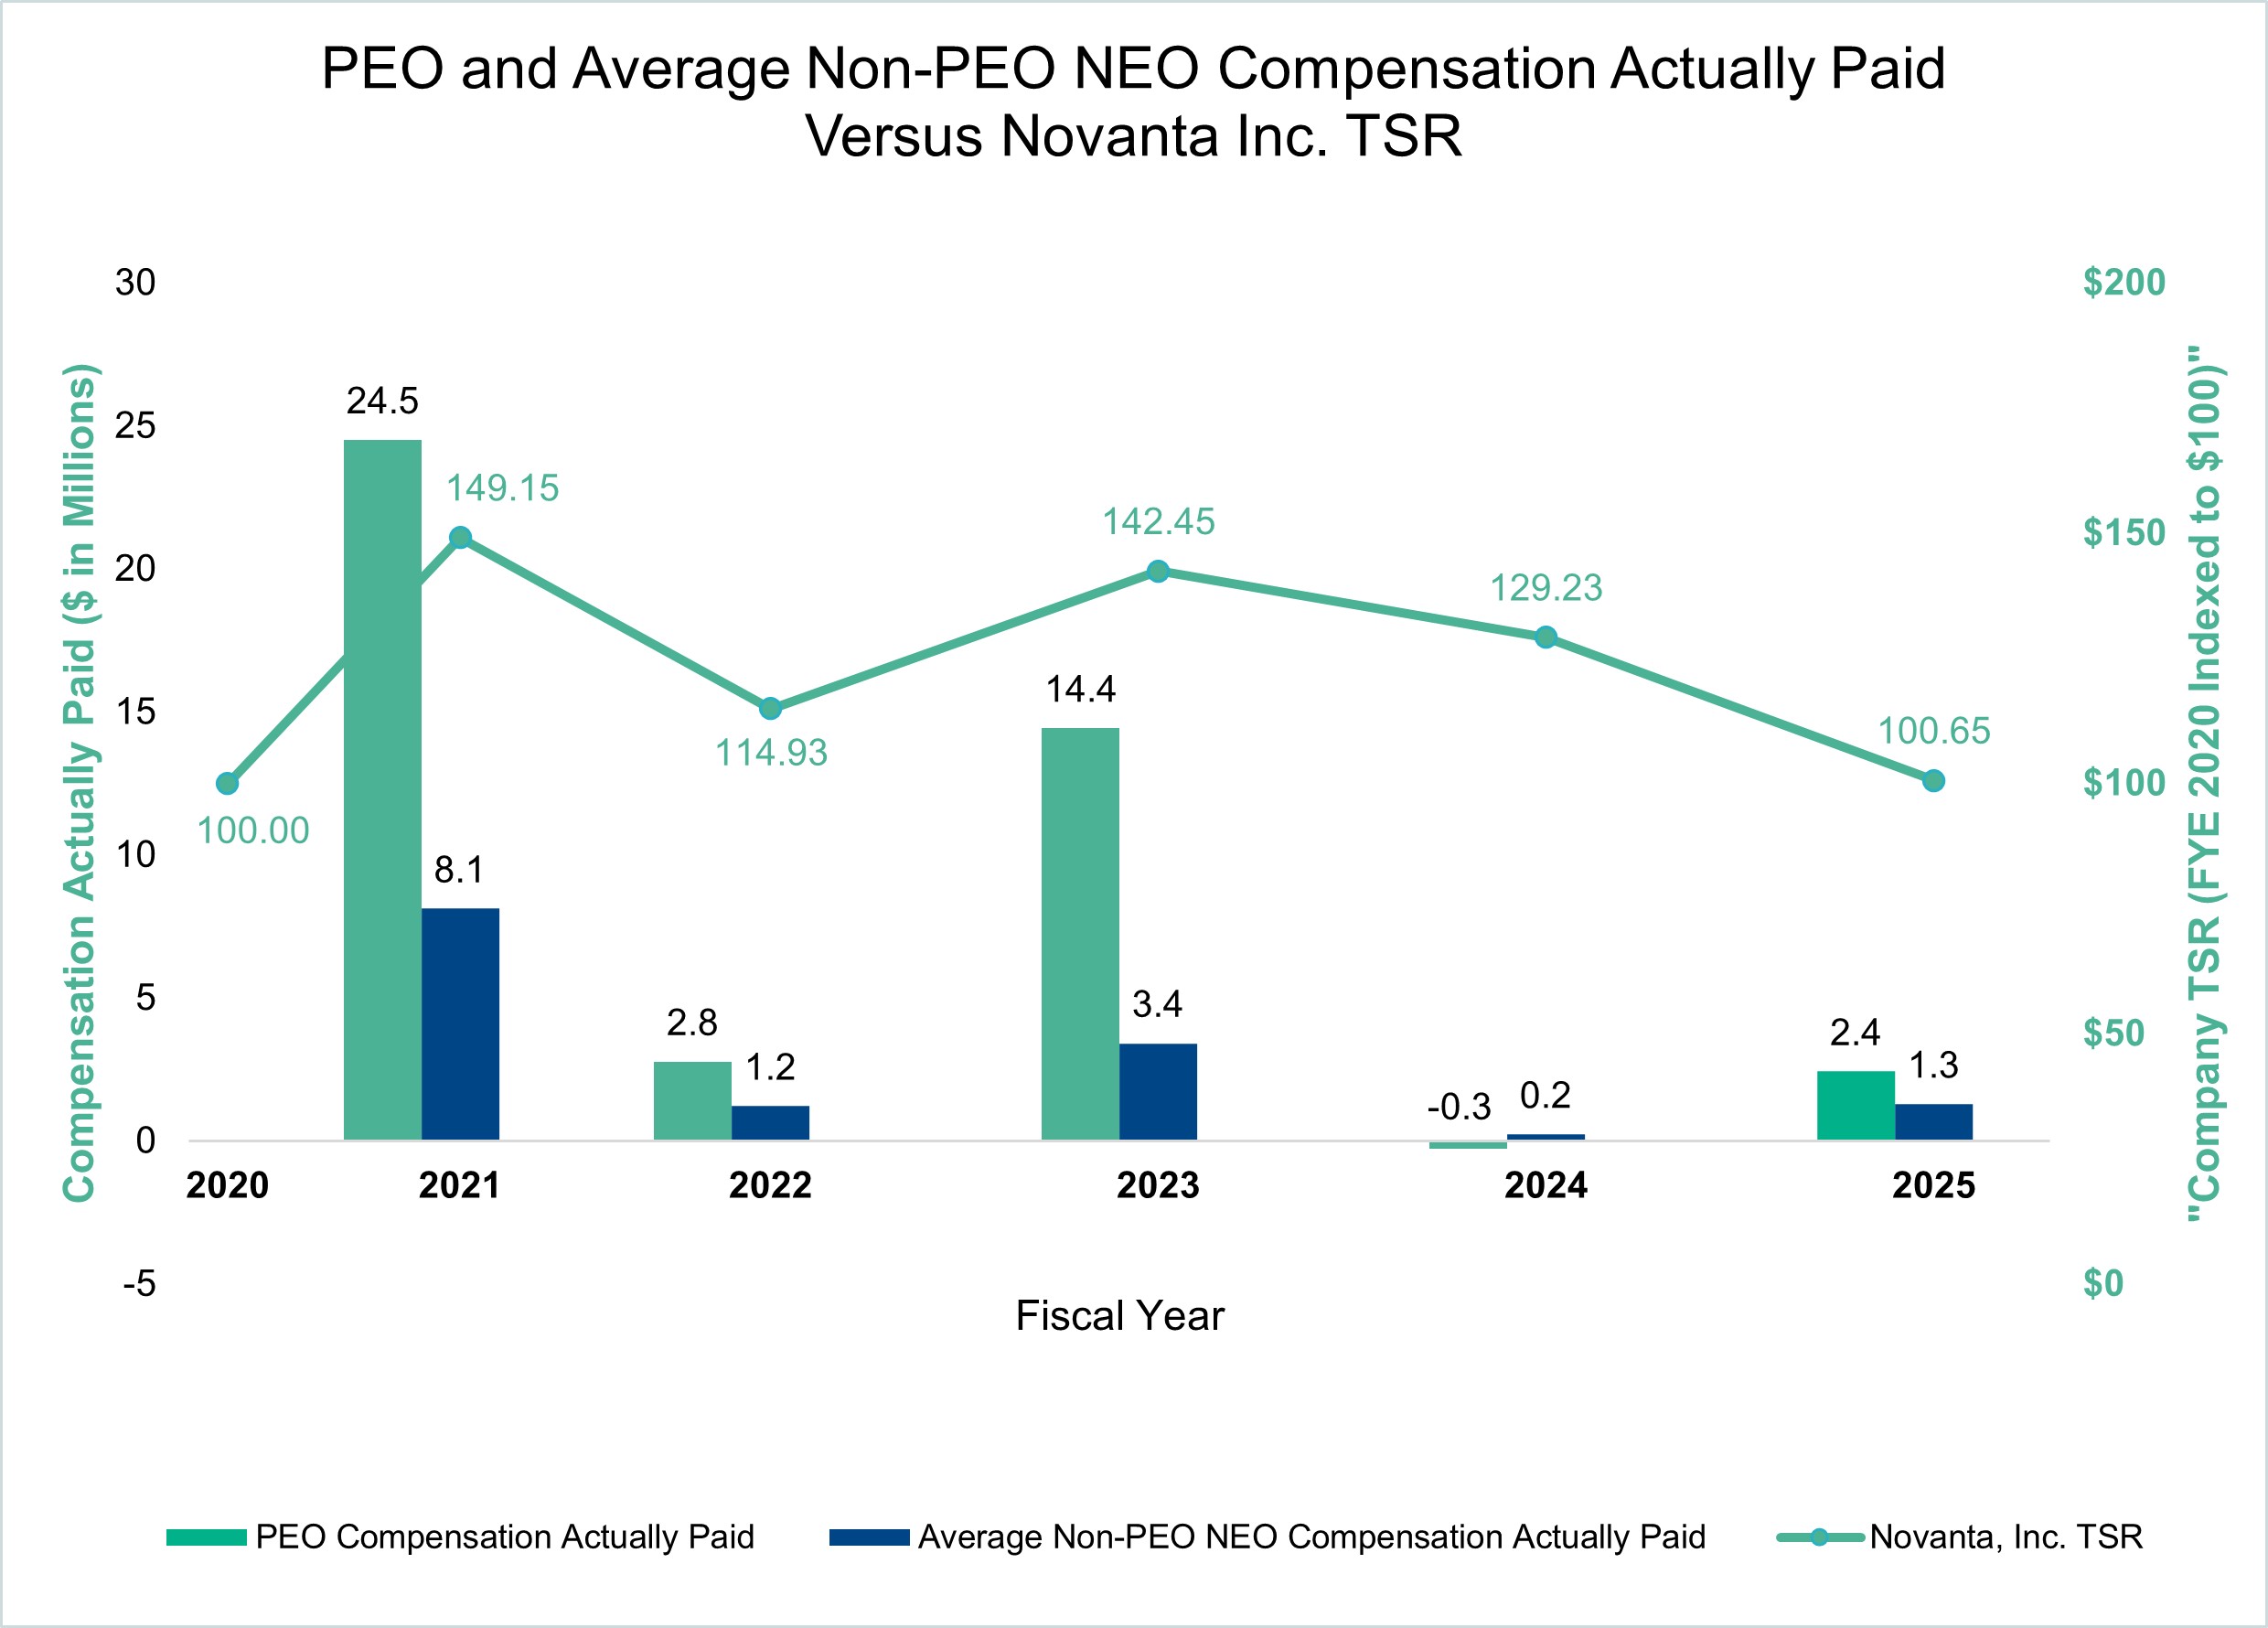
Comparison of Compensation Actually Paid and Company Total Shareholder Return (“TSR”)

The following chart illustrates the relationship between Compensation Actually Paid to our PEO, the average of Compensation Actually Paid to our Non-PEO NEOs, and the Company’s cumulative TSR over the five most recently completed fiscal years.
img25455625_6.jpg

       
Compensation Actually Paid vs. Net Income

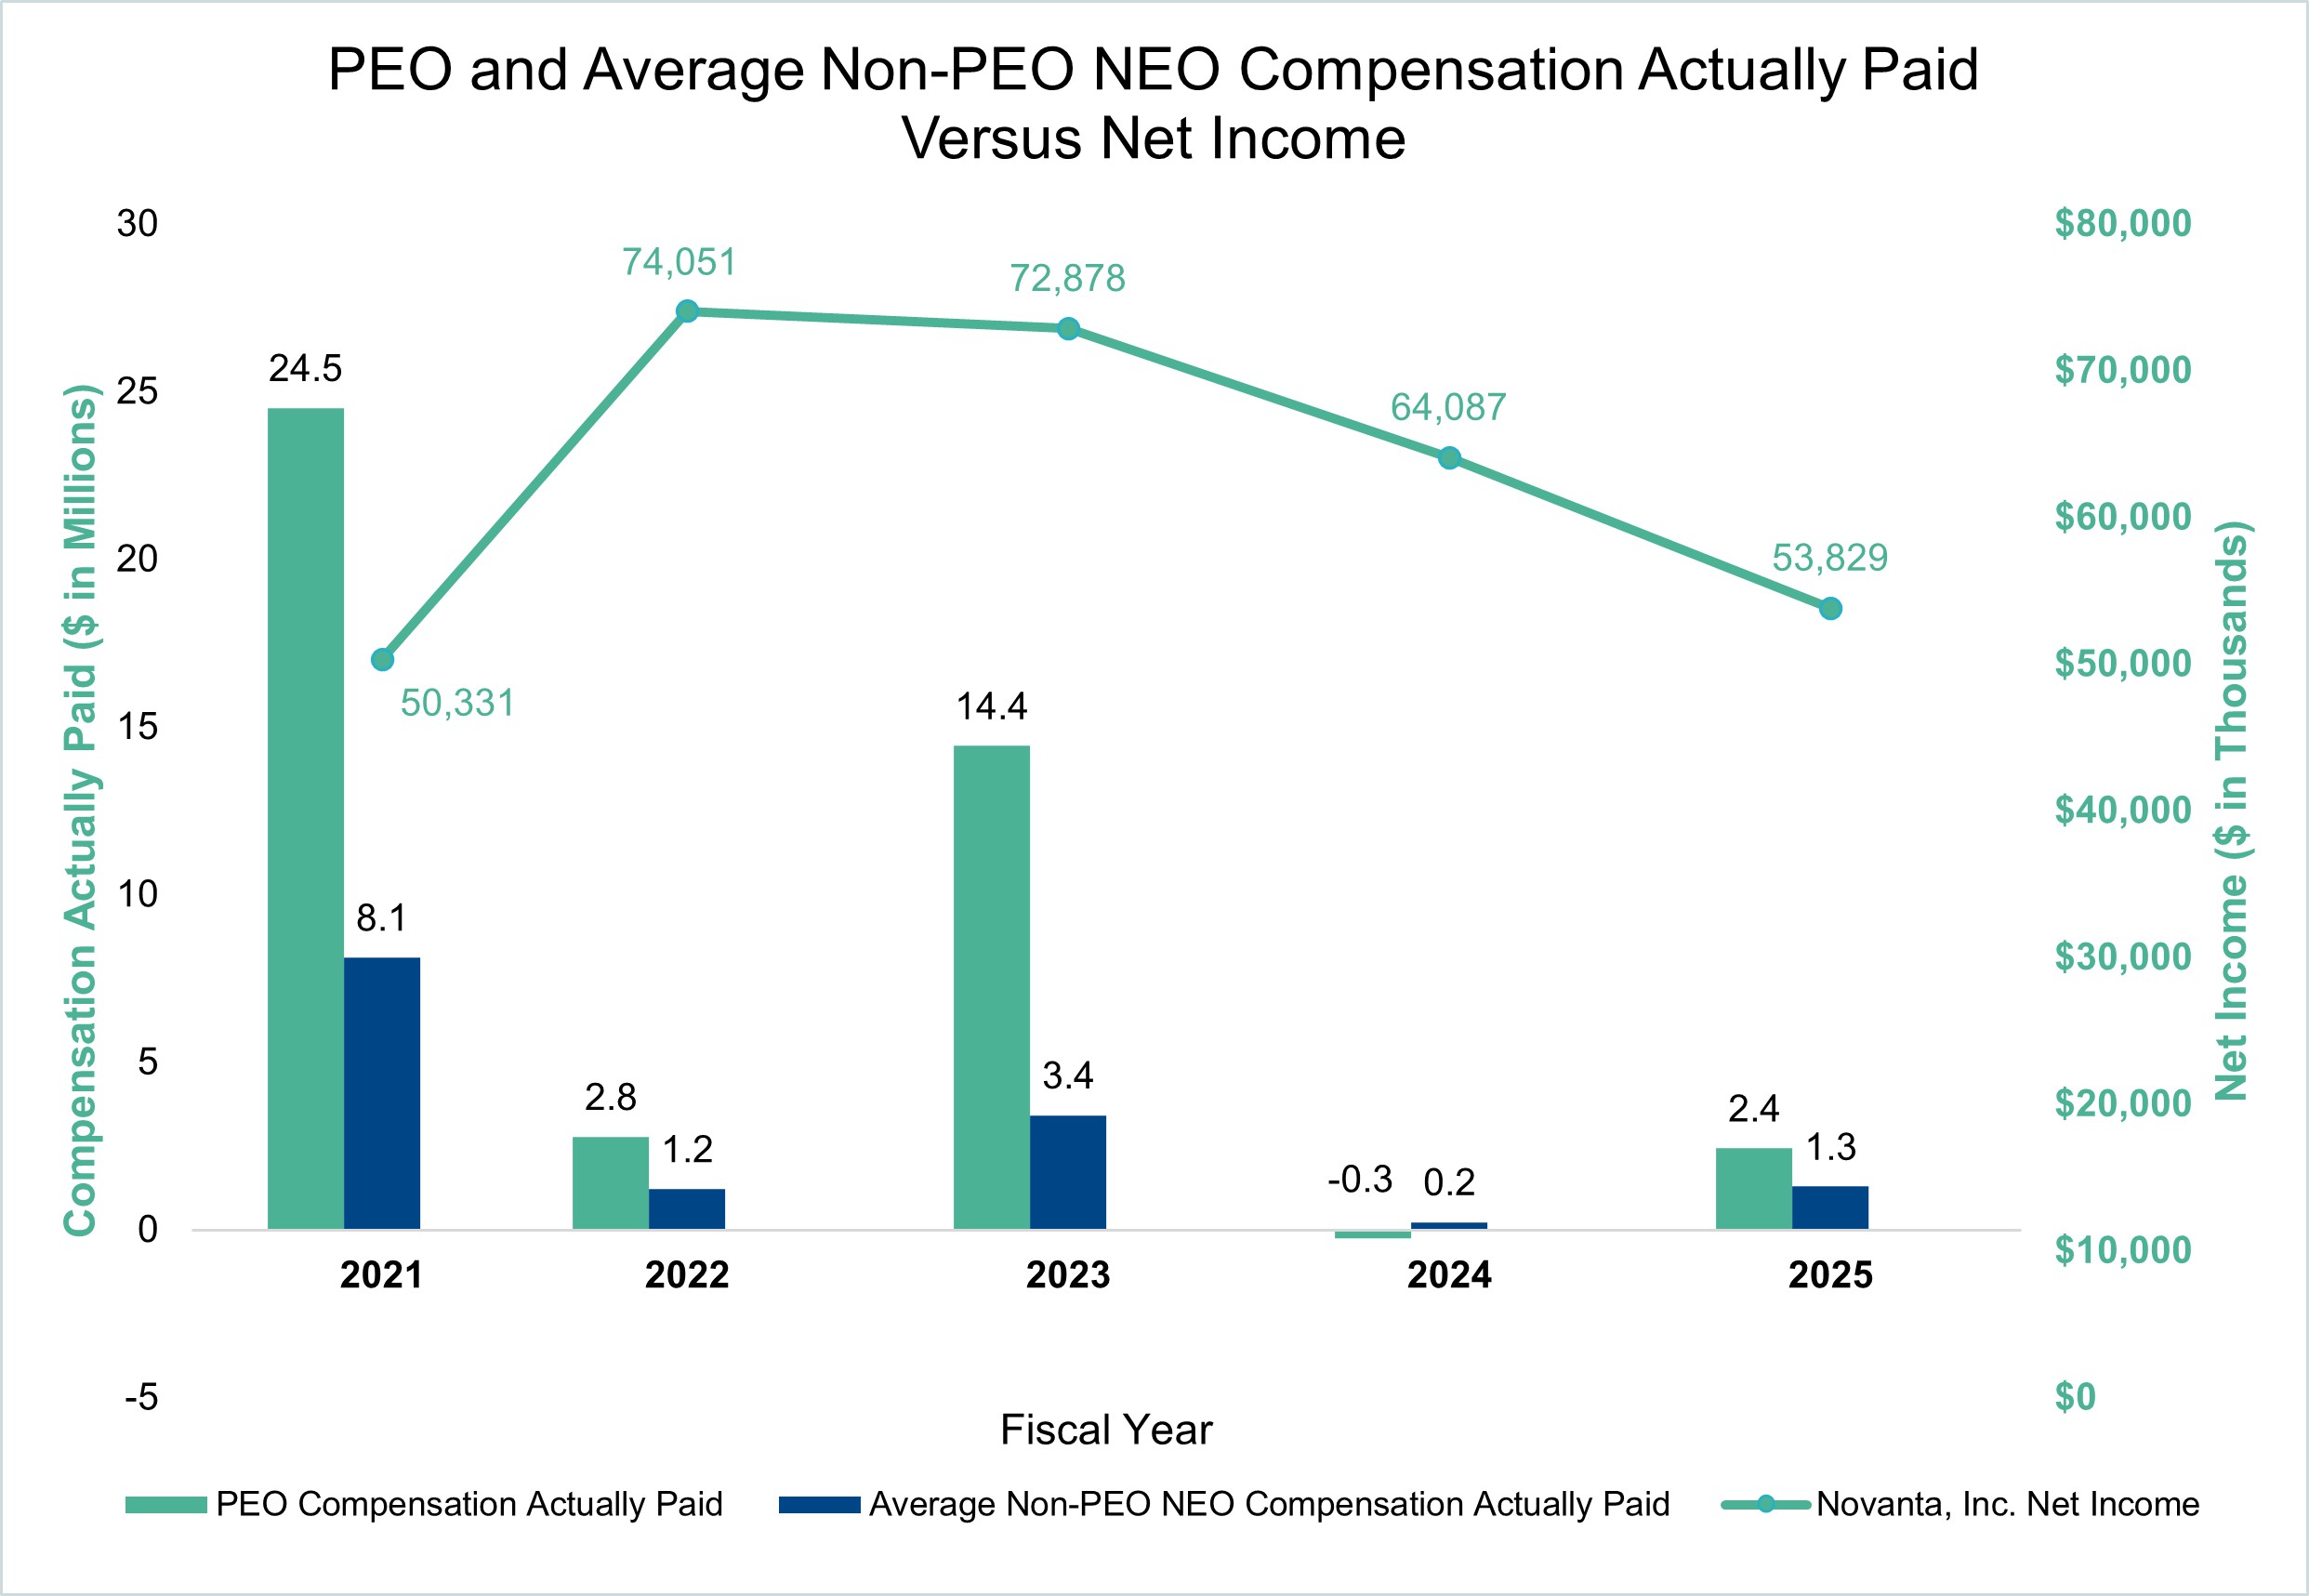
Comparison of Compensation Actually Paid and Company Net Income

The following chart illustrates the relationship between Compensation Actually Paid to our PEO, the average of Compensation Actually Paid to our Non-PEO NEOs, and our Net Income during the five most recently completed fiscal years.
img25455625_7.jpg

       
Compensation Actually Paid vs. Company Selected Measure

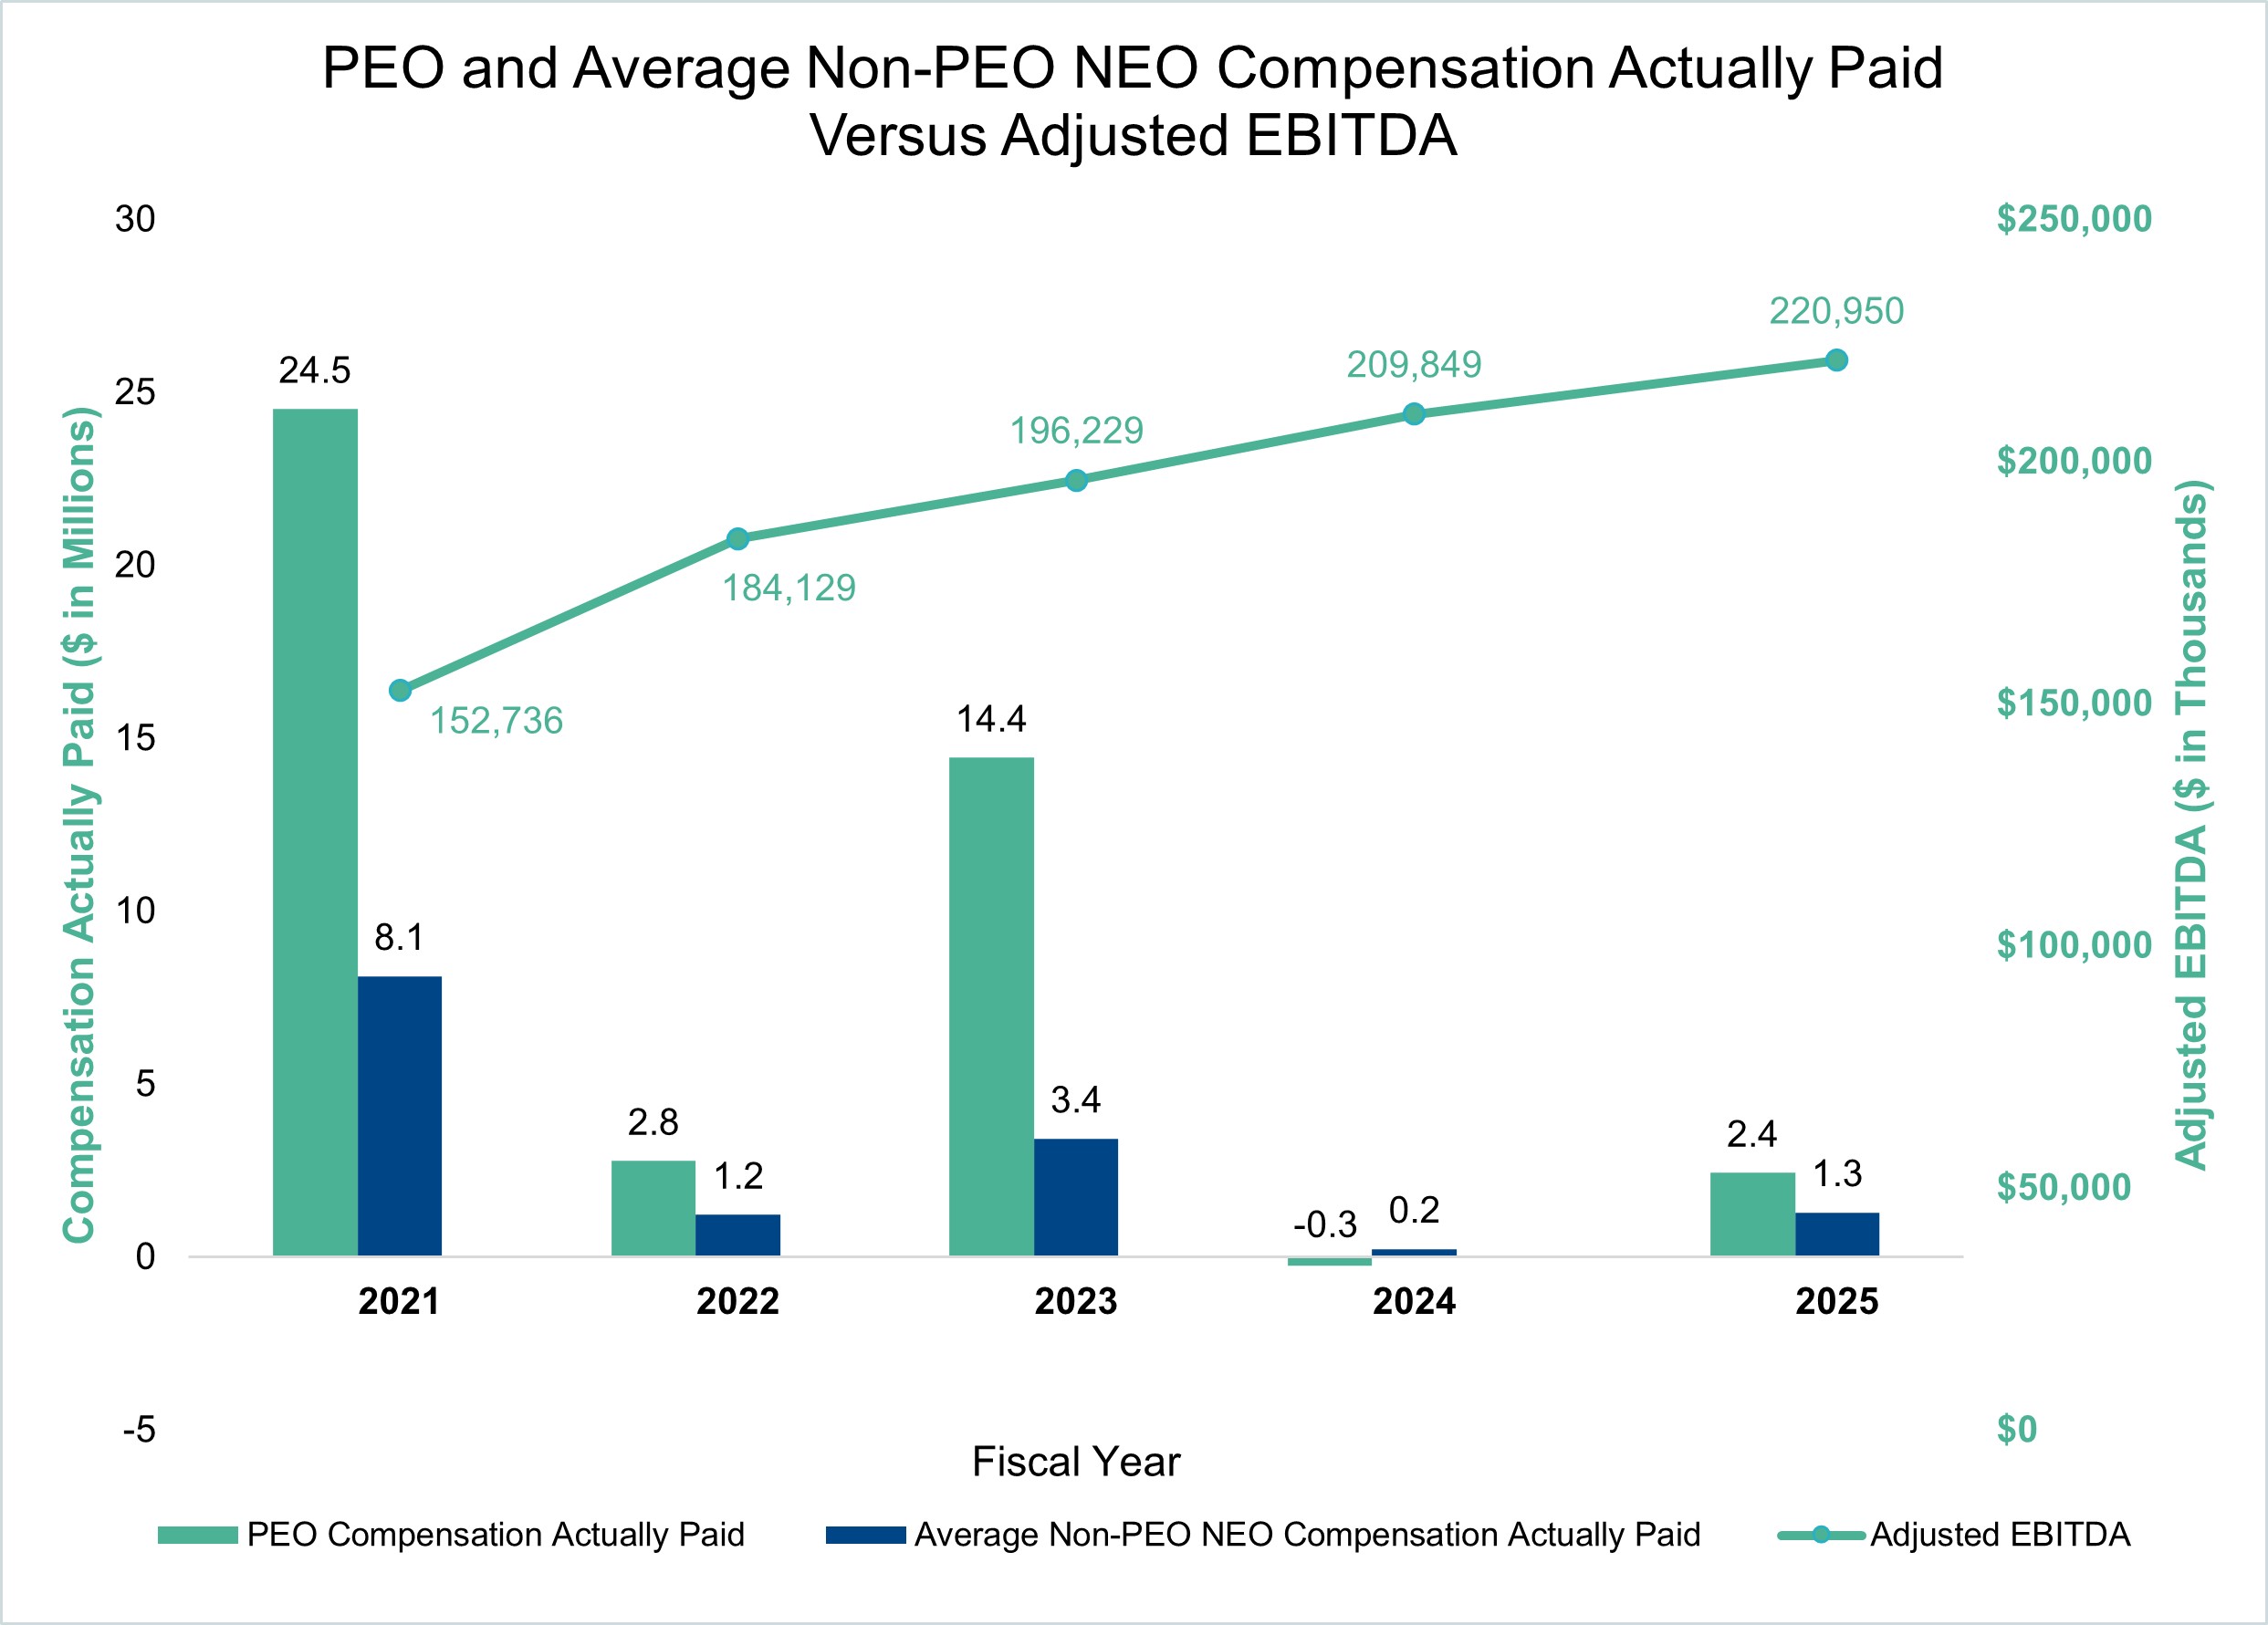
Comparison of Compensation Actually Paid and Company Adjusted EBITDA

The following chart illustrates the relationship between Compensation Actually Paid to our PEO, the average of Compensation Actually Paid to our Non-PEO NEOs, and Adjusted EBITDA during the five most recently completed fiscal years.
img25455625_8.jpg

       
Total Shareholder Return Vs Peer Group

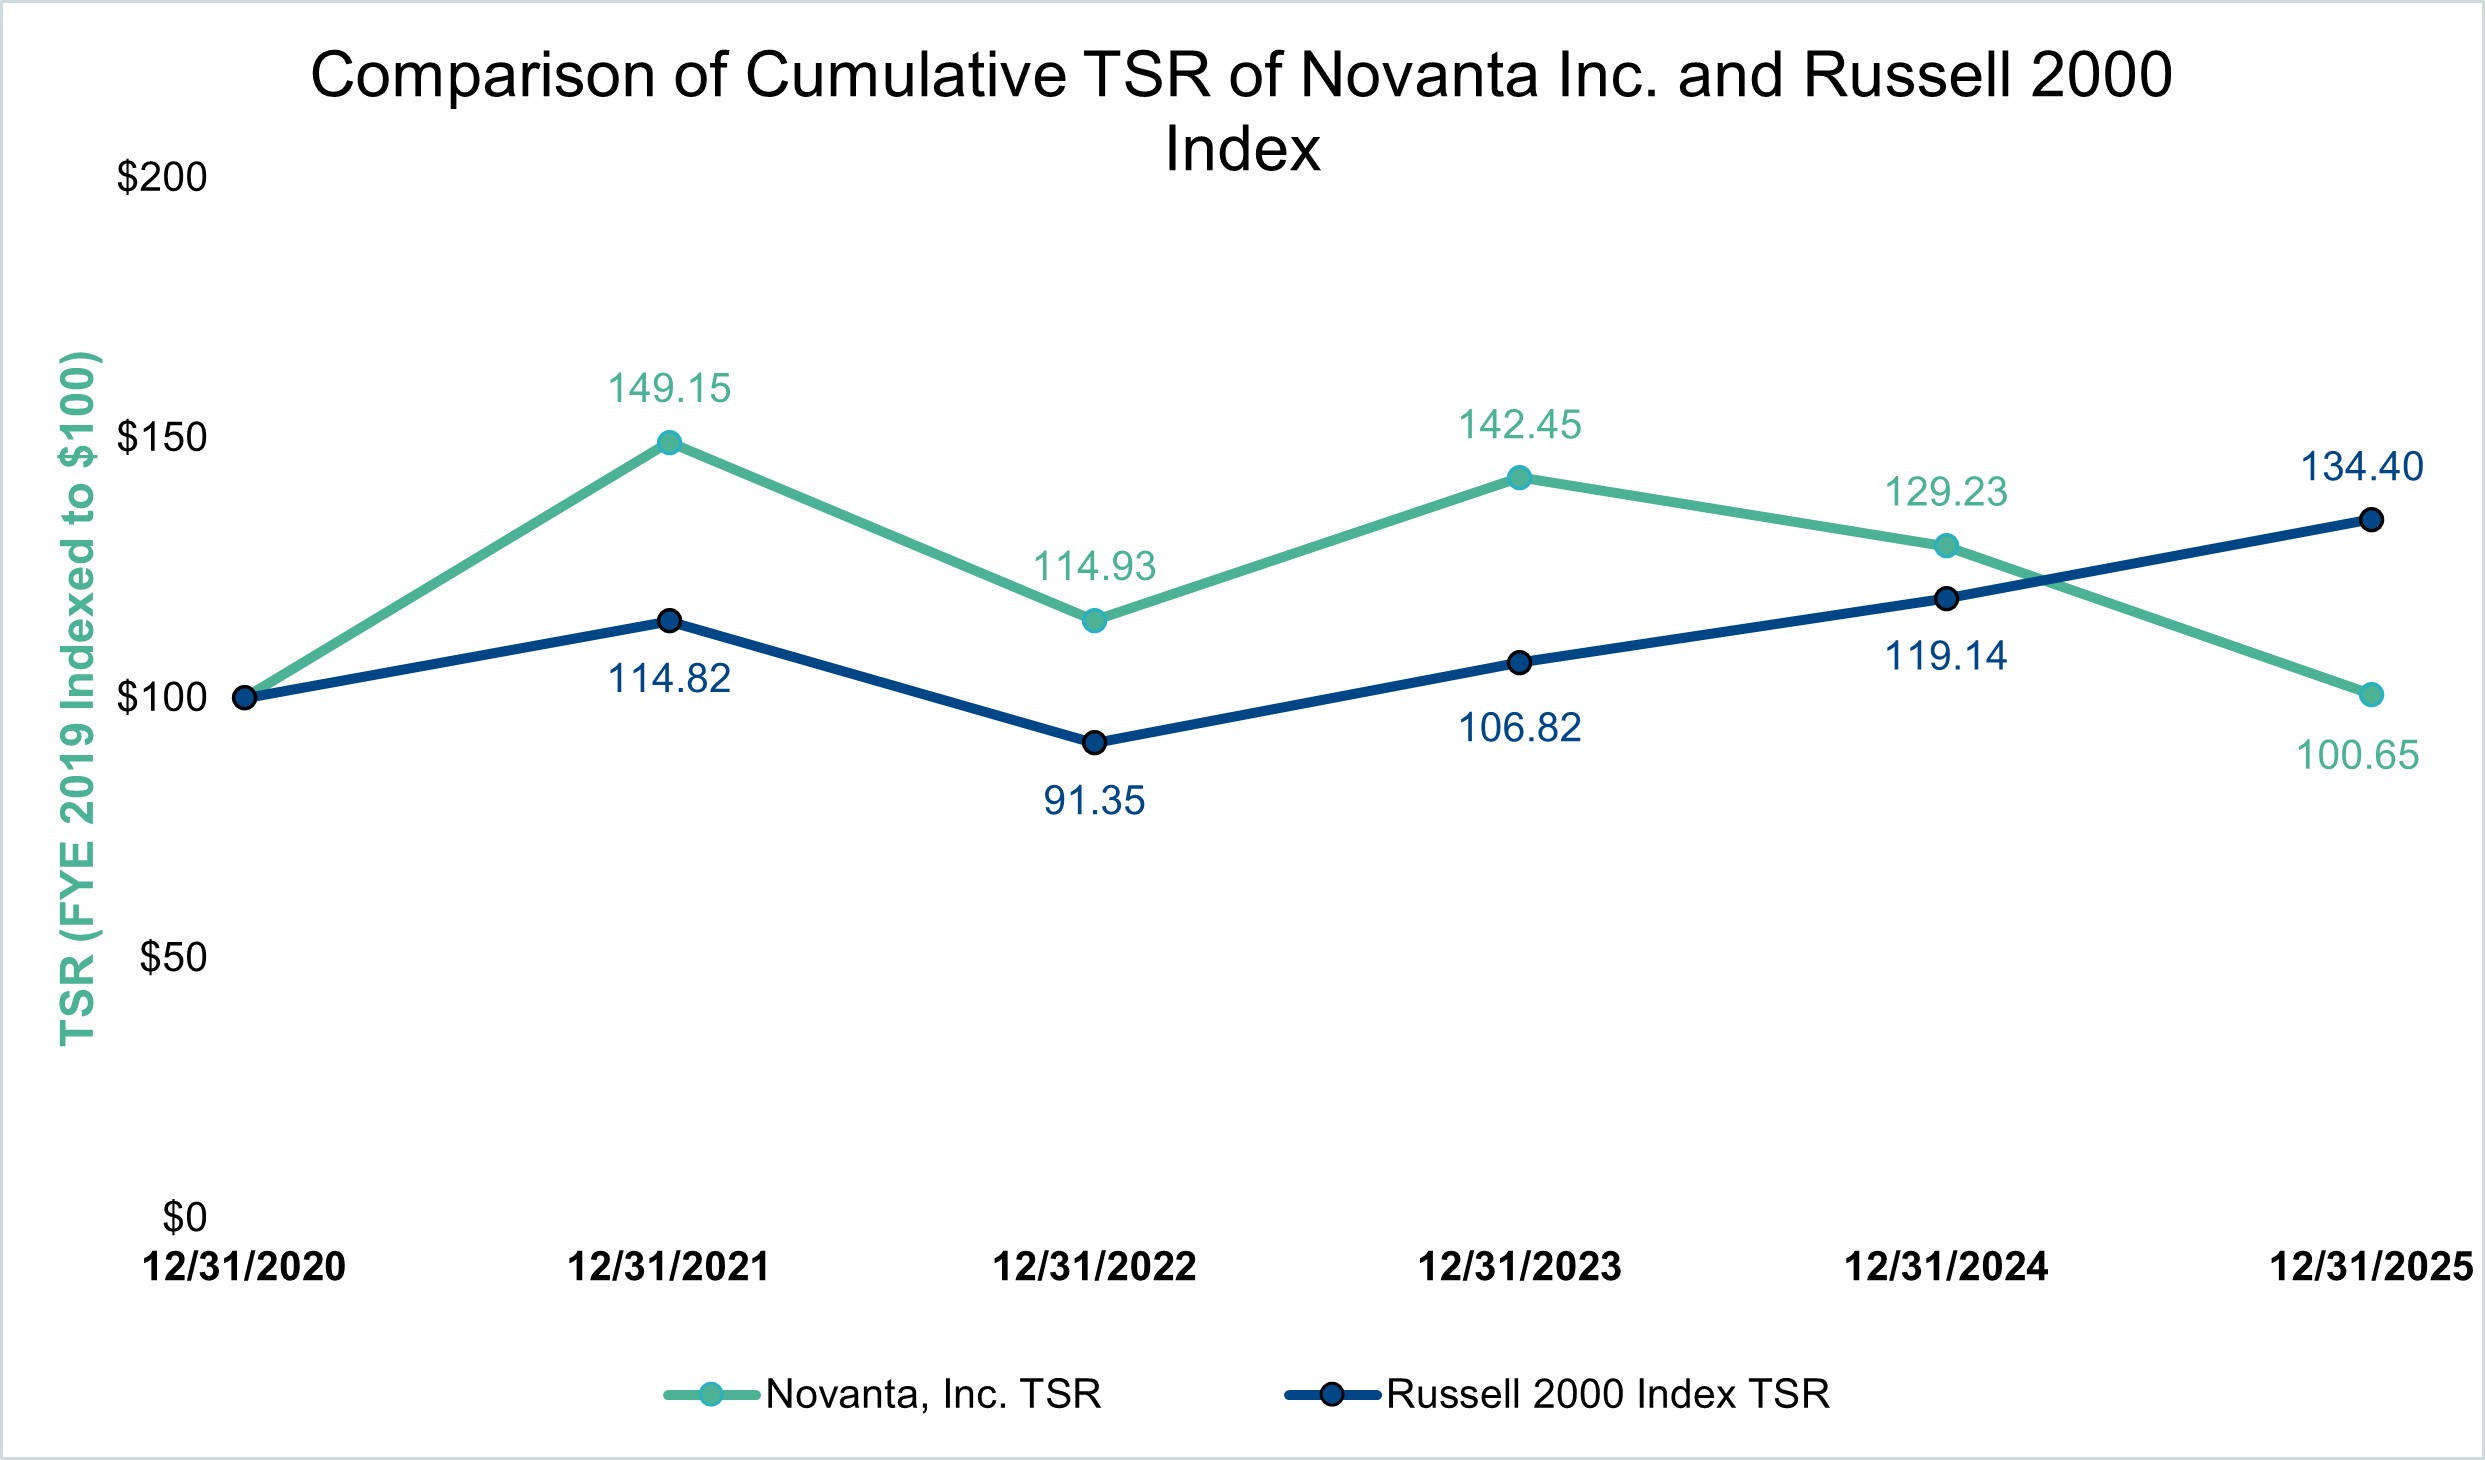
Comparison of Company TSR and Peer Group TSR

The following chart compares the cumulative TSR for Novanta Inc. over the five most recently completed fiscal years to that of the Russell 2000 Index over the same period.
img25455625_9.jpg

       
Tabular List, Table

Tabular List of Most Important Financial Performance Measures

The following table presents the financial performance measures that the Company considers to have been the most important in linking Compensation Actually Paid to our PEO and Non-PEO NEOs for 2025 to Company performance. The measures in this table are not ranked.


Performance Measures

Adjusted EBITDA

Adjusted EPS

Organic Revenue Growth

Relative Total Shareholder Return

       
Total Shareholder Return Amount $ 100.65 129.23 142.45 114.93 149.15
Peer Group Total Shareholder Return Amount 134.4 119.14 106.82 91.35 114.82
Net Income (Loss) $ 53,829,000 $ 64,087,000 $ 72,878,000 $ 74,051,000 $ 50,331,000
Company Selected Measure Amount 220,950,000 209,849,000 196,229,000 184,129,000 152,736,000
PEO Name Matthijs Glastra Matthijs Glastra Matthijs Glastra Matthijs Glastra Matthijs Glastra
Additional 402(v) Disclosure
2.)
The amounts shown for Compensation Actually Paid have been calculated in accordance with Item 402(v) of Regulation S-K and do not reflect compensation actually earned, realized, or received by the Company’s NEOs. These amounts reflect the Summary Compensation Table Total with certain adjustments as described in footnote 3 below.
       
Measure:: 1          
Pay vs Performance Disclosure          
Name Adjusted EBITDA        
Non-GAAP Measure Description
5.)
We determined Adjusted EBITDA to be the most important financial performance measure used to link Company performance to Compensation Actually Paid to our PEO and Non-PEO NEOs in 2025. As described in the Compensation Discussion and Analysis section of this management proxy circular, Adjusted EBITDA is a non-GAAP financial performance measure used in our Senior Management Incentive Plan. The Company defines Adjusted EBITDA as income before deducting interest (income) expense, income tax provision (benefit), depreciation, amortization, non-cash share-based compensation, inventory fair value adjustments related to business acquisitions, inventory related charges associated with product line closures, restructuring, acquisition and related costs, discrete costs related to the planning and design phase of a Financial and Operation system implementation, charges
related to an insurance recovery, officer transition costs, cost directly related to COVID-19 testing, and other non-operating (income) expense items, including foreign exchange transaction (gains) losses, costs related to our debt refinancing and net periodic pension costs of the Company’s frozen U.K. defined benefit pension plan. A reconciliation of the Adjusted EBITDA to the most comparable GAAP financial measure is provided in the tables at the end of the Company’s Annual Report for the year ended December 31, 2025. Adjusted EBITDA may not have been the most important financial performance measure for other fiscal years presented and we may determine a different financial performance measure to be the most important financial performance measure in future years.
       
Measure:: 2          
Pay vs Performance Disclosure          
Name Adjusted EPS        
Measure:: 3          
Pay vs Performance Disclosure          
Name Organic Revenue Growth        
Measure:: 4          
Pay vs Performance Disclosure          
Name Relative Total Shareholder Return        
PEO | Aggregate Grant Date Fair Value of Equity Award Amounts Reported in Summary Compensation Table          
Pay vs Performance Disclosure          
Adjustment to Compensation, Amount $ (8,275,535) $ (7,289,471) $ (6,662,770) $ (4,680,031) $ (9,970,028)
PEO | Equity Awards Adjustments, Excluding Value Reported in Compensation Table          
Pay vs Performance Disclosure          
Adjustment to Compensation, Amount 664,631 (1,746,877) 12,834,702 155,202 22,112,076
PEO | Year-end Fair Value of Equity Awards Granted in Covered Year that are Outstanding and Unvested          
Pay vs Performance Disclosure          
Adjustment to Compensation, Amount 6,668,182 5,704,584 8,907,313 5,386,925 13,766,568
PEO | Year-over-Year Change in Fair Value of Equity Awards Granted in Prior Years That are Outstanding and Unvested          
Pay vs Performance Disclosure          
Adjustment to Compensation, Amount (5,496,550) (7,030,584) 3,441,199 (4,393,507) 6,348,761
PEO | Change in Fair Value as of Vesting Date of Prior Year Equity Awards Vested in Covered Year          
Pay vs Performance Disclosure          
Adjustment to Compensation, Amount (507,001) (420,877) 486,190 (838,216) 1,996,747
Non-PEO NEO | Aggregate Grant Date Fair Value of Equity Award Amounts Reported in Summary Compensation Table          
Pay vs Performance Disclosure          
Adjustment to Compensation, Amount (1,782,038) (1,641,986) (1,421,433) (1,261,595) (3,202,912)
Non-PEO NEO | Equity Awards Adjustments, Excluding Value Reported in Compensation Table          
Pay vs Performance Disclosure          
Adjustment to Compensation, Amount 440,916 (673,398) 2,771,843 351,238 7,128,481
Non-PEO NEO | Year-end Fair Value of Equity Awards Granted in Covered Year that are Outstanding and Unvested          
Pay vs Performance Disclosure          
Adjustment to Compensation, Amount 1,323,341 1,084,022 1,900,304 1,359,913 4,376,963
Non-PEO NEO | Year-over-Year Change in Fair Value of Equity Awards Granted in Prior Years That are Outstanding and Unvested          
Pay vs Performance Disclosure          
Adjustment to Compensation, Amount (603,096) (1,495,594) 770,506 (848,158) 1,523,957
Non-PEO NEO | Vesting Date Fair Value of Equity Awards Granted and Vested in Covered Year          
Pay vs Performance Disclosure          
Adjustment to Compensation, Amount 5,632 7,278      
Non-PEO NEO | Change in Fair Value as of Vesting Date of Prior Year Equity Awards Vested in Covered Year          
Pay vs Performance Disclosure          
Adjustment to Compensation, Amount 192,337 (69,211) $ 101,033 $ (160,517) $ 1,227,561
Non-PEO NEO | Prior Year End Fair Value of Equity Awards Granted in Any Prior Year that Fail to Meet Applicable Vesting Conditions During Covered Year          
Pay vs Performance Disclosure          
Adjustment to Compensation, Amount $ (92,624) $ (199,893)