Pay vs Performance Disclosure - USD ($)
Dec. 31, 2025
Dec. 31, 2024
Dec. 31, 2023
Dec. 31, 2022
Dec. 31, 2021
Pay Versus Performance
The following table summarizes the relationship between the compensation paid to our Chief Executive Officer(s) (referred to in this discussion as our “PEO(s)”) and the other Named Executive Officers (referred to in this discussion as our
“Non-PEO
NEOs”) and our financial performance for the fiscal years shown in the table below. Year (1) |
Summary Compensation Table Total for PEO (Mr. Gopalan) ($) |
Summary Compensation Table Total for PEO (Mr. Sievert) ($) |
Compensation Actually Paid to PEO (Mr. Gopalan) ($) (2) (3) |
Compensation Actually Paid to PEO (Mr. Sievert) ($) (2) (3) |
Average Summary Compensation Table Total for Non-PEO NEOs (2) ($) |
Average Compensation Actually Paid to Non-PEO NEOs ($) (2) (3) |
Value of Initial Fixed $100 Investment Based on: |
Net Income (millions) ($) |
Adjusted Free Cash Flow (5) (millions) ($) | |||||||||||||||||||||||||||||||||||||||||
TMUS Total Shareholder Return ($) (4) |
Peer Group Total Shareholder Return (4) ($) | |||||||||||||||||||||||||||||||||||||||||||||||||
(a) |
(b) |
(b) |
(c) |
(c) |
(d) |
(e) |
(f) |
(g) |
(h) |
(i) | ||||||||||||||||||||||||||||||||||||||||
2025 |
35,439,421 | 50,408,096 | 29,796,797 | 63,432,371 | 18,826,522 | 14,580,415 | 156 | 112 | 10,992 | 17,995 | ||||||||||||||||||||||||||||||||||||||||
2024 |
— | 30,040,245 | — | 70,190,679 | 9,778,552 | 20,462,125 | 167 | 109 | 11,339 | 17,032 | ||||||||||||||||||||||||||||||||||||||||
2023 |
— | 37,488,851 | — | 55,021,146 | 10,759,665 | 13,633,451 | 119 | 89 | 8,317 | 13,586 | ||||||||||||||||||||||||||||||||||||||||
2022 |
— | 29,060,048 | — | 86,602,023 | 10,461,699 | 21,148,334 | 104 | 82 | 2,590 | 7,656 | ||||||||||||||||||||||||||||||||||||||||
2021 |
— | 22,610,659 | — | (15,052,969 | ) | 9,689,891 | 3,906,500 | 86 | 91 | 3,024 | 5,646 | |||||||||||||||||||||||||||||||||||||||
| 1 | In accordance with applicable SEC rules, since Messrs. Gopalan and Sievert both served as Chief Executive Officer during 2025, they are each included in the table above and corresponding footnotes as a PEO. The following table lists the PEOs and Non-PEO NEOs for each of fiscal years 2025, 2024, 2023, 2022, and 2021. |
Year |
PEO |
Non-PEO NEOs | ||
2025 |
Srinivasan Gopalan & G. Michael Sievert | Peter Osvaldik, Mark W. Nelson, Michael J. Katz, Jonathan A. Freier, Callie R. Field, Ulf Ewaldsson | ||
2024 |
G. Michael Sievert | Peter Osvaldik, Mark W. Nelson, Michael J. Katz, Jonathan A. Freier, Callie R. Field | ||
2023 |
G. Michael Sievert | Peter Osvaldik, Mark W. Nelson, Michael J. Katz, Jonathan A. Freier, Callie R. Field | ||
2022 |
G. Michael Sievert | Peter Osvaldik, Neville R. Ray, Mark W. Nelson, Peter A. Ewens, Brandon D. Draper | ||
2021 |
G. Michael Sievert | Peter Osvaldik, Neville R. Ray, Mark W. Nelson, Peter A. Ewens, David A. Miller | ||
| 2 | The following table shows the amounts deducted from and added to the Summary Compensation Table totals to calculate “Compensation Actually Paid” to our PEOs and to the average Summary Compensation Table totals for our Non-PEO NEOs in accordance with Item 402(v)(2)(iii) of Regulation S-K: |
2025 |
||||||||||||
| |
Mr. Gopalan ($) |
Mr. Sievert ($) |
Average Non-PEO NEOs ($) |
|||||||||
Summary Compensation Table Total |
35,439,421 | 50,408,096 | 18,826,522 | |||||||||
- Grant Date Fair Value of Stock Awards Granted in Fiscal Year |
(27,114,078 | ) | (27,546,942 | ) | (14,165,185 | ) | ||||||
+ Fair Value at Fiscal Year-End of Outstanding and Unvested Stock Awards Granted in Fiscal Year |
21,471,455 | — | 8,171,653 | |||||||||
+ Change in Fair Value of Outstanding and Unvested Stock Awards Granted in Prior Fiscal Years |
— | — | (163,789 | ) | ||||||||
+ Fair Value at Vesting of Stock Awards Granted in Fiscal Year That Vested During Fiscal Year |
— | 19,777,194 | 146,294 | |||||||||
+ Change in Fair Value as of Vesting Date of Stock Awards Granted in Prior Fiscal Years For Which Applicable Vesting Conditions Were Satisfied During Fiscal Year |
— | 20,794,023 | 2,173,522 | |||||||||
- Fair Value as of Prior Fiscal Year-End of Stock Awards Granted in Prior Fiscal Years That Failed to Meet Applicable Vesting Conditions During Fiscal Year |
— | — | (408,602 | ) | ||||||||
Compensation Actually Paid |
29,796,797 | 63,432,371 | 14,580,415 | |||||||||
| 3 | The dollar amounts reported represent the amount of “Compensation Actually Paid,” as calculated in accordance with Item 402(v)(2)(iii) of Regulation S-K. These dollar amounts do not reflect the actual amounts of compensation earned by or paid to our NEOs during the applicable year. For purposes of calculating “Compensation Actually Paid,” the fair value of stock awards is calculated in accordance with FASB ASC Topic 718 using the same assumption methodologies used to calculate the grant date fair value of stock awards for purposes of the Summary Compensation Table. For additional information regarding the valuation assumptions used to calculate the fair value of our stock awards, please see the notes to our financial statements in our Annual Report on Form 10-K for the applicable fiscal year. |
| 4 | The Company and the Company’s peer group cumulative TSR (the “Peer Group TSR”) is determined based on the value of an initial fixed investment of $100 in our common stock for the period beginning on the last trading day of 2020 through the end of the relevant fiscal year, assuming reinvestment of all dividends. The Peer Group TSR set forth in this table was determined using Dow Jones U.S. Mobile Telecommunications TSM Index, which we also use in preparing the stock performance graph required by Item 201(e) of Regulation S-K for our Annual Report on Form 10-K for 2025. |
| 5 | The Company has identified Adjusted Free Cash Flow as the company-selected measure for the pay versus performance disclosure, as it represents the most important financial performance measure used to link compensation actually paid to the PEOs and the Non-PEO NEOs in 2025 to the Company’s performance. See Appendix A to this Proxy Statement for a reconciliation of Adjusted Free Cash Flow, a non-GAAP measure to the most directly comparable GAAP measure. |
| 1 | In accordance with applicable SEC rules, since Messrs. Gopalan and Sievert both served as Chief Executive Officer during 2025, they are each included in the table above and corresponding footnotes as a PEO. The following table lists the PEOs and Non-PEO NEOs for each of fiscal years 2025, 2024, 2023, 2022, and 2021. |
Year |
PEO |
Non-PEO NEOs | ||
2025 |
Srinivasan Gopalan & G. Michael Sievert | Peter Osvaldik, Mark W. Nelson, Michael J. Katz, Jonathan A. Freier, Callie R. Field, Ulf Ewaldsson | ||
2024 |
G. Michael Sievert | Peter Osvaldik, Mark W. Nelson, Michael J. Katz, Jonathan A. Freier, Callie R. Field | ||
2023 |
G. Michael Sievert | Peter Osvaldik, Mark W. Nelson, Michael J. Katz, Jonathan A. Freier, Callie R. Field | ||
2022 |
G. Michael Sievert | Peter Osvaldik, Neville R. Ray, Mark W. Nelson, Peter A. Ewens, Brandon D. Draper | ||
2021 |
G. Michael Sievert | Peter Osvaldik, Neville R. Ray, Mark W. Nelson, Peter A. Ewens, David A. Miller | ||
S-K
for our Annual Report on Form 10-K
for 2025.
| 2 | The following table shows the amounts deducted from and added to the Summary Compensation Table totals to calculate “Compensation Actually Paid” to our PEOs and to the average Summary Compensation Table totals for our Non-PEO NEOs in accordance with Item 402(v)(2)(iii) of Regulation S-K: |
2025 |
||||||||||||
| |
Mr. Gopalan ($) |
Mr. Sievert ($) |
Average Non-PEO NEOs ($) |
|||||||||
Summary Compensation Table Total |
35,439,421 | 50,408,096 | 18,826,522 | |||||||||
- Grant Date Fair Value of Stock Awards Granted in Fiscal Year |
(27,114,078 | ) | (27,546,942 | ) | (14,165,185 | ) | ||||||
+ Fair Value at Fiscal Year-End of Outstanding and Unvested Stock Awards Granted in Fiscal Year |
21,471,455 | — | 8,171,653 | |||||||||
+ Change in Fair Value of Outstanding and Unvested Stock Awards Granted in Prior Fiscal Years |
— | — | (163,789 | ) | ||||||||
+ Fair Value at Vesting of Stock Awards Granted in Fiscal Year That Vested During Fiscal Year |
— | 19,777,194 | 146,294 | |||||||||
+ Change in Fair Value as of Vesting Date of Stock Awards Granted in Prior Fiscal Years For Which Applicable Vesting Conditions Were Satisfied During Fiscal Year |
— | 20,794,023 | 2,173,522 | |||||||||
- Fair Value as of Prior Fiscal Year-End of Stock Awards Granted in Prior Fiscal Years That Failed to Meet Applicable Vesting Conditions During Fiscal Year |
— | — | (408,602 | ) | ||||||||
Compensation Actually Paid |
29,796,797 | 63,432,371 | 14,580,415 | |||||||||
| 2 | The following table shows the amounts deducted from and added to the Summary Compensation Table totals to calculate “Compensation Actually Paid” to our PEOs and to the average Summary Compensation Table totals for our Non-PEO NEOs in accordance with Item 402(v)(2)(iii) of Regulation S-K: |
2025 |
||||||||||||
| |
Mr. Gopalan ($) |
Mr. Sievert ($) |
Average Non-PEO NEOs ($) |
|||||||||
Summary Compensation Table Total |
35,439,421 | 50,408,096 | 18,826,522 | |||||||||
- Grant Date Fair Value of Stock Awards Granted in Fiscal Year |
(27,114,078 | ) | (27,546,942 | ) | (14,165,185 | ) | ||||||
+ Fair Value at Fiscal Year-End of Outstanding and Unvested Stock Awards Granted in Fiscal Year |
21,471,455 | — | 8,171,653 | |||||||||
+ Change in Fair Value of Outstanding and Unvested Stock Awards Granted in Prior Fiscal Years |
— | — | (163,789 | ) | ||||||||
+ Fair Value at Vesting of Stock Awards Granted in Fiscal Year That Vested During Fiscal Year |
— | 19,777,194 | 146,294 | |||||||||
+ Change in Fair Value as of Vesting Date of Stock Awards Granted in Prior Fiscal Years For Which Applicable Vesting Conditions Were Satisfied During Fiscal Year |
— | 20,794,023 | 2,173,522 | |||||||||
- Fair Value as of Prior Fiscal Year-End of Stock Awards Granted in Prior Fiscal Years That Failed to Meet Applicable Vesting Conditions During Fiscal Year |
— | — | (408,602 | ) | ||||||||
Compensation Actually Paid |
29,796,797 | 63,432,371 | 14,580,415 | |||||||||
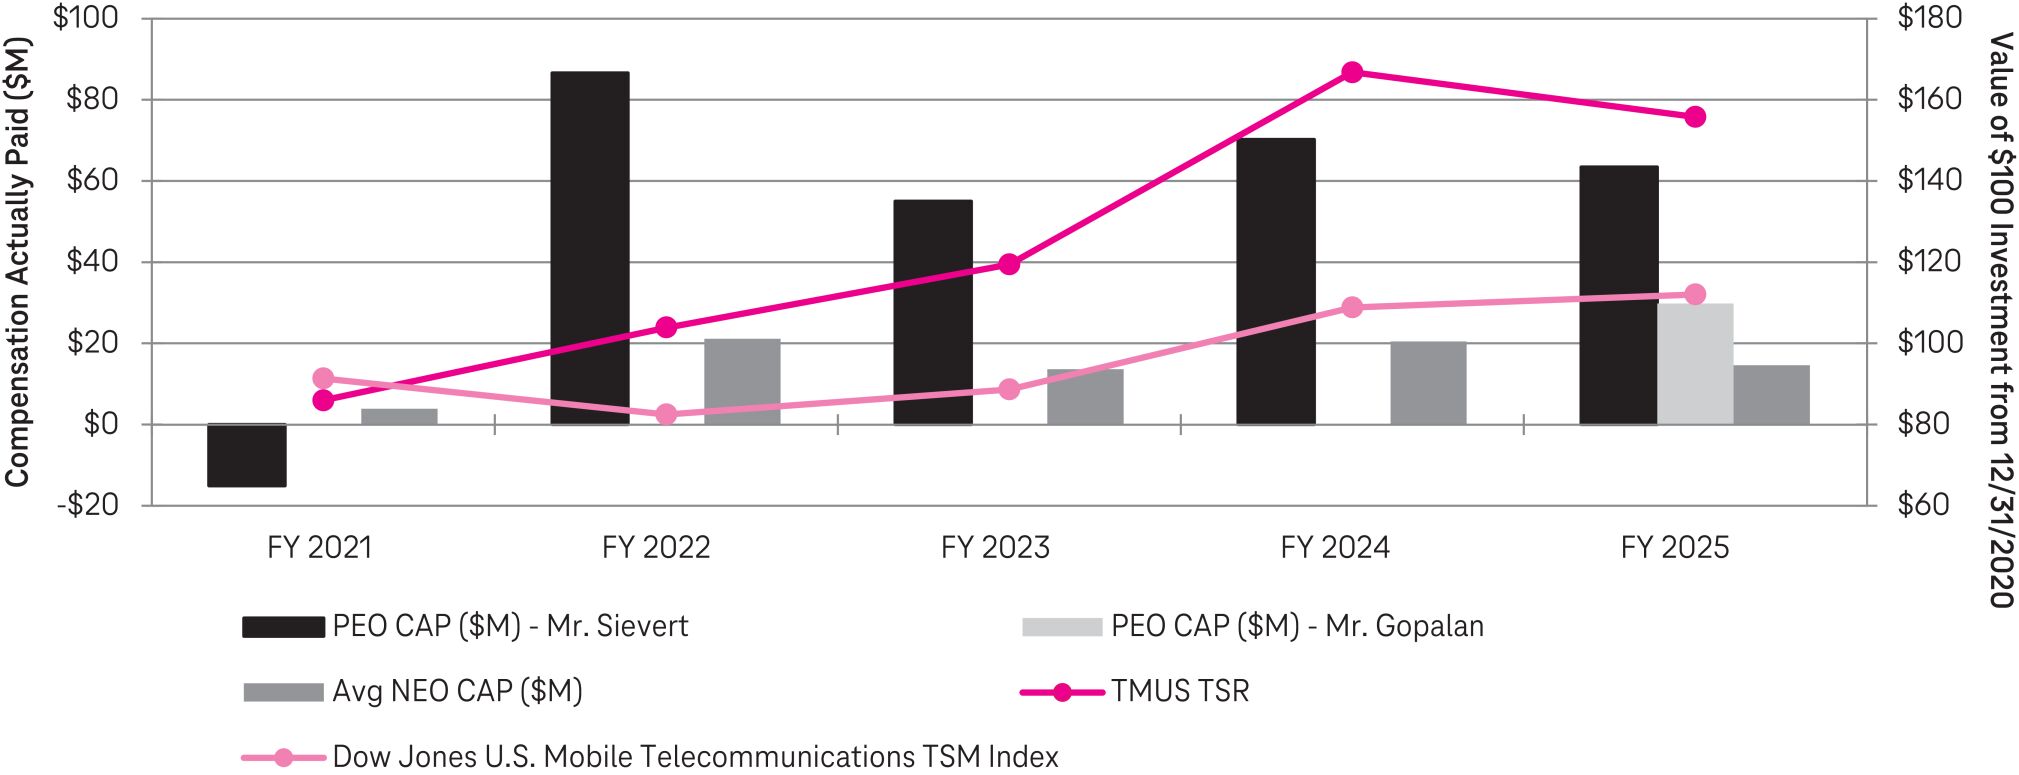
Compensation Actually Paid, TSR, and Peer Group TSR
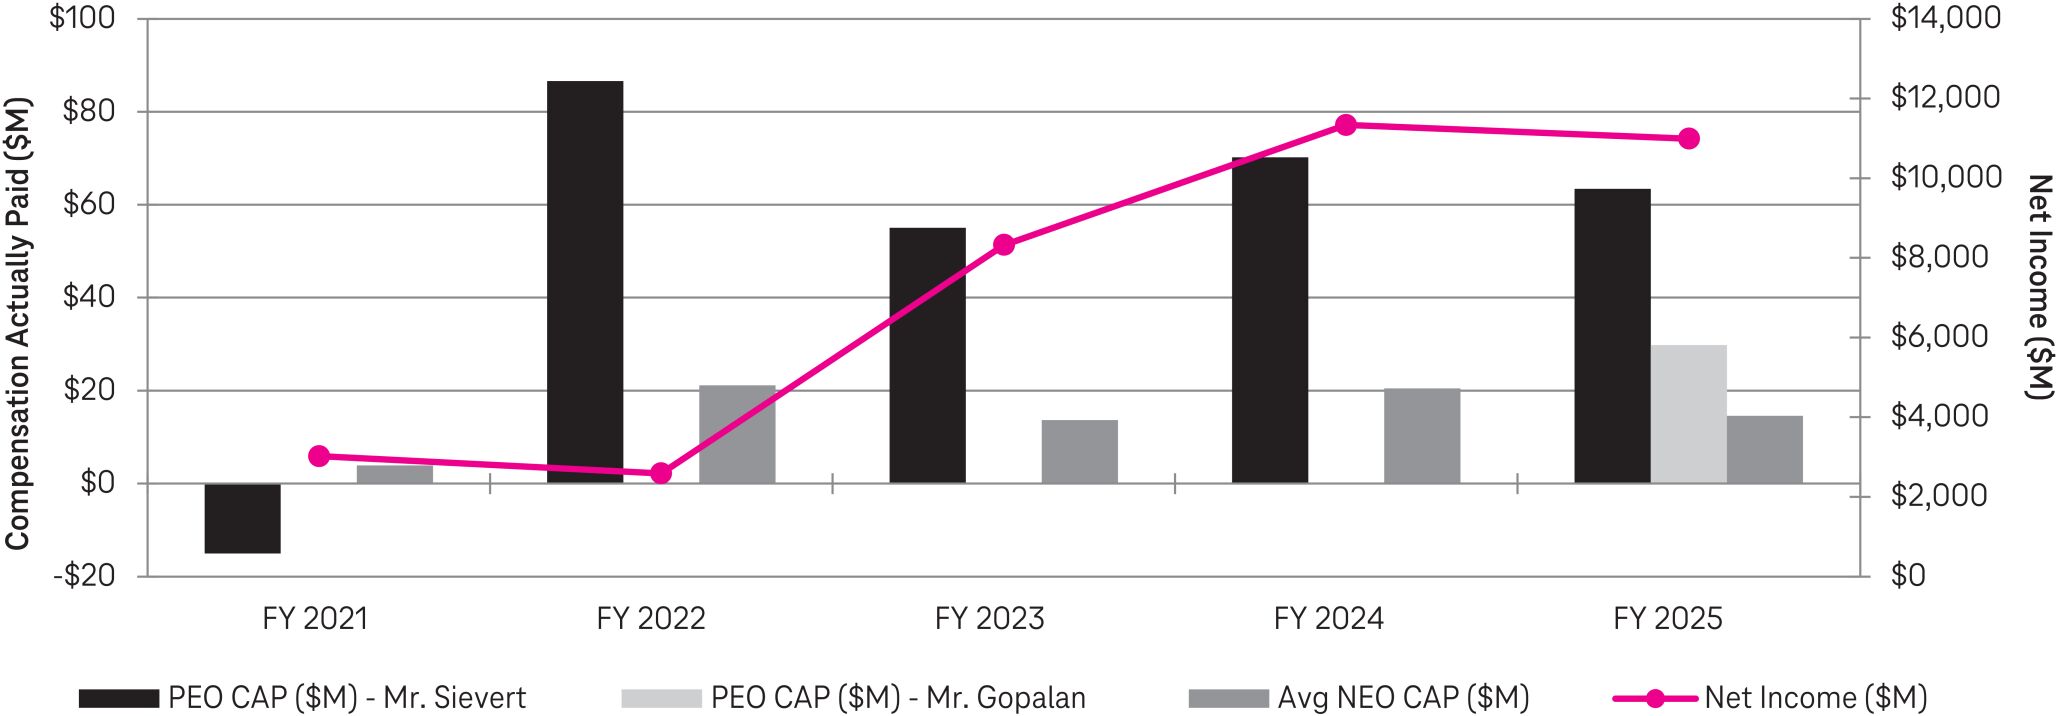
Compensation Actually Paid and Net Income
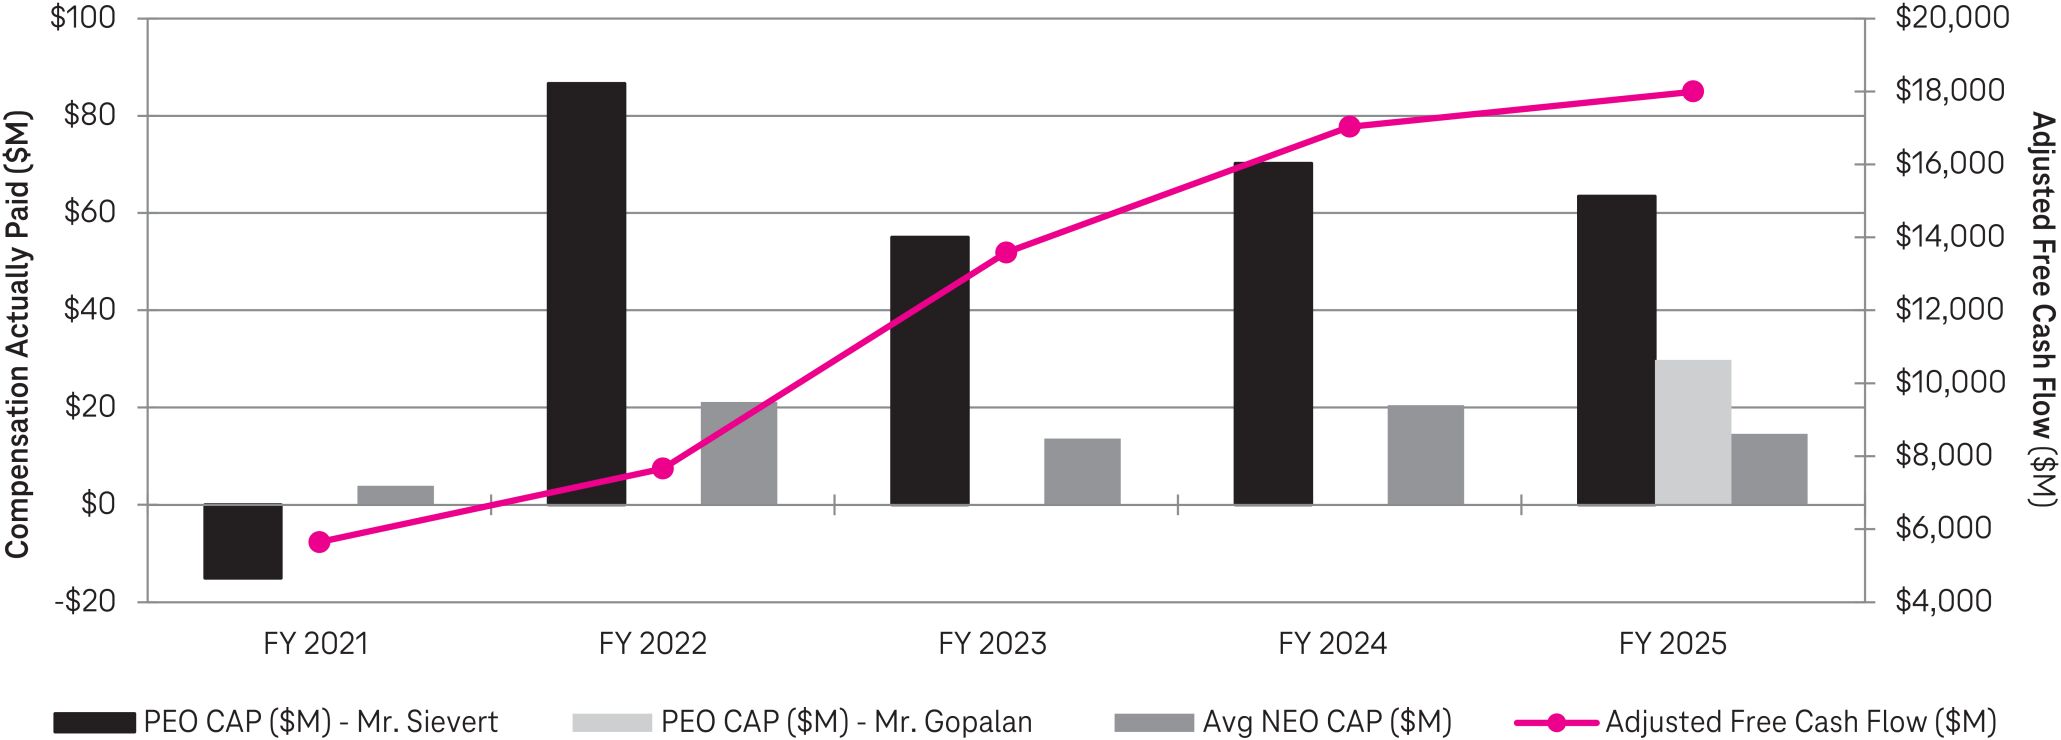
Compensation Actually Paid and Adjusted Free Cash Flow
Compensation Actually Paid, TSR, and Peer Group TSR
Pay Versus Performance Tabular List
We believe the following performance measures represent the most important financial performance measures used by us to link compensation actually paid to our NEOs for the fiscal year ended December 31, 2025:
Service Revenues; |
Core Adjusted EBITDA; and |
Adjusted Free Cash Flow. |
In the “Compensation Discussion and Analysis” section of this Proxy Statement, we provide greater detail on the elements of our executive compensation program and our “pay-for-performance” compensation philosophy. We believe the Company’s executive compensation program appropriately rewards our PEO and the Non-PEO NEOs for Company and individual performance, promotes retention of our senior leadership team and supports long-term value creation for our stockholders.