Pay vs Performance Disclosure - USD ($)
|
12 Months Ended |
Dec. 31, 2025 |
Dec. 31, 2024 |
Dec. 31, 2023 |
Dec. 31, 2022 |
Dec. 31, 2021 |
| Pay vs Performance Disclosure |
|
|
|
|
|
| Pay vs Performance Disclosure, Table |
|
| | | | | | | | | | | | | | | | | | Value of Initial Fixed $100 Investment Based On: | | | | | | | | | | | | | | | | | | | | | | | | | | | | | | | | | | | | | | | | | | | | | | | | | | | | | | | | | | | | | | | | | | | | | | | | | | | | | | | | | | | | | | | | | | | | | | | | | | | | | | | | | | | | | |
|
|
|
|
| Company Selected Measure Name |
|
Adjusted EBITDA
|
|
|
|
| Named Executive Officers, Footnote |
|
(a) Megan Clarken was our PEO from November 25, 2019 through February 15, 2025. Michael Komasinski has been our PEO since February 15, 2025.
|
|
|
|
| Peer Group Issuers, Footnote |
(g) The peer group used is the Nasdaq Internet Index, as used in the Company's performance graph in our annual report. Total shareholder return is calculated by assuming that a $100 investment was made on the day prior to the first fiscal year reported below and reinvesting all dividends until the last day of each reported fiscal year.
|
|
|
|
|
| Adjustment To PEO Compensation, Footnote |
|
(c) Compensation actually paid does not mean that our PEO was actually paid those amounts in the listed year, but this is a dollar amount derived from the starting point of summary compensation table total compensation under the methodology prescribed under the relevant rules as shown in the adjustment tables below. | | | | | | | | | Summary Compensation Table Totals | | − Change in Pension Value and Above Market Non-Qualified Deferred Compensation | | − Grant Date Fair Value of Option Awards and Stock Awards Granted in Fiscal Year | | + Fair Value at Fiscal Year-End of Outstanding and Unvested Option Awards and Stock Awards Granted in Fiscal Year | |
| | + Change in Fair Value of Outstanding and Unvested Option Awards and Stock Awards Granted in Prior Fiscal Years | | + Fair Value at Vesting of Option Awards and Stock Awards Granted in Fiscal Year That Vested During Fiscal Year | | + Change in Fair Value as of Vesting Date of Option Awards and Stock Awards Granted in Prior Fiscal Years For Which Applicable Vesting Conditions Were Satisfied During Fiscal Year | | − Fair Value as of Prior Fiscal Year-End of Option Awards and Stock Awards Granted in Prior Fiscal Years That Failed to Meet Applicable Vesting Conditions During Fiscal Year | | ‘+ Value of Dividends or other Earnings Paid on Stock or Option Awards not Otherwise Reflected in Fair Value or Total Compensation | | Compensation Actually Paid | |
| | | | | | | | | Summary Compensation Table Totals | | − Change in Pension Value and Above Market Non-Qualified Deferred Compensation | | − Grant Date Fair Value of Option Awards and Stock Awards Granted in Fiscal Year | | + Fair Value at Fiscal Year-End of Outstanding and Unvested Option Awards and Stock Awards Granted in Fiscal Year | | + Change in Fair Value of Outstanding and Unvested Option Awards and Stock Awards Granted in Prior Fiscal Years | | + Fair Value at Vesting of Option Awards and Stock Awards Granted in Fiscal Year That Vested During Fiscal Year | | + Change in Fair Value as of Vesting Date of Option Awards and Stock Awards Granted in Prior Fiscal Years For Which Applicable Vesting Conditions Were Satisfied During Fiscal Year | | − Fair Value as of Prior Fiscal Year-End of Option Awards and Stock Awards Granted in Prior Fiscal Years That Failed to Meet Applicable Vesting Conditions During Fiscal Year | | ‘+ Value of Dividends or other Earnings Paid on Stock or Option Awards not Otherwise Reflected in Fair Value or Total Compensation | | Compensation Actually Paid | |
*The assumptions used for determining the fair values shown in these tables are materially consistent with those used to determine the fair values disclosed as of the grant date of such awards.
|
|
|
|
| Non-PEO NEO Average Total Compensation Amount |
$ 4,670,402
|
$ 4,299,117
|
$ 3,482,977
|
$ 2,573,107
|
$ 1,879,611
|
| Non-PEO NEO Average Compensation Actually Paid Amount |
$ (1,486,790)
|
8,199,560
|
2,911,501
|
(84,334)
|
5,097,357
|
| Adjustment to Non-PEO NEO Compensation Footnote |
(e) These amounts are the average of compensation actually paid for our NEOs other than our PEO in each listed year. Compensation actually paid does not mean that these NEOs were actually paid those amounts in the listed year, but this is a dollar amount derived from the starting point of Summary Compensation Table total compensation under the methodology prescribed under the SEC's rules as shown in the table below, with the indicated figures showing an average of such figure for all NEOs other than our PEO in each listed year. | | | | | | | | | | Summary Compensation Table Total | | − Change in Pension Value and Above Market Non-Qualified Deferred Compensation | | − Grant Date Fair Value of Option Awards and Stock Awards Granted in Fiscal Year | | + Fair Value at Fiscal Year-End of Outstanding and Unvested Option Awards and Stock Awards Granted in Fiscal Year | | + Change in Fair Value of Outstanding and Unvested Option Awards and Stock Awards Granted in Prior Fiscal Years | | + Fair Value at Vesting of Option Awards and Stock Awards Granted in Fiscal Year That Vested During Fiscal Year | | + Change in Fair Value as of Vesting Date of Option Awards and Stock Awards Granted in Prior Fiscal Years For Which Applicable Vesting Conditions Were Satisfied During Fiscal Year | | − Fair Value as of Prior Fiscal Year-End of Option Awards and Stock Awards Granted in Prior Fiscal Years That Failed to Meet Applicable Vesting Conditions During Fiscal Year | | ‘+ Value of Dividends or other Earnings Paid on Stock or Option Awards not Otherwise Reflected in Fair Value or Total Compensation | | Compensation Actually Paid | |
*Note that the fair value assumptions shown with respect to footnote (c) apply to the figures in this table as well.
|
|
|
|
|
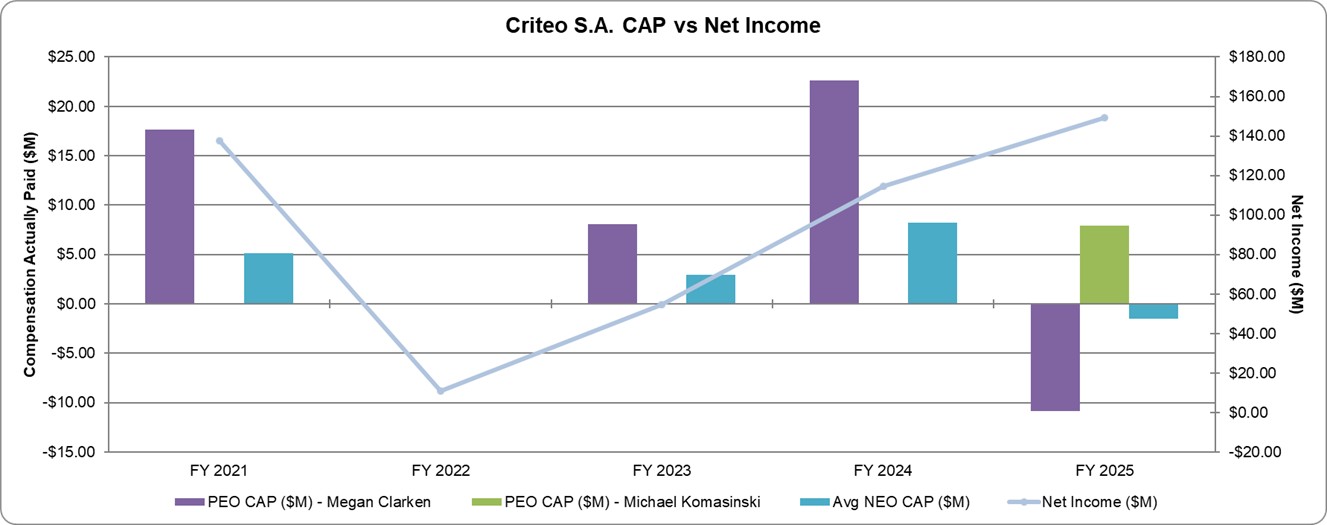
| Compensation Actually Paid vs. Net Income |
|
|
|
|
|
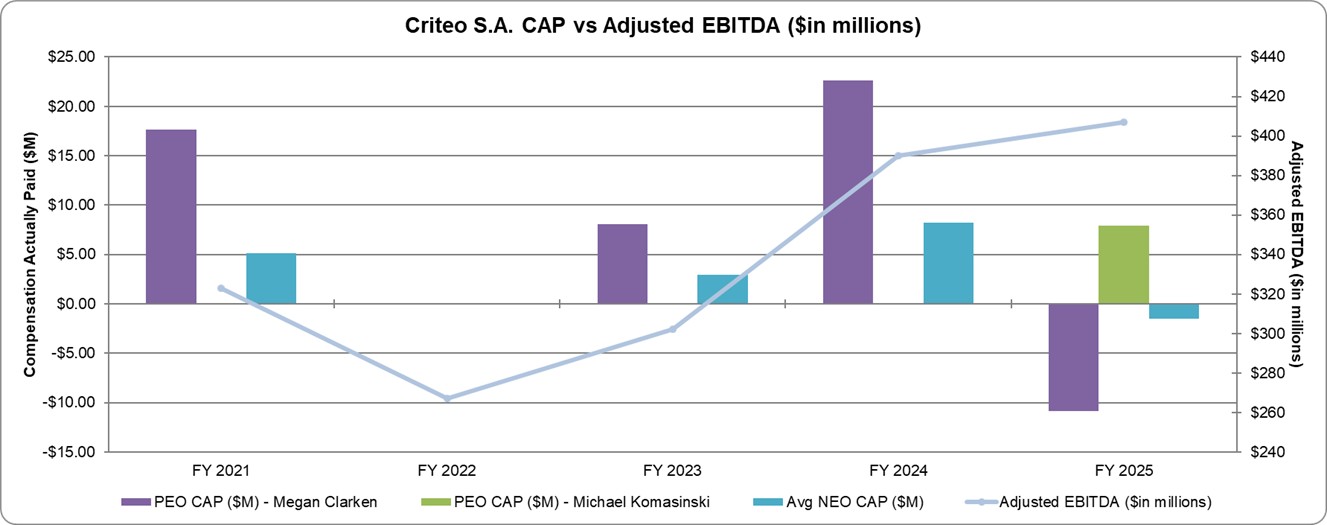
| Compensation Actually Paid vs. Company Selected Measure |
|
|
|
|
|
| Total Shareholder Return Amount |
$ 100.49
|
192.88
|
123.45
|
127.06
|
189.52
|
| Peer Group Total Shareholder Return Amount |
120.18
|
103.66
|
80.02
|
49.66
|
94.84
|
| Net Income (Loss) |
$ 149,000,000
|
$ 115,000,000
|
$ 55,000,000
|
$ 11,000,000
|
$ 138,000,000
|
| Company Selected Measure Amount |
407,000,000
|
390,000,000
|
302,000,000
|
267,000,000
|
323,000,000
|
| PEO Name |
|
Megan Clarken
|
|
|
|
| Additional 402(v) Disclosure |
(f) Total shareholder return is calculated by assuming that a $100 investment was made on the day prior to the first fiscal year reported below and reinvesting all dividends until the last day of each reported fiscal year. (h) The dollar amounts reported are the Company's net income reflected in the Company’s audited financial statements.
|
(b) Represents the total compensation paid to our PEO in each listed year, as shown in our Summary Compensation Table for such listed year.(d) These amounts are the average of the total compensation paid to our NEOs other than our PEO in each listed year, as shown in our Summary Compensation Table for such listed year. The names of the non-PEO NEOs in each year are listed in the table below.
|
|
|
|
| Measure:: 1 |
|
|
|
|
|
| Pay vs Performance Disclosure |
|
|
|
|
|
| Name |
Contribution ex-TAC
|
|
|
|
|
| Non-GAAP Measure Description |
(i) In the Company's assessment Adjusted EBITDA is the financial performance measure that is the most important financial performance measure (other than total shareholder return and net income) used by the company in 2025 to link compensation actually paid to performance. Adjusted EBITDA can be determined from net income by adding back financial income (expense), income taxes, depreciation and amortization, and adjusting to eliminate the impact of equity awards compensation expense, pension service costs, certain restructuring, integration and transformation costs, certain acquisition costs and a loss contingency related to a regulatory matter.
|
|
|
|
|
| Measure:: 2 |
|
|
|
|
|
| Pay vs Performance Disclosure |
|
|
|
|
|
| Name |
Adjusted EBITDA
|
|
|
|
|
| Measure:: 3 |
|
|
|
|
|
| Pay vs Performance Disclosure |
|
|
|
|
|
| Name |
Retail Media Contribution ex-TAC
|
|
|
|
|
| Megan Clarken [Member] |
|
|
|
|
|
| Pay vs Performance Disclosure |
|
|
|
|
|
| PEO Total Compensation Amount |
$ 440,044
|
$ 10,655,670
|
$ 9,213,663
|
$ 7,063,702
|
$ 9,573,644
|
| PEO Actually Paid Compensation Amount |
(10,871,266)
|
$ 22,606,625
|
$ 8,037,540
|
$ 109,157
|
$ 17,678,710
|
| Michael Komasinski [Member] |
|
|
|
|
|
| Pay vs Performance Disclosure |
|
|
|
|
|
| PEO Total Compensation Amount |
12,477,560
|
|
|
|
|
| PEO Actually Paid Compensation Amount |
7,894,728
|
|
|
|
|
| PEO | Change in Pension Value and Above Market Non-Qualified Deferred Compensation [Member] |
|
|
|
|
|
| Pay vs Performance Disclosure |
|
|
|
|
|
| Adjustment to Compensation, Amount |
0
|
|
|
|
|
| PEO | Value of Dividends or other Earnings Paid on Stock or Option Awards not Otherwise Reflected in Fair Value or Total Compensation [Member] |
|
|
|
|
|
| Pay vs Performance Disclosure |
|
|
|
|
|
| Adjustment to Compensation, Amount |
0
|
|
|
|
|
| PEO | Megan Clarken [Member] | Change in Pension Value and Above Market Non-Qualified Deferred Compensation [Member] |
|
|
|
|
|
| Pay vs Performance Disclosure |
|
|
|
|
|
| Adjustment to Compensation, Amount |
0
|
|
|
|
|
| PEO | Megan Clarken [Member] | Grant Date Fair Value of Option Awards and Stock Awards Granted in Fiscal Year [Member] |
|
|
|
|
|
| Pay vs Performance Disclosure |
|
|
|
|
|
| Adjustment to Compensation, Amount |
0
|
|
|
|
|
| PEO | Megan Clarken [Member] | Fair Value at Fiscal Year-End of Outstanding and Unvested Option Awards and Stock Awards Granted in Fiscal Year [Member] |
|
|
|
|
|
| Pay vs Performance Disclosure |
|
|
|
|
|
| Adjustment to Compensation, Amount |
0
|
|
|
|
|
| PEO | Megan Clarken [Member] | Change in Fair Value of Outstanding and Unvested Option Awards and Stock Awards Granted in Prior Fiscal Years [Member] |
|
|
|
|
|
| Pay vs Performance Disclosure |
|
|
|
|
|
| Adjustment to Compensation, Amount |
(10,389,364)
|
|
|
|
|
| PEO | Megan Clarken [Member] | Fair Value at Vesting of Option Awards and Stock Awards Granted in Fiscal Year That Vested During Fiscal Year [Member] |
|
|
|
|
|
| Pay vs Performance Disclosure |
|
|
|
|
|
| Adjustment to Compensation, Amount |
0
|
|
|
|
|
| PEO | Megan Clarken [Member] | Change in Fair Value as of Vesting Date of Option Awards and Stock Awards Granted in Prior Fiscal Years For Which Applicable Vesting Conditions Were Satisfied During Fiscal Year [Member] |
|
|
|
|
|
| Pay vs Performance Disclosure |
|
|
|
|
|
| Adjustment to Compensation, Amount |
(921,946)
|
|
|
|
|
| PEO | Megan Clarken [Member] | Fair Value as of Prior Fiscal Year-End of Option Awards and Stock Awards Granted in Prior Fiscal Years That Failed to Meet Applicable Vesting Conditions During Fiscal Year [Member] |
|
|
|
|
|
| Pay vs Performance Disclosure |
|
|
|
|
|
| Adjustment to Compensation, Amount |
0
|
|
|
|
|
| PEO | Megan Clarken [Member] | Value of Dividends or other Earnings Paid on Stock or Option Awards not Otherwise Reflected in Fair Value or Total Compensation [Member] |
|
|
|
|
|
| Pay vs Performance Disclosure |
|
|
|
|
|
| Adjustment to Compensation, Amount |
0
|
|
|
|
|
| PEO | Michael Komasinski [Member] | Change in Pension Value and Above Market Non-Qualified Deferred Compensation [Member] |
|
|
|
|
|
| Pay vs Performance Disclosure |
|
|
|
|
|
| Adjustment to Compensation, Amount |
0
|
|
|
|
|
| PEO | Michael Komasinski [Member] | Grant Date Fair Value of Option Awards and Stock Awards Granted in Fiscal Year [Member] |
|
|
|
|
|
| Pay vs Performance Disclosure |
|
|
|
|
|
| Adjustment to Compensation, Amount |
(10,043,994)
|
|
|
|
|
| PEO | Michael Komasinski [Member] | Fair Value at Fiscal Year-End of Outstanding and Unvested Option Awards and Stock Awards Granted in Fiscal Year [Member] |
|
|
|
|
|
| Pay vs Performance Disclosure |
|
|
|
|
|
| Adjustment to Compensation, Amount |
5,461,162
|
|
|
|
|
| PEO | Michael Komasinski [Member] | Change in Fair Value of Outstanding and Unvested Option Awards and Stock Awards Granted in Prior Fiscal Years [Member] |
|
|
|
|
|
| Pay vs Performance Disclosure |
|
|
|
|
|
| Adjustment to Compensation, Amount |
0
|
|
|
|
|
| PEO | Michael Komasinski [Member] | Fair Value at Vesting of Option Awards and Stock Awards Granted in Fiscal Year That Vested During Fiscal Year [Member] |
|
|
|
|
|
| Pay vs Performance Disclosure |
|
|
|
|
|
| Adjustment to Compensation, Amount |
0
|
|
|
|
|
| PEO | Michael Komasinski [Member] | Change in Fair Value as of Vesting Date of Option Awards and Stock Awards Granted in Prior Fiscal Years For Which Applicable Vesting Conditions Were Satisfied During Fiscal Year [Member] |
|
|
|
|
|
| Pay vs Performance Disclosure |
|
|
|
|
|
| Adjustment to Compensation, Amount |
0
|
|
|
|
|
| PEO | Michael Komasinski [Member] | Fair Value as of Prior Fiscal Year-End of Option Awards and Stock Awards Granted in Prior Fiscal Years That Failed to Meet Applicable Vesting Conditions During Fiscal Year [Member] |
|
|
|
|
|
| Pay vs Performance Disclosure |
|
|
|
|
|
| Adjustment to Compensation, Amount |
0
|
|
|
|
|
| PEO | Michael Komasinski [Member] | Value of Dividends or other Earnings Paid on Stock or Option Awards not Otherwise Reflected in Fair Value or Total Compensation [Member] |
|
|
|
|
|
| Pay vs Performance Disclosure |
|
|
|
|
|
| Adjustment to Compensation, Amount |
0
|
|
|
|
|
| Non-PEO NEO | Grant Date Fair Value of Option Awards and Stock Awards Granted in Fiscal Year [Member] |
|
|
|
|
|
| Pay vs Performance Disclosure |
|
|
|
|
|
| Adjustment to Compensation, Amount |
(3,944,264)
|
|
|
|
|
| Non-PEO NEO | Fair Value at Fiscal Year-End of Outstanding and Unvested Option Awards and Stock Awards Granted in Fiscal Year [Member] |
|
|
|
|
|
| Pay vs Performance Disclosure |
|
|
|
|
|
| Adjustment to Compensation, Amount |
1,482,090
|
|
|
|
|
| Non-PEO NEO | Change in Fair Value of Outstanding and Unvested Option Awards and Stock Awards Granted in Prior Fiscal Years [Member] |
|
|
|
|
|
| Pay vs Performance Disclosure |
|
|
|
|
|
| Adjustment to Compensation, Amount |
(3,362,963)
|
|
|
|
|
| Non-PEO NEO | Fair Value at Vesting of Option Awards and Stock Awards Granted in Fiscal Year That Vested During Fiscal Year [Member] |
|
|
|
|
|
| Pay vs Performance Disclosure |
|
|
|
|
|
| Adjustment to Compensation, Amount |
0
|
|
|
|
|
| Non-PEO NEO | Change in Fair Value as of Vesting Date of Option Awards and Stock Awards Granted in Prior Fiscal Years For Which Applicable Vesting Conditions Were Satisfied During Fiscal Year [Member] |
|
|
|
|
|
| Pay vs Performance Disclosure |
|
|
|
|
|
| Adjustment to Compensation, Amount |
(332,056)
|
|
|
|
|
| Non-PEO NEO | Fair Value as of Prior Fiscal Year-End of Option Awards and Stock Awards Granted in Prior Fiscal Years That Failed to Meet Applicable Vesting Conditions During Fiscal Year [Member] |
|
|
|
|
|
| Pay vs Performance Disclosure |
|
|
|
|
|
| Adjustment to Compensation, Amount |
$ 0
|
|
|
|
|