The Portfolio seeks to provide capital appreciation and income while seeking to manage volatility.
This table describes the fees and expenses that you may pay if you buy, hold and sell shares of the Portfolio. The table and the example do not include any fees or sales charges imposed by your variable annuity contract. If they were included, your costs would be higher. Please refer to your variable annuity prospectus for information on the separate account fees and expenses associated with your contract.
|
Shareholder Fees (fees paid directly from your investment) |
Class II Shares |
||||||
| Maximum Sales Charge (Load) Imposed on Purchases (as a percentage of offering price) |
None |
||||||
| Maximum Deferred Sales Charge (Load) (as a percentage of redemption proceeds) |
None |
||||||
|
Maximum Sales Charge (Load) Imposed on Reinvested Dividends and Other Distributions |
None |
||||||
| Redemption Fee (as a percentage of amount redeemed) |
None |
||||||
|
Annual Portfolio Operating Expenses (expenses that you pay each year as a percentage of the value of your investment) |
|||||||
|
Management Fees |
0.55 |
% |
|||||
|
Distribution and Service (12b-1) Fees |
0.25 |
% |
|||||
|
Other Expenses |
0.15 |
% |
|||||
|
Acquired Fund Fees and Expenses(1) |
0.11 |
% |
|||||
|
Total Annual Portfolio Operating Expenses |
1.06 |
% |
|||||
|
Fee Waiver and/or Reimbursement(2) |
(0.07 |
)% |
|||||
|
Total Annual Portfolio Operating Expenses After Fee Waiver and/or Reimbursement |
0.99 |
% |
|||||
(1) Acquired Fund Fees and Expenses are the indirect cost of investing in other investment companies, the costs of which will not be included in the Portfolio's financial statements. The operating expenses in this fee table will not correlate to the expense ratio in the Portfolio's financial highlights because the financial statements include only the direct operating expenses incurred by the Portfolio.
(2) The Portfolio's investment adviser, Global Atlantic Investment Advisors, LLC (the "Adviser"), has contractually agreed to waive its fees and to reimburse expenses, at least until May 1, 2027, to ensure that total annual portfolio operating expenses after fee waiver and/or reimbursement (exclusive of any front-end or contingent deferred loads, brokerage fees and commissions, Acquired Fund Fees and Expenses, borrowing costs (such as interest and dividend expense on securities sold short), taxes and extraordinary expenses, such as litigation) will not exceed 0.88% of average daily net assets attributable to the Portfolio's shares. The expense reimbursement is subject to possible recoupment from the Portfolio in future years on a rolling three year basis (within the three years after the fees have been waived or reimbursed) if such recoupment, after giving effect to the recoupment amount, can be achieved within the lesser of the expense limits listed above and any expense limits applicable at the time of recoupment. The agreement may be terminated only by the Portfolio's Board of Trustees, on 60 days' written notice to the Adviser.
This Example is intended to help you compare the cost of investing in the Portfolio with the cost of investing in other mutual funds.
The Example assumes that you invest $10,000 in the Portfolio for the time periods indicated and then redeem all of your shares at the end of those periods. You would pay the same expenses if you did not redeem your shares. However, each variable annuity contract and separate account involves fees and expenses that are not included in the Example. If these fees and expenses were included in the Example, your overall expenses would be higher. The Example also assumes that your investment has a 5% return each year and that the Portfolio's operating expenses remain the same
(except that the Example reflects any applicable contractual fee waivers/expense reimbursement arrangements for only the first year). Although your actual costs may be higher or lower, based upon these assumptions your costs would be:
| 1 Year |
3 Years |
5 Years |
10 Years |
||||||||||||
| $ |
101 |
$ |
330 |
$ |
578 |
$ |
1,288 |
||||||||
| 1 Year |
3 Years |
5 Years |
10 Years |
||||||||||||
| $ |
101 |
$ |
330 |
$ |
578 |
$ |
1,288 |
||||||||
The Portfolio pays transaction costs, such as commissions, when it buys and sells securities or instruments (or "turns over" its portfolio). These costs, which are not reflected in annual portfolio operating expenses or in the Example, affect the Portfolio's performance. A higher portfolio turnover rate may indicate higher transaction costs. During the most recent fiscal year ended December 31, 2025, the Portfolio's portfolio turnover rate was 32% of the average value of its portfolio.
The Adviser allocates a portion of the Portfolio to a capital appreciation and income component (the "Capital Appreciation and Income Component") managed by BlackRock Investment Management, LLC ("BlackRock" or a "Sub-Adviser") and a portion to a managed risk component (the "Managed Risk Component") managed by Milliman Financial Risk Management LLC ("Milliman" or a "Sub-Adviser"). BlackRock manages the Capital Appreciation and Income Component pursuant to a strategy that seeks to invest in a combination of iShares Exchange Traded Funds ("ETFs") that are affiliated with BlackRock and are offered through different prospectuses. The Portfolio intends its strategy of providing exposure to a combination of ETFs to result in investment diversification that an investor could otherwise achieve only by holding numerous individual investments. Milliman manages the Managed Risk Component pursuant to a strategy that seeks to manage portfolio volatility and provide downside risk management.
The Adviser seeks to achieve the Portfolio's investment objective by allocating, under normal circumstances, at least 80% of the Portfolio's net assets, plus any borrowings for investment purposes, to the Capital Appreciation and Income Component and up to 20% of the Portfolio's net assets to the Managed Risk Component. BlackRock expects to further allocate approximately 85% of the Capital Appreciation and Income Component assets to equity-based ETFs, and approximately 15% to fixed-income-based ETFs, although BlackRock may modify the target allocation from time to time. The Portfolio incorporates a global tactical asset allocation strategy that, under normal circumstances, seeks to adjust allocations to asset classes that BlackRock deems to be attractive investments over the short to intermediate term. This strategy seeks to enhance the total return and manages portfolio risk at the aggregate level. Modifications in the allocations to the ETFs are based on techniques that may include technical, qualitative, quantitative and momentum analysis of the market. The mix of ETFs will vary with market conditions and BlackRock's assessment of the ETFs' relative attractiveness as investment opportunities.
The ETFs' investments will focus on investments in securities listed on domestic and foreign equity exchanges with growth and value styles, including, small-, mid- and large-cap issuers, and on investments in domestic and foreign fixed-income instruments including U.S. treasuries, mortgage- and asset-backed securities, corporate loans, distressed securities, inflation-indexed instruments, corporate bonds, sovereign and emerging market debt. An ETF may invest a large percentage of its assets in indices located in a single country, a small number of countries, or a particular geographic region. As a result of its exposure to the ETFs, the Portfolio indirectly provides exposure principally to U.S. and non-U.S. equity and fixed-income securities and derivatives. In addition, the ETFs may invest in debt assets in lower quality debt securities (rated Ba1 or below and BB+ or below by Nationally Recognized Statistical Rating Organizations designated by the ETFs' adviser or unrated but determined to be of equivalent quality by the ETFs' adviser). Such securities are sometimes referred to as "junk bonds." An ETF may integrate environmental, social and governance ("ESG") factors into its investment selection process and/or screen out particular companies and industries based on certain ESG related criteria. An ETF may also seek to deliver exposure to certain style factors (i.e., quality, value, momentum, size, minimum volatility).
In the Managed Risk Component, the Adviser seeks to manage return volatility by employing Milliman to execute a managed risk strategy, which consists of using hedge instruments to reduce the downside risk of the Portfolio's securities. Milliman may use hedge instruments to accomplish this goal, which may include: equity futures contracts, treasury futures contracts, currency futures contracts, and other hedge instruments judged by Milliman to be necessary to achieve the goals of the managed risk strategy. Milliman may also buy or sell hedge instruments based on one or more market indices in an attempt to maintain the Portfolio's volatility at the targeted level in an environment in which Milliman expects market volatility to decrease or increase, respectively. Milliman selects individual hedge instruments that it believes will have prices that are highly correlated to the Portfolio's positions. Milliman adjusts hedge instruments to manage overall net Portfolio risk exposure, in an attempt to stabilize the volatility of the Portfolio around a predetermined target level
and reduce the potential for portfolio losses during periods of significant and sustained market decline. Milliman seeks to monitor and forecast volatility in the markets using a proprietary model, and adjust the Portfolio's hedge instruments accordingly. In addition, Milliman will monitor liquidity levels of relevant hedge instruments and transparency provided by exchanges or counterparties in hedging transactions. Milliman adjusts futures positions to manage overall net Portfolio risk exposure. Milliman may, during periods of rising security prices, implement strategies to preserve gains on the Portfolio's positions. Milliman may, during periods of falling security prices, implement additional strategies to reduce losses in adverse market conditions. In these situations, Milliman's activity could significantly reduce the Portfolio's net economic exposure to equity securities. Following market declines, a downside rebalancing strategy will be used to decrease the amount of hedge instruments used to hedge the Portfolio. Milliman also adjusts hedge instruments to realign individual hedges when the Adviser rebalances the Portfolio's asset allocation profile.
Depending on market conditions, scenarios may occur where the Portfolio has no positions in any hedge instruments.
The bar chart and performance table below show the variability of the Portfolio's returns, which is some indication of the risks of investing in the Portfolio. The bar chart shows performance of the Portfolio's Class II shares for each full calendar year since the Portfolio's inception and the table shows how the average annual total returns of the Portfolio's Class II shares compared with the returns of two indexes. The S&P Global Managed Risk LargeMidCap Index – Moderate Aggressive serves as the Portfolio's performance index because the Adviser believes it is more representative of the Portfolio's investment strategy. The S&P 500® Index serves as the Portfolio's regulatory index and provides a broad measure of market performance. The performance in the bar chart and the table does not include the effect of variable contract charges. If variable contract charges had been included, performance would have been lower. You should be aware that the Portfolio's past performance may not be an indication of how the Portfolio will perform in the future. Prior to October 1, 2016, the Capital Appreciation and Income Component of the Portfolio was managed by the Adviser without the use of a sub-adviser. The performance prior to that date is attributable to the Adviser's asset allocation decisions. In addition, the sub-adviser to the Capital Appreciation and Income Component of the Portfolio changed from BlackRock Financial Management, Inc. to BlackRock, effective May 1, 2021. No changes were made to the Portfolio's principal investment strategies or to the portfolio management team as a result of the change in sub-adviser.
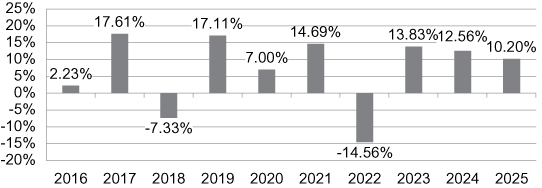
|
Highest Quarter |
4th Quarter 2023 |
9.00% |
|||||||||
|
Lowest Quarter |
4th Quarter 2018 |
-10.11% |
|||||||||
|
One Year |
Five Years |
Ten Years |
|||||||||||||
|
Class II shares return before taxes |
10.20 |
% |
6.71 |
% |
6.81 |
% |
|||||||||
|
S&P Global Managed Risk LargeMidCap Index – Moderate Aggressive (reflects no deduction for fees, expenses or taxes) |
12.57 |
% |
7.87 |
% |
8.11 |
% |
|||||||||
|
S&P 500® Index (reflects no deduction for fees, expenses or taxes) |
17.88 |
% |
14.42 |
% |
14.82 |
% |
|||||||||