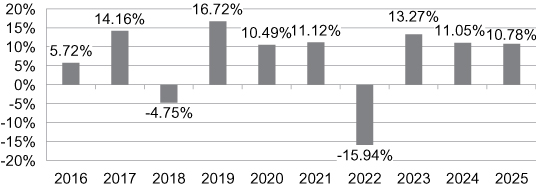
The bar chart and performance table below show the variability of the Portfolio's returns, which is some indication of the risks of investing in the Portfolio. The bar chart shows performance of the Portfolio's Class II shares for each full calendar year since the Portfolio's inception and the table shows how the average annual total returns of the Portfolio's Class II shares compared with the returns of two indexes. The S&P Global Managed Risk LargeMidCap Index – Moderate Conservative serves as the Portfolio's performance index because the Adviser believes it is more representative of the Portfolio's investment strategy. The MSCI World Index serves as the Portfolio's regulatory index and provides a broad measure of market performance. The performance in the bar chart and the table does not include the effect of variable contract charges. If variable contract charges had been included, performance would have been lower. You should be aware that the Portfolio's past performance may not be an indication of how the Portfolio will perform in the future. Prior to October 1, 2016, the Capital Appreciation and Income Component of the Portfolio was managed by the Adviser without the use of a sub-adviser. The performance prior to that date is attributable to the Adviser's asset allocation decisions.
|
Highest Quarter |
4th Quarter 2023 |
9.04 |
% |
||||||||
|
Lowest Quarter |
1st Quarter 2020 |
-9.64 |
% |
||||||||
|
One Year |
Five Years |
Ten Years |
|||||||||||||
|
Class II shares return before taxes |
10.78 |
% |
5.39 |
% |
6.78 |
% |
|||||||||
|
S&P Global Managed Risk LargeMidCap Index – Moderate Conservative (reflects no deduction for fees, expenses or taxes) |
11.34 |
% |
5.93 |
% |
6.71 |
% |
|||||||||
|
MSCI World Index (reflects no deduction for fees, expenses or taxes) |
21.09 |
% |
12.15 |
% |
12.17 |
% |
|||||||||
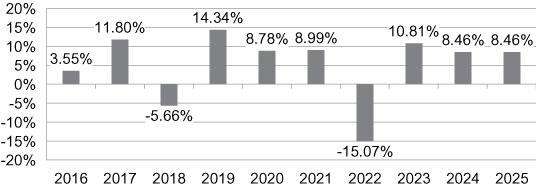
The bar chart and performance table below show the variability of the Portfolio's returns, which is some indication of the risks of investing in the Portfolio. The bar chart shows performance of the Portfolio's Class II shares for each full calendar year since the Portfolio's inception and the table shows how the average annual total returns of the Portfolio's Class II shares compared with the returns of two indexes. The S&P Global Managed Risk LargeMidCap Index – Conservative serves as the Portfolio's performance index because the Adviser believes it is more representative of the Portfolio's investment strategy. The MSCI World Index serves as the Portfolio's regulatory index and provides a broad measure of market performance. The performance in the bar chart and the table does not include the effect of variable contract charges. If variable contract charges had been included, performance would have been lower. You should be aware that the Portfolio's past performance may not be an indication of how the Portfolio will perform in the future. Prior to October 1, 2016, the Capital Appreciation and Income Component of the Portfolio was managed by the Adviser without the use of a sub-adviser. The performance prior to that date is attributable to the Adviser's asset allocation decisions. In addition, the sub-adviser to the Capital Appreciation and Income Component of the Portfolio changed from BlackRock Financial Management, Inc. to BlackRock, effective May 1, 2021. No changes were made to the Portfolio's principal investment strategies or to the portfolio management team as a result of the change in sub-adviser.
|
Highest Quarter |
4th Quarter 2023 |
7.88% |
|||||||||
|
Lowest Quarter |
2nd Quarter 2022 |
-7.30% |
|||||||||
|
One Year |
Five Years |
Ten Years |
|||||||||||||
|
Class II shares return before taxes |
8.46 |
% |
3.83 |
% |
5.07 |
% |
|||||||||
|
S&P Global Managed Risk LargeMidCap Index – Conservative (reflects no deduction for fees, expenses or taxes) |
10.52 |
% |
4.87 |
% |
5.95 |
% |
|||||||||
|
MSCI World Index (reflects no deduction for fees, expenses or taxes) |
21.09 |
% |
12.15 |
% |
12.17 |
% |
|||||||||
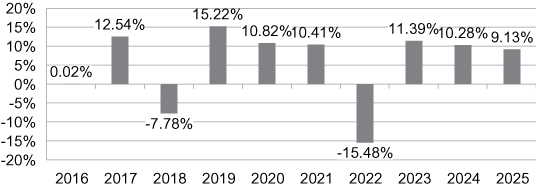
The bar chart and performance table below show the variability of the Portfolio's returns, which is some indication of the risks of investing in the Portfolio. The bar chart shows performance of the Portfolio's Class II shares for each full calendar year since the Portfolio's inception and the table shows how the average annual total returns of the Portfolio's Class II shares compared with the returns of two indexes. The S&P Global Managed Risk LargeMidCap Index – Moderate Conservative serves as the Portfolio's performance index because the Adviser believes it is more representative of the Portfolio's investment strategy. The MSCI All Country World Index ("MSCI ACWI Index") (Net Total Return, USD) serves as the Portfolio's regulatory index and provides a broad measure of market performance. The performance in the bar chart and the table does not include the effect of variable contract charges. If variable contract charges had been included, performance would have been lower. You should be aware that the Portfolio's past performance may not be an indication of how the Portfolio will perform in the future.
Prior to May 1, 2019, the Capital Appreciation and Income Component of the Portfolio was managed pursuant to a different investment strategy by the Adviser without the use of a sub-adviser. The performance prior to that date is attributable to the Adviser and the prior investment strategy.
|
Highest Quarter |
4th Quarter 2023 |
8.10% |
|||||||||
|
Lowest Quarter |
1st Quarter 2020 |
-8.01% |
|||||||||
|
One Year |
Five Years |
Ten Years |
|||||||||||||
|
Class II shares return before taxes |
9.13 |
% |
4.58 |
% |
5.19 |
% |
|||||||||
|
S&P Global Managed Risk LargeMidCap Index – Moderate Conservative (reflects no deduction for fees, expenses or taxes) |
11.34 |
% |
5.93 |
% |
6.71 |
% |
|||||||||
|
MSCI ACWI Index (Net Total Return, USD) (reflects no deduction for fees, expenses or taxes) |
22.34 |
% |
11.19 |
% |
11.72 |
% |
|||||||||
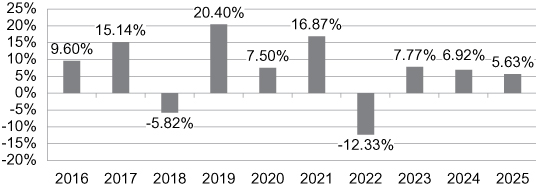
The bar chart and performance table below show the variability of the Portfolio's returns, which is some indication of the risks of investing in the Portfolio. The bar chart shows performance of the Portfolio's Class II shares for each full calendar year since the Portfolio's inception and the table shows how the average annual total returns of the Portfolio's Class II shares compared with the returns of two indexes. The S&P 500 Managed Risk Index – Moderate serves as the Portfolio's performance index because the Adviser believes it is more representative of the Portfolio's investment strategy. The S&P 500® Index serves as the Portfolio's regulatory index and provides a broad measure of market performance. The performance in the bar chart and the table does not include the effect of variable contract charges. If variable contract charges had been included, performance would have been lower. You should be aware that the Portfolio's past performance may not be an indication of how the Portfolio will perform in the future.
Prior to July 5, 2017, the fixed-income sleeve of the Capital Appreciation and Income Component of the Portfolio was managed by the Adviser without the use of a sub-adviser. The performance prior to that date is attributable to the Adviser's asset allocation decisions. The sub-adviser to the equity sleeve of the Capital Appreciation and Income Component of the Portfolio changed effective March 1, 2018 due to an organizational restructuring whereby all of the investment personnel responsible for the management of the equity sleeve transitioned from Franklin Advisory Services, LLC to Franklin Advisers.
|
Highest Quarter |
1st Quarter 2019 |
9.37% |
|||||||||
|
Lowest Quarter |
1st Quarter 2020 |
-11.38% |
|||||||||
|
One Year |
Five Years |
Ten Years |
|||||||||||||
|
Class II shares return before taxes |
5.63 |
% |
4.50 |
% |
6.72 |
% |
|||||||||
|
S&P 500 Managed Risk Index – Moderate (reflects no deduction for fees, expenses or taxes) |
7.47 |
% |
8.36 |
% |
8.78 |
% |
|||||||||
|
S&P 500® Index (reflects no deduction for fees, expenses or taxes) |
17.88 |
% |
14.42 |
% |
14.82 |
% |
|||||||||
The bar chart and performance table below show the variability of the Portfolio's returns, which is some indication of the risks of investing in the Portfolio. The bar chart shows performance of the Portfolio's Class II shares for each full calendar year since the Portfolio's inception and the table shows how the average annual total returns of the Portfolio's Class II shares compared with the returns of two indexes. The S&P Global Managed Risk LargeMidCap Index – Moderate Conservative serves as the Portfolio's performance index because the Adviser believes it is more representative of the Portfolio's investment strategy. The MSCI World Index serves as the Portfolio's regulatory index and provides a broad measure of market performance. The performance in the bar chart and the table does not include the effect of variable contract charges. If variable contract charges had been included, performance would have been lower. You should be aware that the Portfolio's past performance may not be an indication of how the Portfolio will perform in the future. Prior to October 1, 2016, the Capital Appreciation and Income Component of the Portfolio was managed by the Adviser without the use of a sub-adviser. The performance prior to that date is attributable to the Adviser's asset allocation decisions. In addition, the sub-adviser to the Capital Appreciation and Income Component of the Portfolio changed from BlackRock Financial Management, Inc. to BlackRock, effective May 1, 2021. No changes were made to the Portfolio's principal investment strategies or to the portfolio management team as a result of the change in sub-adviser.
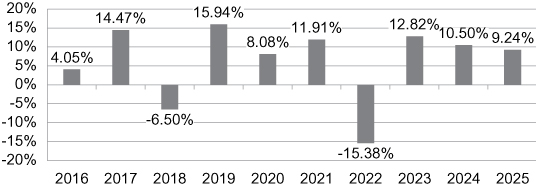
|
Highest Quarter |
4th Quarter 2023 |
8.63% |
|||||||||
|
Lowest Quarter |
4th Quarter 2018 |
-8.73% |
|||||||||
|
One Year |
Five Years |
Ten Years |
|||||||||||||
|
Class II shares return before taxes |
9.24 |
% |
5.22 |
% |
6.05 |
% |
|||||||||
|
S&P Global Managed Risk LargeMidCap Index – Moderate Conservative (reflects no deduction for fees, expenses or taxes) |
11.34 |
% |
5.93 |
% |
6.71 |
% |
|||||||||
|
MSCI World Index (reflects no deduction for fees, expenses or taxes) |
21.09 |
% |
12.15 |
% |
12.17 |
% |
|||||||||
The bar chart and performance table below show the variability of the Portfolio's returns, which is some indication of the risks of investing in the Portfolio. The bar chart shows performance of the Portfolio's Class II shares for each full calendar year since the Portfolio's inception and the table shows how the average annual total returns of the Portfolio's Class II shares compared with the returns of two indexes. The S&P Global Managed Risk LargeMidCap Index – Moderate Aggressive serves as the Portfolio's performance index because the Adviser believes it is more representative of the Portfolio's investment strategy. The S&P 500® Index serves as the Portfolio's regulatory index and provides a broad measure of market performance. The performance in the bar chart and the table does not include the effect of variable contract charges. If variable contract charges had been included, performance would have been lower. You should be aware that the Portfolio's past performance may not be an indication of how the Portfolio will perform in the future. Prior to October 1, 2016, the Capital Appreciation and Income Component of the Portfolio was managed by the Adviser without the use of a sub-adviser. The performance prior to that date is attributable to the Adviser's asset allocation decisions. In addition, the sub-adviser to the Capital Appreciation and Income Component of the Portfolio changed from BlackRock Financial Management, Inc. to BlackRock, effective May 1, 2021. No changes were made to the Portfolio's principal investment strategies or to the portfolio management team as a result of the change in sub-adviser.
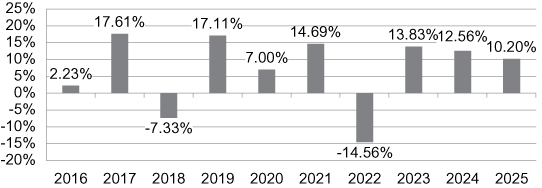
|
Highest Quarter |
4th Quarter 2023 |
9.00% |
|||||||||
|
Lowest Quarter |
4th Quarter 2018 |
-10.11% |
|||||||||
|
One Year |
Five Years |
Ten Years |
|||||||||||||
|
Class II shares return before taxes |
10.20 |
% |
6.71 |
% |
6.81 |
% |
|||||||||
|
S&P Global Managed Risk LargeMidCap Index – Moderate Aggressive (reflects no deduction for fees, expenses or taxes) |
12.57 |
% |
7.87 |
% |
8.11 |
% |
|||||||||
|
S&P 500® Index (reflects no deduction for fees, expenses or taxes) |
17.88 |
% |
14.42 |
% |
14.82 |
% |
|||||||||
The bar chart and performance table below show the variability of the Portfolio's returns, which is some indication of the risks of investing in the Portfolio. The bar chart shows performance of the Portfolio's Class II shares for each full calendar year since the Portfolio's inception and the table shows how the average annual total returns of the Portfolio's Class II shares compared with the returns of two indexes. The S&P Global Managed Risk LargeMidCap Index – Moderate serves as the Portfolio's performance index because the Adviser believes it is more representative of the Portfolio's investment strategy. The MSCI World Index serves as the Portfolio's regulatory index and provides a broad measure of market performance. The performance in the bar chart and the table does not include the effect of variable contract charges. If variable contract charges had been included, performance would have been lower. You should be aware that the Portfolio's past performance may not be an indication of how the Portfolio will perform in the future. Prior to October 1, 2016, the Capital Appreciation and Income Component of the Portfolio was managed by the Adviser without the use of a sub-adviser. The performance prior to that date is attributable to the Adviser's asset allocation decisions.
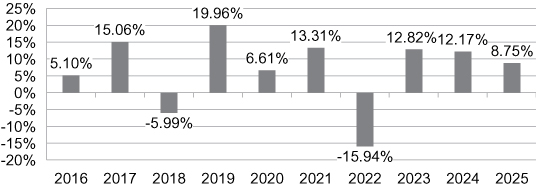
|
Highest Quarter |
4th Quarter 2023 |
8.84% |
|||||||||
|
Lowest Quarter |
1st Quarter 2020 |
-11.41% |
|||||||||
|
One Year |
Five Years |
Ten Years |
|||||||||||||
|
Class II shares return before taxes |
8.75 |
% |
5.56 |
% |
6.65 |
% |
|||||||||
|
S&P Global Managed Risk LargeMidCap Index – Moderate (reflects no deduction for fees, expenses or taxes) |
11.89 |
% |
6.92 |
% |
7.42 |
% |
|||||||||
|
MSCI World Index (reflects no deduction for fees, expenses or taxes) |
21.09 |
% |
12.15 |
% |
12.17 |
% |
|||||||||
The bar chart and performance table below show the variability of the Portfolio's returns, which is some indication of the risks of investing in the Portfolio. The bar chart shows performance of the Portfolio's Class II shares for each full calendar year since the Portfolio's inception and the table shows how the average annual total returns of the Portfolio's Class II shares compared with the returns of two indexes. The S&P 500 Managed Risk Index – Moderate Conservative serves as the Portfolio's performance index because the Adviser believes it is more representative of the Portfolio's investment strategy. The MSCI World Index serves as the Portfolio's regulatory index and provides a broad measure of market performance. The performance in the bar chart and the table does not include the effect of variable contract charges. If variable contract charges had been included, performance would have been lower. You should be aware that the Portfolio's past performance may not be an indication of how the Portfolio will perform in the future.
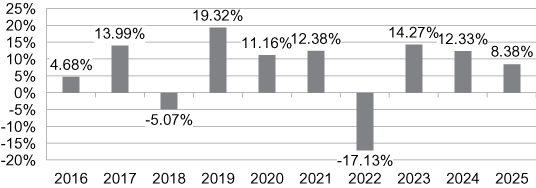
|
Highest Quarter |
4th Quarter 2023 |
9.31% |
|||||||||
|
Lowest Quarter |
4th Quarter 2018 |
-9.20% |
|||||||||
|
One Year |
Five Years |
Ten Years |
|||||||||||||
|
Class II shares return before taxes |
8.38 |
% |
5.32 |
% |
6.89 |
% |
|||||||||
|
S&P 500 Managed Risk Index – Moderate Conservative (reflects no deduction for fees, expenses or taxes) |
7.41 |
% |
7.19 |
% |
7.94 |
% |
|||||||||
|
MSCI World Index (reflects no deduction for fees, expenses or taxes) |
21.09 |
% |
12.15 |
% |
12.17 |
% |
|||||||||