The bar chart below shows how the Fund’s investment results have varied from year to year as represented by the performance of Class I shares. Returns for Class C shares, which are not presented in the bar chart, would be different than the returns for Class I shares. Although Class C shares have similar annual returns to Class I shares because the classes are invested in the same portfolio of securities, the returns for Class C shares are different from Class I shares because Class C shares have different expenses than Class I shares. The table below shows how the Fund’s average annual total returns compare over time to those of a broad-based securities market index and a supplemental index. This information provides some indication of the risks of investing in the Fund. Past performance of the Fund is not necessarily an indication of how it will perform in the future.
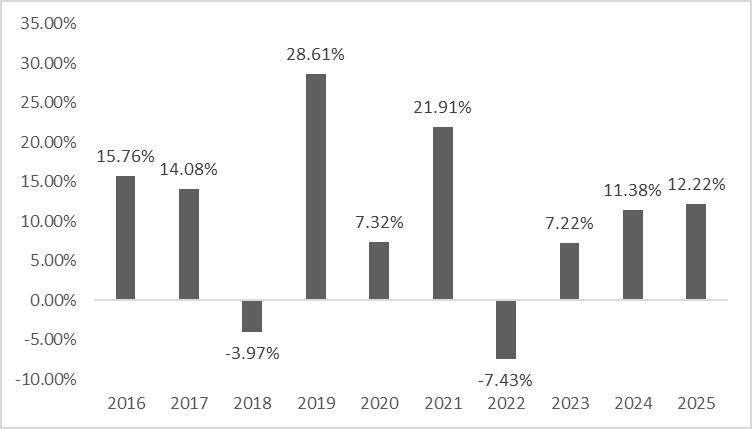
The Best/Worst quarterly results during this time period were:
| Best Quarter: | nd Quarter, 2020, | 15.00% |
| Worst Quarter: | st Quarter, 2020, | (20.54)% |
| Class I | One Year | Five Years | Ten Years | |||
| Return Before Taxes | 12.22% | 8.62% | 10.22% | |||
| Return After Taxes on Distributions | 10.71% | 7.42% | 8.75% | |||
| Return After Taxes on Distributions and Sale of Fund Shares | 8.30% | 6.67% | 8.01% | |||
| Class C | ||||||
| Return Before Taxes | 11.05% | 7.53% | 9.12% | |||
| Russell 1000® Index1 (reflects no deductions for fees, expenses or taxes) | 17.37% | 13.59% | 14.59% | |||
| Russell 1000® Value Index2 (reflects no deductions for fees, expenses or taxes) | 15.91% | 11.33% | 10.53% |
| 1 - | The Russell 1000® Index measures the performance of the large-cap segment of the US equity universe. It is a subset of the Russell 3000® Index and includes approximately 1,000 of the largest securities based on a combination of their market cap and current index membership. The Russell 1000® represents approximately 93% of the Russell 3000® Index, as of the most recent reconstitution. The Russell 1000® Index is constructed to provide a comprehensive and unbiased barometer for the large-cap segment and is completely reconstituted annually to ensure new and growing equities are included. Index returns assume reinvestment of dividends and do not reflect the deduction of taxes and fees. Individuals cannot invest directly in an index; however, an individual can invest in exchange traded funds or other investment vehicles that attempt to track the performance of a benchmark index. |
| 2 - | The Russell 1000® Value Index measures the performance of the large cap value segment of the US equity universe. It includes those Russell 1000 companies with relatively lower price-to-book ratios, lower I/B/E/S forecast medium term (2 year) growth and lower sales per share historical growth (5 years). The Russell 1000® Value Index is constructed to provide a comprehensive and unbiased barometer for the large-cap value segment. The index is completely reconstituted annually to ensure new and growing equities are included and that the represented companies continue to reflect value characteristics. Index returns assume reinvestment of all distributions and do not reflect the deduction of taxes and fees. Individuals cannot invest directly in an index; however, an individual may invest in exchange-traded funds or other investment vehicles that attempt to track the performance of a benchmark index. |
After-tax returns are calculated using the historical highest individual federal marginal income tax rates and do not reflect the impact of state and local taxes. Actual after-tax returns depend on an investor’s tax situation and may differ from those shown. After-tax returns are shown for Class I shares only and will vary for other classes. After-tax returns shown are not relevant to investors who hold their Fund shares through tax-deferred arrangements, such as 401(k) plans or individual retirement accounts (“IRAs”). The index returns presented above assume reinvestment of all distributions and exclude the effect of taxes and fees (if taxes and fees were deducted, the actual returns of the indices would be lower).
Current performance of the Fund may be lower or higher than the performance quoted above. Performance data current to the most recent month end may be obtained by calling (800) 431-1716, a toll-free number, or data current to the most recent quarter end may be accessed on the Fund’s website at www.crawfordinvestmentfunds.com.
The bar chart below shows how the Fund’s investment results have varied from year to year as represented by the performance of Class I shares. The table shows how the Fund’s average annual total returns compare over time to those of a broad-based securities market index and a supplemental index. This information provides some indication of the risks of investing in the Fund. Past performance of the Fund is not necessarily an indication of how it will perform in the future.
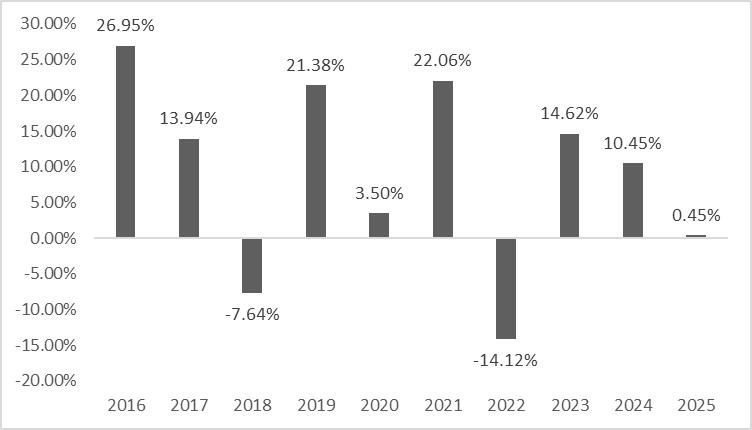
The Best/Worst quarterly results during this time period were:
| Best Quarter: | th Quarter, 2020, | 23.83% |
| Worst Quarter: | st Quarter, 2020, | (29.32)% |
| Class I | One Year | Five Years | Ten Years | |||
| Return Before Taxes | 0.45% | 5.92% | 8.39% | |||
| Return After Taxes on Distributions | (0.37)% | 4.94% | 7.27% | |||
| Return After Taxes on Distributions and Sale of Fund Shares | 0.85% | 4.56% | 6.60% | |||
| Russell 3000® Index1 (reflects no deduction for fees, expenses, or taxes) | 17.15% | 13.15% | 14.29% | |||
| Russell 2000® Index2 (reflects no deduction for fees, expenses, or taxes) | 12.81% | 6.09% | 9.62% |
| 1 - | The Russell 3000® Index measures the performance of the largest 3,000 US companies designed to represent approximately 98% of the investable US equity market. The Russell 3000® Index is constructed to provide a comprehensive, unbiased and stable barometer of the broad market and is completely reconstituted annually to ensure new and growing equities are included. Index returns assume reinvestment of all distributions and do not reflect the deduction of taxes and fees. Individuals cannot invest directly in an index; however, an individual may invest in exchange-traded funds or other investment vehicles that attempt to track the performance of a benchmark index. |
| 2 - | The Russell 2000® Index is a small-cap U.S. stock market index that makes up the smallest 2,000 stocks in the Russell 3000® Index. It is a widely recognized unmanaged index of equity prices and is representative of a broader market and range of securities than are found in the Fund’s portfolio. Index returns assume reinvestment of all distributions and do not reflect the deduction of taxes and fees. Individuals cannot invest directly in an index; however, an individual may invest in exchange-traded funds or other investment vehicles that attempt to track the performance of a benchmark index. |
After-tax returns are calculated using the historical highest individual federal marginal income tax rates and do not reflect the impact of state and local taxes. Actual after-tax returns depend on an investor’s tax situation and may differ from those shown. After-tax returns shown are not relevant to investors who hold their Fund shares through tax-deferred arrangements, such as 401(k) plans or individual retirement accounts (“IRAs”). The index returns presented above assume reinvestment of all distributions and exclude the effect of taxes and fees (if taxes and fees were deducted, the actual returns of the indices would be lower).
Current performance of the Fund may be lower or higher than the performance quoted above. Performance data current to the most recent month end may be obtained by calling (800) 431-1716, a toll-free number, or data current to the most recent quarter end may be accessed on the Fund’s website at www.crawfordinvestmentfunds.com.
The bar chart below shows how the Fund’s investment results have varied from year to year. The table below shows how the Fund’s average annual total returns compare over time to those of a broad-based securities market index and a supplemental index. This information provides some indication of the risks of investing in the Fund. Past performance of the Fund is not necessarily an indication of how it will perform in the future.
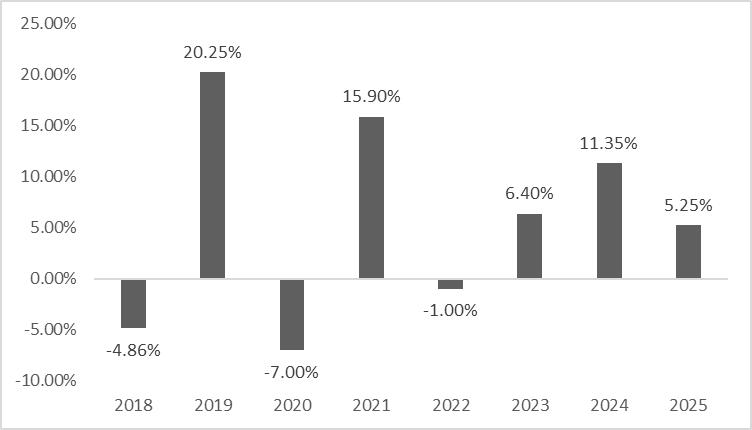
The Best/Worst quarterly results during this time period were:
| Best Quarter: | nd Quarter, 2020, | 13.76% |
| Worst Quarter: | st Quarter, 2020, | (28.10)% |
| Crawford Multi-Asset Income Fund | One Year | Five Years | Since Inception (09/12/2017) | |||
| Return Before Taxes | 5.25% | 7.43% | 5.21% | |||
| Return After Taxes on Distributions | 3.16% | 6.03% | 3.84% | |||
| Return After Taxes on Distributions and Sale of Fund Shares | 4.12% | 5.56% | 3.74% | |||
| Russell 3000® Index1 | 17.15% | 13.15% | 14.15% | |||
| NASDAQ U.S. Multi-Asset Diversified Income Index2 | 4.53% | 7.82% | 4.46% |
| 1 - | The Russell 3000® Index measures the performance of the largest 3,000 US companies designed to represent approximately 98% of the investable US equity market. The Russell 3000® Index is constructed to provide a comprehensive, unbiased and stable barometer of the broad market and is completely reconstituted annually to ensure new and growing equities are included. Index returns assume reinvestment of all distributions and do not reflect the deduction of taxes and fees. Individuals cannot invest directly in an index; however, an individual may invest in exchange-traded funds or other investment vehicles that attempt to track the performance of a benchmark index. |
| 2 - | The NASDAQ U.S. Multi-Asset Diversified Income IndexSM is designed to provide exposure to multiple asset segments, each selected to result in a consistent and high yield. The index is comprised of securities classified as U.S. equities, U.S. REITs, U.S. preferred securities, U.S. Master Limited Partnerships, and a high-yield corporate debt Exchange Traded Fund and is representative of a broader market and range of securities than are found in the Fund’s portfolio. Index returns assume reinvestment of all distributions and do not reflect the deduction of taxes and fees. Individuals cannot invest directly in an index; however, an individual may invest in exchange-traded funds or other investment vehicles that attempt to track the performance of a benchmark index. |
After-tax returns are calculated using the historical highest individual federal marginal income tax rates and do not reflect the impact of state and local taxes. Actual after-tax returns depend on an investor’s tax situation and may differ from those shown. After-tax returns shown are not relevant to investors who hold their Fund shares through tax-deferred arrangements, such as 401(k) plans or individual retirement accounts (“IRAs”). The index returns presented above assume reinvestment of all distributions and exclude the effect of taxes and fees (if taxes and fees were deducted, the actual returns of the indices would be lower).
Current performance of the Fund may be lower or higher than the performance quoted above. Performance data current to the most recent month end may be obtained by calling (800) 431-1716, a toll-free number, or data current to the most recent quarter end may be accessed on the Fund’s website at www.crawfordinvestmentfunds.com.