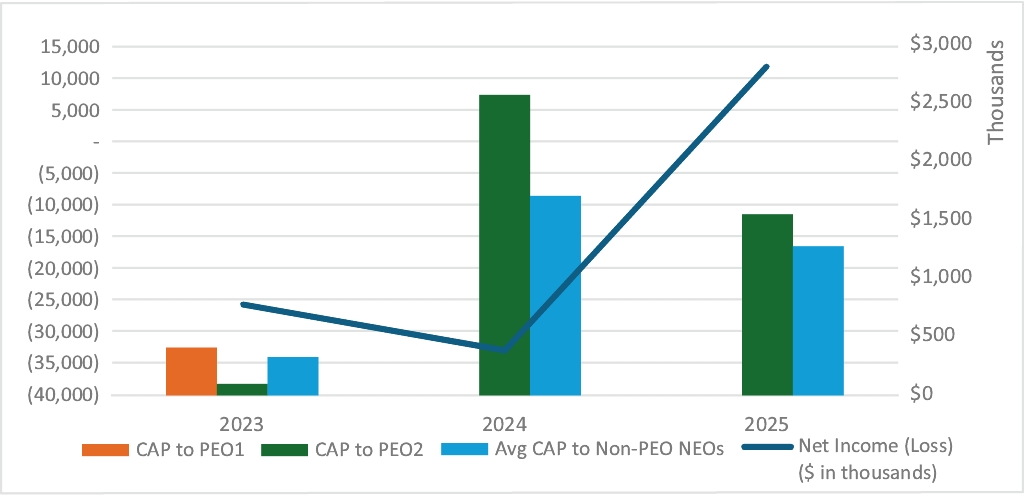
Pay vs Performance Disclosure - USD ($)
May 23, 2023
Dec. 31, 2023
Dec. 31, 2025
Dec. 31, 2024
Dec. 31, 2023
PAY VERSUS PERFORMANCE
Pay Versus Performance Table
The following table sets forth additional compensation information of our principal executive officers (“PEOs”) and our other NEOs (averaged) along with total shareholder return and net income (loss) performance results for our fiscal years ending 2025, 2024, and 2023:
Year | Summary Compensation Table Total for PEOs(1)(2) | Compensation Actually Paid to PEOs(1)(2) | Average Summary Compensation Table Total for Other NEOs(1)(2) ($) | Average Compensation Actually Paid to Other NEOs(1)(2) ($) | Value of Initial Fixed $100 Investment Based On Total Shareholder Return(3) ($) | Net Income (Loss) ($ in thousands) ($) | ||||||||||||||||||
Kevin A. Richardson, II (PEO 1) ($) | Morgan C. Frank (PEO 2) ($) | Kevin A. Richardson, II (PEO 1) ($) | Morgan C. Frank (PEO 2) ($) | |||||||||||||||||||||
2025 | — | 414,087 | — | 1,551,991 | 1,330,084 | 1,278,135 | 349.01 | 11,813 | ||||||||||||||||
2024 | — | 1,387,546 | — | 2,575,122 | 1,036,446 | 1,709,408 | 269.01 | (33,083) | ||||||||||||||||
2023 | 410,000 | 100,001 | 410,000 | 100,001 | 329,229 | 329,229 | 57.08 | (25,807) | ||||||||||||||||
(1) | Our PEOs and Other NEOs for each reported fiscal year were: |
Year | PEOs | Other NEOs | ||||
2025 | Morgan C. Frank | Daniel Coyle David Timothy Wern | ||||
2024 | Morgan C. Frank | Andrew Walko Nanci Gilmore | ||||
2023 | Kevin A. Richardson, II Morgan C. Frank | Toni Rinow Tim Hendricks | ||||
(2) | SEC rules require certain adjustments be made to the Summary Compensation Table (“SCT”) totals to determine “compensation actually paid” (“CAP”) as reported in the Pay Versus Performance Table. CAP does not necessarily represent cash and/or equity value transferred to the applicable NEO without restriction, but rather is a value calculated under applicable SEC rules. A reconciliation of the SCT totals to CAP to our PEOs and our Other NEOs (as an average) is shown below: |
2025 | |||||||||
Equity Adjustments | PEO 1 ($) | PEO 2 ($) | Average of Other NEOs ($) | ||||||
Total Compensation from SCT | — | 414,087 | 1,330,084 | ||||||
Adjustments for stock and option awards | |||||||||
Subtract SCT amounts of stock and option awards | — | (410,383) | (1,049,197) | ||||||
Add fair value at year-end of awards granted during the covered fiscal year that are outstanding and unvested at year-end | — | 392,673 | 829,889 | ||||||
+/- The difference between fair value of awards from the end of the prior fiscal year to the end of the covered year for awards granted in any prior fiscal year that are outstanding and unvested at year end | — | (240,060) | (14,997) | ||||||
+/- Add fair value as of the vesting date for awards granted and vesting during such fiscal year | — | 1,395,674 | 221,616 | ||||||
+/- The difference in fair value at the end of the prior fiscal year to the vesting date for awards granted in any prior fiscal year for which all applicable vesting conditions were satisfied during such year | — | — | — | ||||||
Subtract fair value at the end of the prior fiscal year for awards granted in any prior fiscal year that fail to meet the applicable vesting conditions during such year | — | — | (39,260) | ||||||
Compensation Actually Paid (as calculated) | — | 1,551,991 | 1,278,135 | ||||||
(3) | Total shareholder return is calculated based on a fixed investment of one hundred dollars measured from the market close on December 30, 2022 (the last trading day of fiscal 2022) through and including the end of each fiscal year reported in the table. |
Year | PEOs | Other NEOs | ||||
2025 | Morgan C. Frank | Daniel Coyle David Timothy Wern | ||||
2024 | Morgan C. Frank | Andrew Walko Nanci Gilmore | ||||
2023 | Kevin A. Richardson, II Morgan C. Frank | Toni Rinow Tim Hendricks | ||||
2025 | |||||||||
Equity Adjustments | PEO 1 ($) | PEO 2 ($) | Average of Other NEOs ($) | ||||||
Total Compensation from SCT | — | 414,087 | 1,330,084 | ||||||
Adjustments for stock and option awards | |||||||||
Subtract SCT amounts of stock and option awards | — | (410,383) | (1,049,197) | ||||||
Add fair value at year-end of awards granted during the covered fiscal year that are outstanding and unvested at year-end | — | 392,673 | 829,889 | ||||||
+/- The difference between fair value of awards from the end of the prior fiscal year to the end of the covered year for awards granted in any prior fiscal year that are outstanding and unvested at year end | — | (240,060) | (14,997) | ||||||
+/- Add fair value as of the vesting date for awards granted and vesting during such fiscal year | — | 1,395,674 | 221,616 | ||||||
+/- The difference in fair value at the end of the prior fiscal year to the vesting date for awards granted in any prior fiscal year for which all applicable vesting conditions were satisfied during such year | — | — | — | ||||||
Subtract fair value at the end of the prior fiscal year for awards granted in any prior fiscal year that fail to meet the applicable vesting conditions during such year | — | — | (39,260) | ||||||
Compensation Actually Paid (as calculated) | — | 1,551,991 | 1,278,135 | ||||||
CAP versus Company TSR
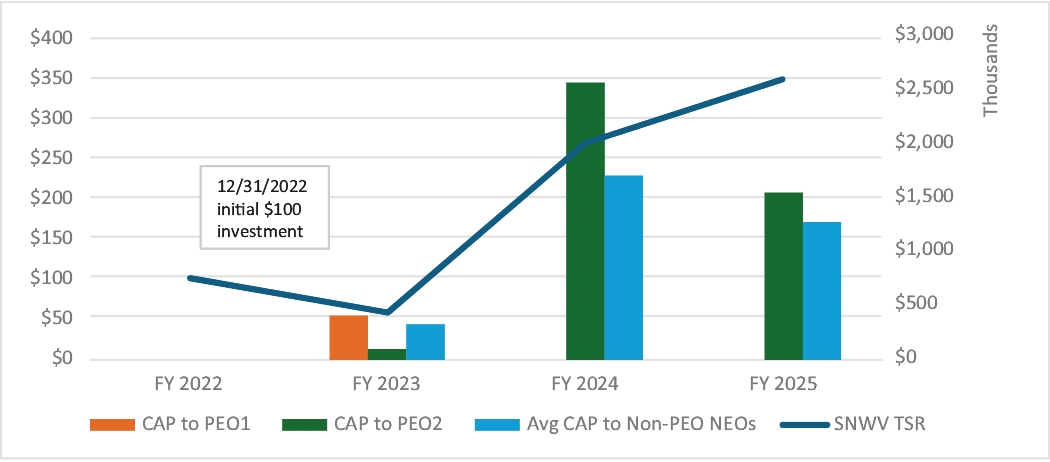
Total shareholder return in the above chart reflects the cumulative return of $100 as if invested on December 31, 2022, including reinvestment of any dividends.
CAP versus Net Income (Loss)