Apr. 29, 2026
The Fund’s investment objective is long-term growth of capital.
This table describes the fees and expenses that are incurred, directly or indirectly, when a variable product owner buys, holds, or redeems interest in an insurance company separate account that invests in the Series I shares or Series II shares of the Fund but does not represent the effect of any fees or other expenses assessed in connection with your variable product, and if it did, expenses would be higher.
| Shareholder Fees (fees paid directly from your investment) | ||
| | Series I shares | Series II shares |
| Maximum Sales Charge (Load) Imposed on Purchases (as a percentage of offering price) | None | None |
| | ||
| Maximum Deferred Sales Charge (Load) (as a percentage of original purchase price or redemption proceeds, whichever is less) | None | None |
| | ||
| Annual Fund Operating Expenses (expenses that you pay each year as a percentage of the value of your investment) | ||
| | Series I shares | Series II shares |
| Management Fees | 0.62 % | 0.62 % |
| | ||
| Distribution and/or Service (12b-1) Fees | None | 0.25 |
| | ||
| Other Expenses | 0.18 | 0.18 |
| | ||
| Total Annual Fund Operating Expenses | 0.80 | 1.05 |
| | ||
This Example is intended to help you compare the cost of investing in the Fund with the cost of investing in other mutual funds.
This Example does not represent the effect of any fees or expenses assessed in connection with your variable product, and if it did, expenses would be higher.
The Example assumes that you invest $10,000 in the Fund for the time periods indicated and then redeem all of your shares at the end of those periods. The Example also assumes that your investment has a 5% return each year and that the Fund’s operating expenses remain the same.
Although your actual costs may be higher or lower, based on these assumptions, your costs would be:
|
|
1 Year
|
3 Years
|
5 Years
|
10 Years
|
|
Series I shares
|
$82 |
$255 |
$444 |
$990 |
|
|
||||
|
Series II shares
|
$107 |
$334 |
$579 |
$1,283 |
|
|
||||
|
|
1 Year
|
3 Years
|
5 Years
|
10 Years
|
|
Series I shares
|
$82 |
$255 |
$444 |
$990 |
|
|
||||
|
Series II shares
|
$107 |
$334 |
$579 |
$1,283 |
|
|
||||
The Fund pays transaction costs, such as commissions, when it buys and sells securities (or “turns over” its portfolio). A higher portfolio turnover rate may indicate higher transaction costs. These costs, which are not reflected in annual fund operating expenses or in the Example, affect the Fund’s performance. During the most recent fiscal year, the Fund’s portfolio turnover rate was 31% of the average value of its portfolio.
The portfolio management team seeks to construct a portfolio of securities of issuers that have high or improving return on invested capital (ROIC), quality management, a strong competitive position and that are trading at attractive valuations. The Fund invests, under normal circumstances, at least 80% of its net assets (plus any borrowings for investment purposes) in equity securities and in derivatives and other instruments that have economic characteristics similar to such securities. The principal type of equity securities in which the Fund invests is common stock. The Fund may
invest in the securities of issuers of all capitalization sizes; however, a substantial number of the issuers in which the Fund invests are large-capitalization issuers.
The Fund may invest up to 25% of its net assets in foreign securities. The Fund may also invest up to 20% of its net assets in debt securities, including foreign government debt securities.
The Fund can invest in derivative instruments, including futures contracts and forward foreign currency contracts.
The Fund can use futures contracts, including index futures, to seek to gain exposure to the broad market by equitizing cash and as a hedge against downside risk.
The Fund can use forward foreign currency contracts to seek to hedge against adverse movements in the foreign currencies in which portfolio securities are denominated.
The portfolio managers use fundamental research to select securities for the Fund’s portfolio, which is comprised of both growth and value stocks. While the process may change over time or vary in particular cases, in general the selection process currently uses a fundamental approach in analyzing issuers on factors such as a company’s financial performance, company strength and prospects, industry position, and business model and management strength. Industry outlook, market trends and general economic conditions may also be considered. The Fund aims to maintain a broadly diversified portfolio across major economic sectors by applying investment parameters for both sector and position size. The portfolio managers use the following sell criteria: the stock price is approaching its target, deterioration in the company’s competitive position, poor execution by the company’s management, or identification of more attractive alternative investment ideas.
The bar chart and performance table provide an indication of the risks of investing in the Fund. The bar chart shows changes in the performance of the Series I shares of the Fund from year to year as of December 31. The performance table compares the Fund's performance to that of a style-specific benchmark and a broad-based securities market benchmark (in that order). The bar chart and performance table below do not reflect charges assessed in connection with your variable product; if they did, the performance shown would be lower. The Fund's past performance is not necessarily an indication of its future performance.
Fund performance reflects any applicable fee waivers and expense reimbursements. Performance returns would be lower without applicable fee waivers and expense reimbursements.
All Fund performance shown assumes the reinvestment of dividends and capital gains and the effect of the Fund's expenses.
The Series I shares and Series II shares invest in the same portfolio of securities and will have substantially similar performance, except to the extent that the expenses borne by each share class differ. Series II shares have higher expenses (and therefore lower performance) resulting from its Rule 12b-1 plan, which provides for a maximum fee equal to an annual rate of 0.25% (expressed as a percentage of average daily net assets of the Fund).
Updated performance information is available on the Fund’s website at www.invesco.com/us.
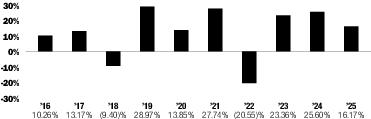
| Series I | Period Ended | Returns |
| Best Quarter | June 30, 2020 | 18.52% |
| Worst Quarter | March 31, 2020 | -20.43% |
| | Inception Date | 1 Year | 5 Years | 10 Years |
| Series I | 5/2/1994 | 16.17 % | 12.81 % | 11.73 % |
| | ||||
| Series II | 10/24/2001 | 15.88 | 12.52 | 11.46 |
| | ||||
| Russell 1000® Index (reflects no deduction for fees, expenses or taxes) | | 17.37 | 13.59 | 14.59 |
| | ||||
| S&P 500® Index (reflects no deduction for fees, expenses or taxes) | | 17.88 | 14.42 | 14.82 |
| | ||||