Apr. 29, 2026
The Fund’s investment objective is to achieve a high level of total return on its assets through a combination of capital appreciation and current income.
This table describes the fees and expenses that are incurred, directly or indirectly, when a variable product owner buys, holds, or redeems interest in an insurance company separate account that invests in the Series I shares or Series II shares of the Fund but does not represent the effect of any fees or other expenses assessed in connection with your variable product, and if it did, expenses would be higher.
| Shareholder Fees (fees paid directly from your investment) | ||
| | Series I shares | Series II shares |
| Maximum Sales Charge (Load) Imposed on Purchases (as a percentage of offering price) | None | None |
| | ||
| Maximum Deferred Sales Charge (Load) (as a percentage of original purchase price or redemption proceeds, whichever is less) | None | None |
| | ||
| Annual Fund Operating Expenses (expenses that you pay each year as a percentage of the value of your investment) | ||
| | Series I shares | Series II shares |
| Management Fees | 0.12 % | 0.12 % |
| | ||
| Distribution and/or Service (12b-1) Fees | None | 0.25 |
| | ||
| Other Expenses | 0.22 | 0.22 |
| | ||
| Total Annual Fund Operating Expenses | 0.34 | 0.59 |
| | ||
This Example is intended to help you compare the cost of investing in the Fund with the cost of investing in other mutual funds.
This Example does not represent the effect of any fees or expenses assessed in connection with your variable product, and if it did, expenses would be higher.
The Example assumes that you invest $10,000 in the Fund for the time periods indicated and then redeem all of your shares at the end of those periods. The Example also assumes that your investment has a 5% return each year and that the Fund’s operating expenses remain the same.
Although your actual costs may be higher or lower, based on these assumptions, your costs would be:
|
|
1 Year
|
3 Years
|
5 Years
|
10 Years
|
|
Series I shares
|
$35 |
$109 |
$191 |
$431 |
|
|
||||
|
Series II shares
|
$60 |
$189 |
$329 |
$738 |
|
|
||||
|
|
1 Year
|
3 Years
|
5 Years
|
10 Years
|
|
Series I shares
|
$35 |
$109 |
$191 |
$431 |
|
|
||||
|
Series II shares
|
$60 |
$189 |
$329 |
$738 |
|
|
||||
The Fund pays transaction costs, such as commissions, when it buys and sells securities (or “turns over” its portfolio). A higher portfolio turnover rate may indicate higher transaction costs. These costs, which are not reflected in annual fund operating expenses or in the Example, affect the Fund’s performance. During the most recent fiscal year, the Fund’s portfolio turnover rate was 24% of the average value of its portfolio.
The Fund invests, under normal circumstances, at least 80% of its net assets (plus any borrowings for investment purposes) in common stocks of companies represented in the S&P 500® Equal Weight Index (the Underlying Index), and in derivatives and other instruments that have economic characteristics similar to such securities. The Fund generally invests, under normal circumstances, all, or substantially all, of its net assets in such securities.
The Underlying Index is an equal-weighted version of the S&P 500® Index, which is comprised of common stocks of approximately 500 large-capitalization companies that generally represent the large-cap segment of the U.S. equity market. “Equal weighting” means that, unlike the S&P 500® Index, which employs a float-adjusted market capitalization weighted methodology, the Underlying Index assigns each component security the same weight at each quarterly rebalance.
In seeking to track the investment results (before fees and expenses) of the Underlying Index, the portfolio managers primarily utilize a “full replication” methodology, pursuant to which the Fund generally invests in all of the securities comprising the Underlying Index in proportion to their weightings in the Underlying Index.
The Underlying Index is typically rebalanced quarterly and constituent changes are incorporated in the Underlying Index as and when they are made to the S&P 500® Index. The Fund is generally rebalanced in accordance with the Underlying Index. Constituent changes are generally incorporated in the Fund as and when they are made to the Underlying Index.
The Fund can invest in derivative instruments including futures contracts.
The Fund can use futures contracts, including index futures, to seek exposure to certain equity securities represented in the Underlying Index while managing cash balances.
The bar chart and performance table provide an indication of the risks of investing in the Fund. The bar chart shows changes in the performance of the Series I shares of the Fund from year to year as of December 31. The performance table compares the Fund's performance to that of a style-specific benchmark and a broad-based securities market benchmark (in that order). The bar chart and performance table below do not reflect charges assessed in connection with your variable product; if they did, the performance shown would be lower. The Fund's past performance is not necessarily an indication of its future performance.
Fund performance reflects any applicable fee waivers and expense reimbursements. Performance returns would be lower without applicable fee waivers and expense reimbursements.
All Fund performance shown assumes the reinvestment of dividends and capital gains and the effect of the Fund's expenses.
The Series I shares and Series II shares invest in the same portfolio of securities and will have substantially similar performance, except to the extent that the expenses borne by each share class differ. Series II shares have higher expenses (and therefore lower performance) resulting from its Rule 12b-1 plan, which provides for a maximum fee equal to an annual rate of 0.25% (expressed as a percentage of average daily net assets of the Fund).
Updated performance information is available on the Fund’s website at www.invesco.com/us.
Amount includes the effect of the Invesco Advisers, Inc. pay-in for an economic loss as a result of a delay in rebalancing to the Underlying Index that occurred on April 24, 2020. Had the pay-in not been made, the total return would have been lower.
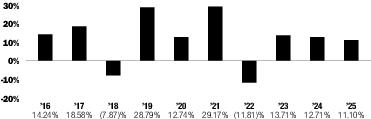
| Series I | Period Ended | Returns |
| Best Quarter | June 30, 2020 | 21.72% |
| Worst Quarter | March 31, 2020 | -26.60% |
| | Inception Date | 1 Year | 5 Years | 10 Years |
| Series I1 | 11/9/1994 | 11.10 % | 10.16 % | 11.39 % |
| | ||||
| Series II1 | 7/24/2000 | 10.82 | 9.89 | 11.11 |
| | ||||
| S&P 500® Equal Weight Index (reflects no deduction for fees, expenses or taxes) | | 11.43 | 10.48 | 11.71 |
| | ||||
| S&P 500® Index (reflects no deduction for fees, expenses or taxes) | | 17.88 | 14.42 | 14.82 |
| | ||||
1
Amount includes the effect of the Invesco Advisers, Inc. pay-in for an economic loss as a result of a delay in rebalancing to the Underlying Index that occurred on April 24, 2020. Had the pay-in not been made, the total return would have been lower.