Pay vs Performance Disclosure - USD ($)
|
12 Months Ended |
Dec. 31, 2025 |
Dec. 31, 2024 |
Dec. 31, 2023 |
Dec. 31, 2022 |
Dec. 31, 2021 |
| Pay vs Performance Disclosure |
|
|
|
|
|
| Pay vs Performance Disclosure, Table |
| | | | | | | | | | | | | | | | | | | | | | | | | | | | | | | | | | | | | | | | | Value of Initial Fixed $100 Investment Based on: | | | | Year | Summary Compensation Table Total for PEO | Compensation Actually Paid to PEO | Average Summary Compensation Table Total for Non-PEO NEOs | Average Compensation Actually Paid to Non-PEO NEOs | Total Shareholder Return | Peer Group Total Shareholder Return | Net Income
(in millions) | Consolidated Adjusted OFCF
(in millions) | | (a) | ($)(b) | ($)(c) | ($)(d)(1) | ($)(e) | LILA
($)(f)(2) | LILAK
($)(g)(2) | ($)(h)(2) | ($)(i) | ($)(j)(3) | 2025 | 16,885,852 | | 19,245,465 | | (4) | 4,882,624 | | 5,747,367 | | (5) | 66.40 | 67.27 | 122.81 | (554.3) | | 1,066.0 | | | 2024 | 18,487,068 | | 14,639,298 | | | 4,465,213 | | 3,790,153 | | | 57.14 | 57.17 | 91.95 | (659.7) | | 897.9 | | | 2023 | 16,161,952 | | 14,550,211 | | | 3,799,987 | | 3,421,769 | | | 65.68 | 66.19 | 85.53 | (86.8) | | 973.0 | | | 2022 | 15,745,617 | | 6,402,860 | | | 4,131,692 | | 2,423,503 | | | 67.65 | 68.53 | 77.88 | (207.8) | | 930.0 | | | 2021 | 37,576,803 | | 31,662,646 | | | 6,226,351 | | 5,596,550 | | | 104.76 | | 102.80 | | 97.46 | | (490.6) | | 961.0 | |
|
|
|
|
|
| Company Selected Measure Name |
•Consolidated adjusted OFCF
|
|
|
|
|
| Named Executive Officers, Footnote |
The dollar amounts reported in column (d) represent the average of the amounts reported for our named executive officers as a group (excluding Mr. Nair, who has served as our CEO since 2017) in the “Total” column of the Summary Compensation Table in each applicable year. The names of each of the NEOs (excluding Mr. Nair) included for purposes of calculating the average amounts in each applicable year are as follows: (i) for 2025, Christopher Noyes, Aamir Hussain and John Winter; (ii) for 2024, 2023 and 2022, Christopher Noyes, Aamir Hussain, Rocio Lorenzo and John Winter; and (iii) for 2021, Christopher Noyes, Betzalel Kenigsztein, Vivek Khemka, Rocio Lorenzo and John Winter.
|
|
|
|
|
| PEO Total Compensation Amount |
$ 16,885,852
|
$ 18,487,068
|
$ 16,161,952
|
$ 15,745,617
|
$ 37,576,803
|
| PEO Actually Paid Compensation Amount |
$ 19,245,465
|
14,639,298
|
14,550,211
|
6,402,860
|
31,662,646
|
| Adjustment To PEO Compensation, Footnote |
The dollar amounts reported in column (c) represent the amount of “compensation actually paid” to Mr. Nair, as computed in accordance with Item 402(v) of Regulation S-K. In accordance with the requirements of Item 402(v) of Regulation S-K, the adjustments in the table below were made to Mr. Nair’s total compensation for 2025 to determine the compensation actually paid. With respect to equity award adjustments for 2025 as disclosed in the table below, the valuation assumptions used to calculate the fair values did not materially differ from those disclosed at the time of grant. | | | | | | | 2025 ($) | | Summary Compensation Table (SCT) Total Compensation | 16,885,852 | | | Less: Stock Award Values Reported in SCT for the Covered Year | 5,888,225 | | | Less: Option Award Values Reported in SCT for the Covered Year | 5,327,633 | | | Plus: Fair Value of Equity Awards Granted in the Covered Year and Outstanding and Unvested at End of Covered Year | 10,915,555 | | | Plus: Fair Value as of Vesting Date of Equity Awards Granted and Vested in Covered Year | 0 | | | Plus/Less: Change in Fair Value of Outstanding Unvested Equity Awards from Prior Years | 2,318,246 | | | Plus/Less: Change in Fair Value of Equity Awards from Prior Years that Vested in the Covered Year | 341,671 | | | Less: Fair Value of Equity Awards Forfeited during the Covered Year | 0 | | | Plus: Value of Dividends or other Earnings Paid on Equity Awards | 0 | | | Compensation Actually Paid | 19,245,465 | |
|
|
|
|
|
| Non-PEO NEO Average Total Compensation Amount |
$ 4,882,624
|
4,465,213
|
3,799,987
|
4,131,692
|
6,226,351
|
| Non-PEO NEO Average Compensation Actually Paid Amount |
$ 5,747,367
|
3,790,153
|
3,421,769
|
2,423,503
|
5,596,550
|
| Adjustment to Non-PEO NEO Compensation Footnote |
The dollar amounts reported in column (e) represent the average amount of “compensation actually paid” to the NEOs identified in footnote 1 as a group (excluding Mr. Nair), as computed in accordance with Item 402(v) of Regulation S-K. In accordance with the requirements of Item 402(v) of Regulation S-K, the adjustments in the table below were made to average total compensation for the NEOs as a group (excluding Mr. Nair) for 2025 to determine the compensation actually paid, using the same methodology described above in footnote 1. With respect to equity award adjustments for 2025 as disclosed in the table below, the valuation assumptions used to calculate the fair value did not materially differ from those disclosed at the time of grant. | | | | | | | 2025 Average ($) | | SCT Total Compensation | 4,882,624 | | | Less: Stock Award Values Reported in SCT for the Covered Year | 1,346,580 | | | Less: Option Award Values Reported in SCT for the Covered Year | 1,546,731 | | | Plus: Fair Value of Equity Awards Granted in the Covered Year and Outstanding and Unvested at End of Covered Year | 3,169,029 | | | Plus: Fair Value as of Vesting Date of Equity Awards Granted and Vested in Covered Year | 0 | | | Plus/Less: Change in Fair Value of Outstanding Unvested Equity Awards from Prior Years | 472,135 | | | Plus/Less: Change in Fair Value of Equity Awards from Prior Years that Vested in the Covered Year | 116,890 | | | Less: Fair Value of Equity Awards Forfeited during the Covered Year | 0 | | | Plus: Value of Dividends or other Earnings Paid on Equity Awards | 0 | | | Compensation Actually Paid | 5,747,367 | |
|
|
|
|
|
| Compensation Actually Paid vs. Total Shareholder Return |
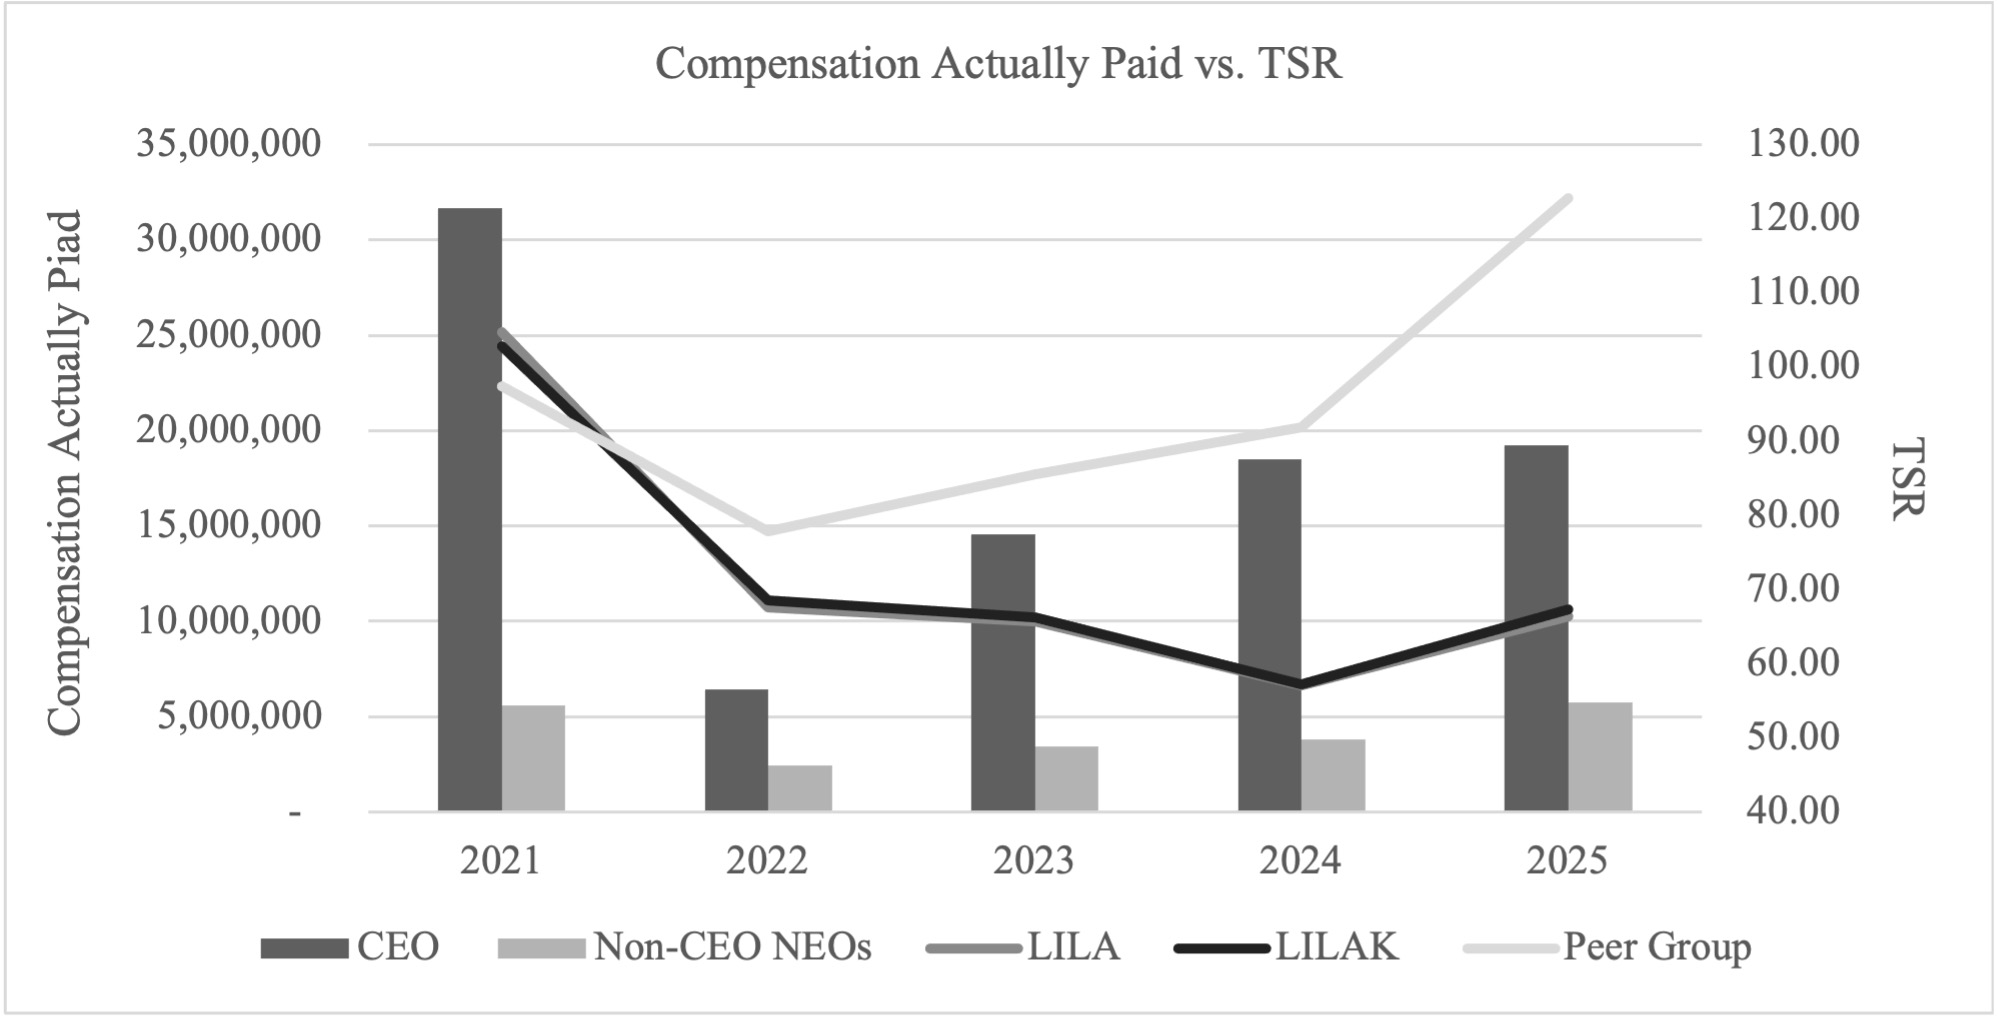
As required by Item 402(v) of Regulation S-K, we are also presenting the graph below which compares the compensation actually paid to Mr. Nair and our other NEOs to the TSRs of our LILA and LILAK shares. This graph also compares the TSRs of our LILA and LILAK shares to the TSR of the MSCI Emerging Markets NTR Index, which is our peer group index in the 2025 Form 10-K. The TSRs reflected in the chart below assume reinvestment of dividends, where applicable, and that $100 was invested at the market close on December 31, 2020.
|
|
|
|
|
| Compensation Actually Paid vs. Net Income |
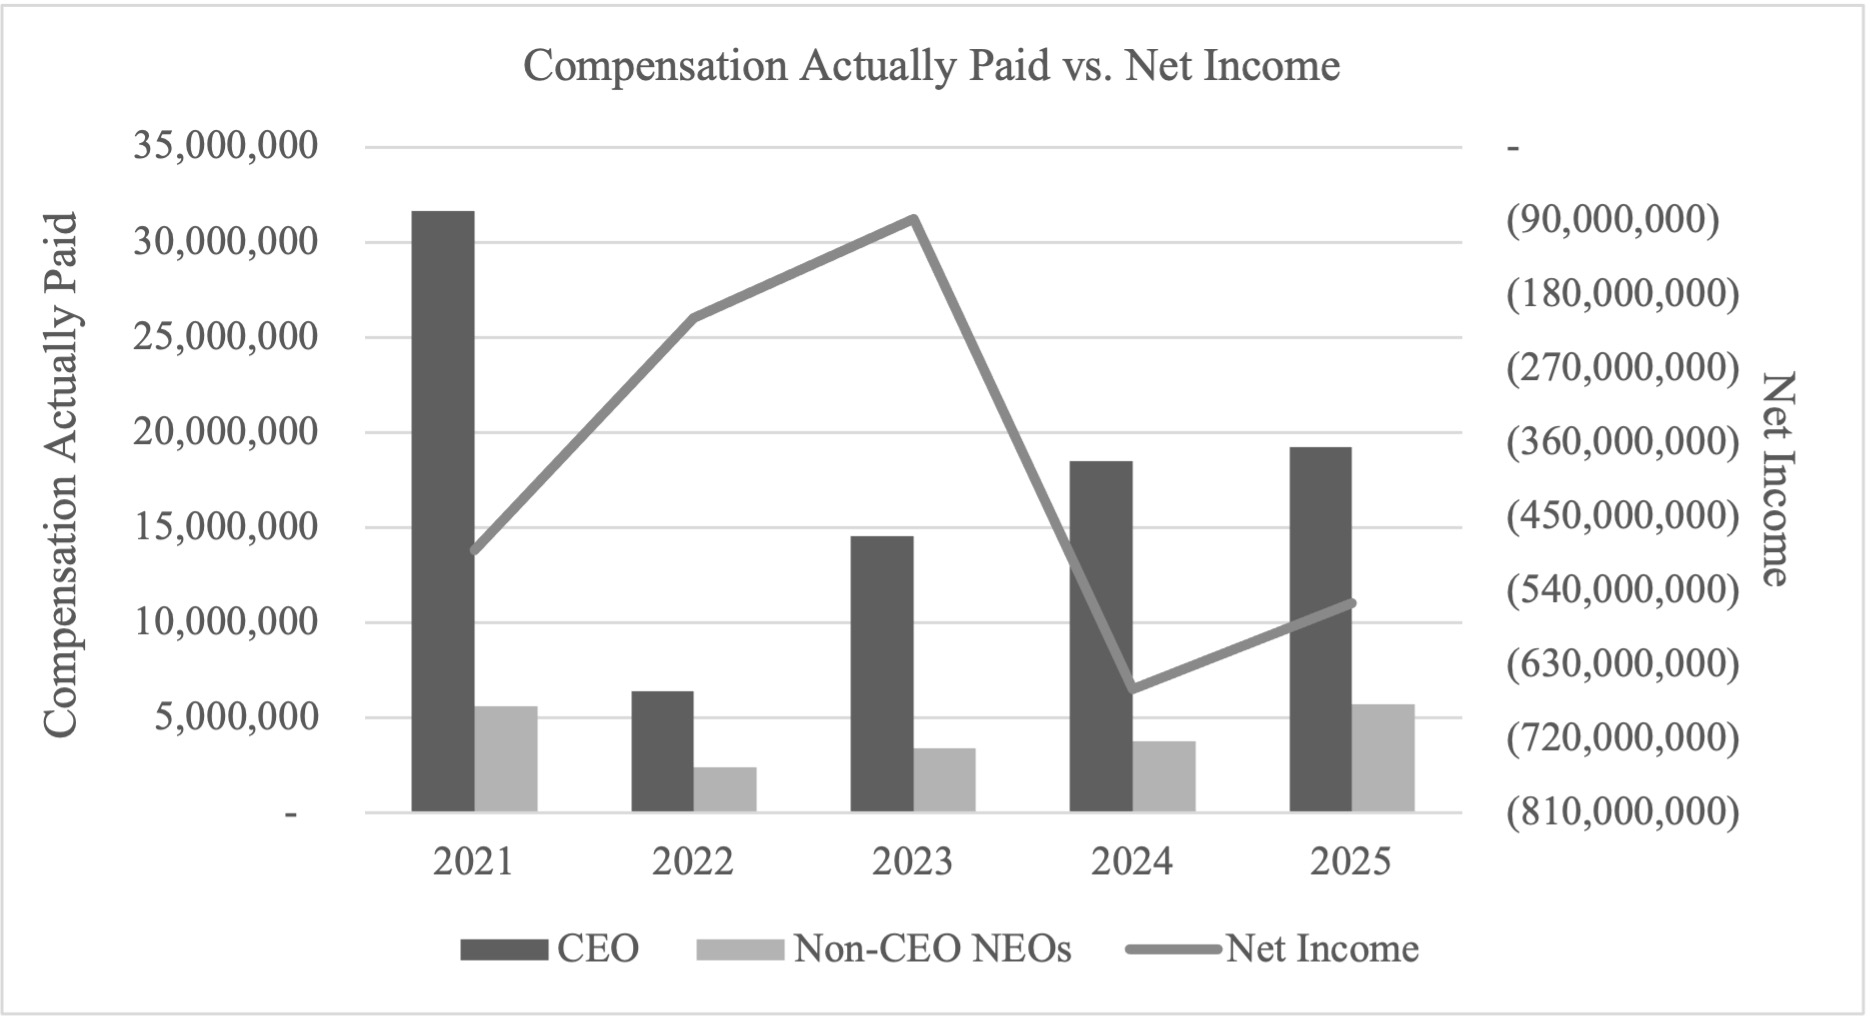
The following graph compares Mr. Nair and our NEOs’ compensation actually paid to our net income for 2021, 2022, 2023, 2024 and 2025, as required by Item 402(v) of Regulation S-K.
|
|
|
|
|
| Compensation Actually Paid vs. Company Selected Measure |
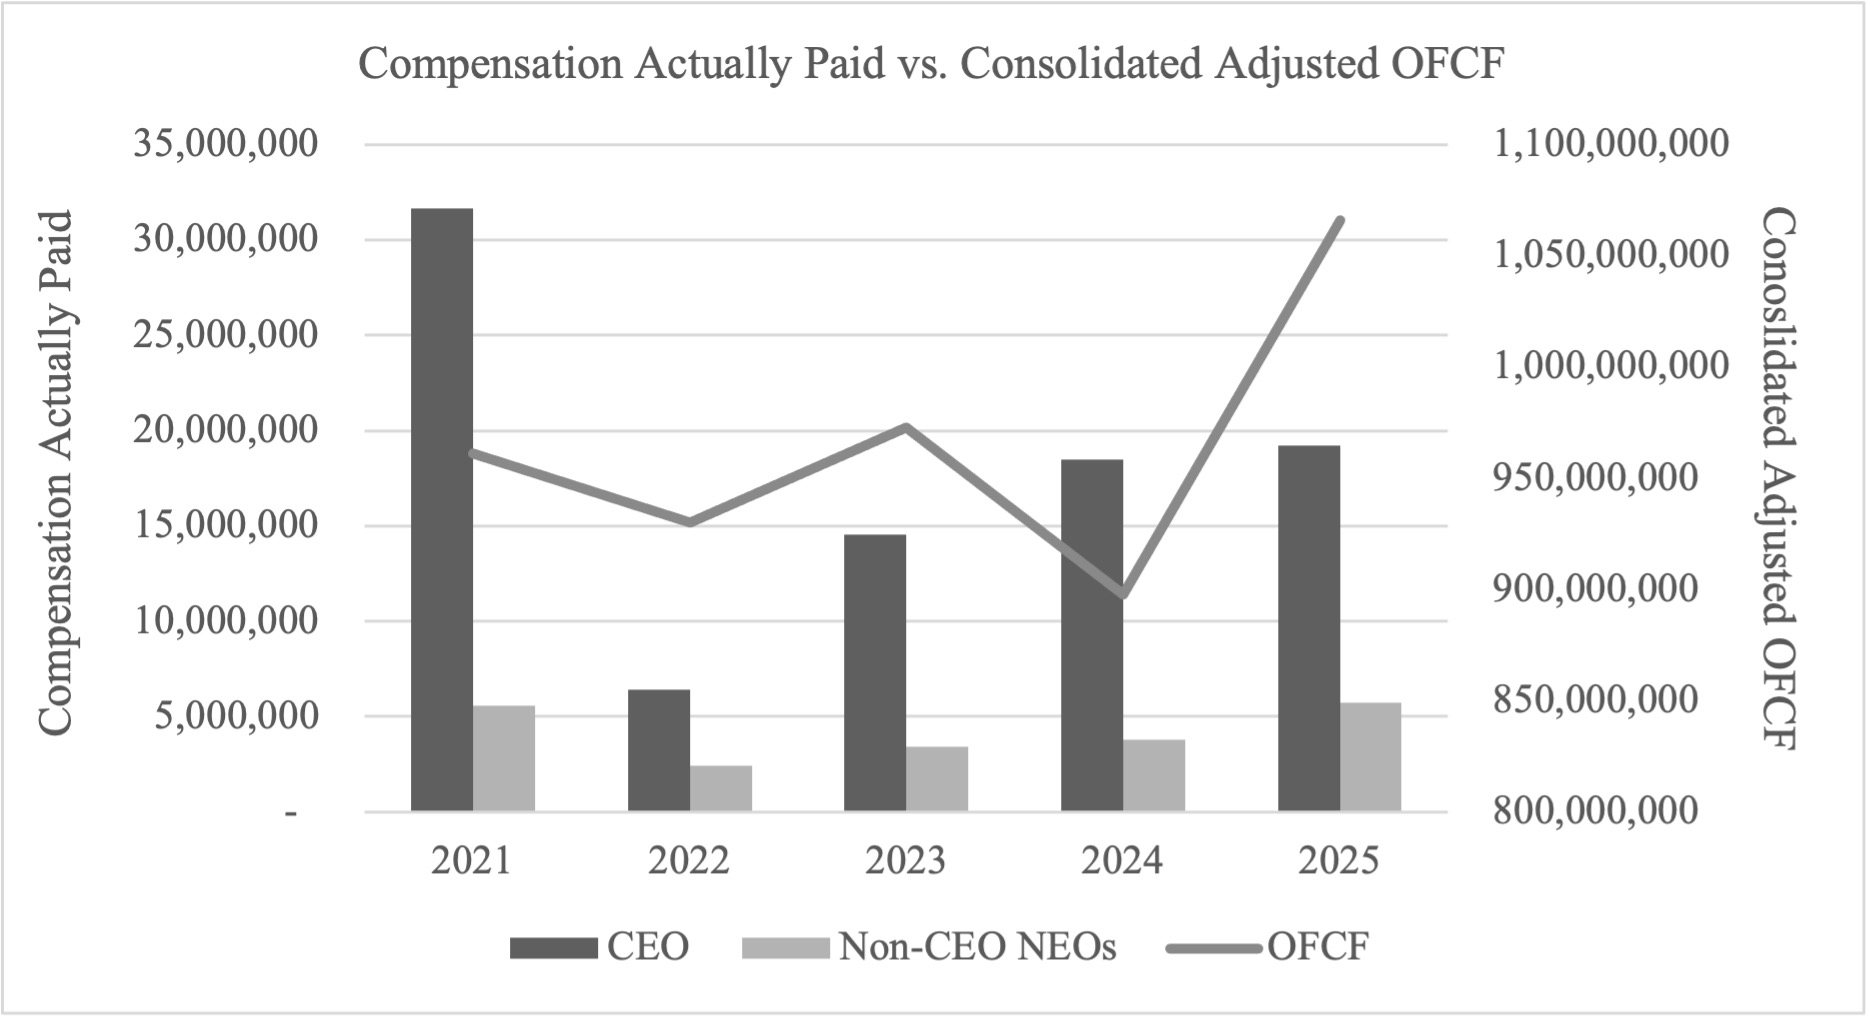
We view consolidated adjusted OFCF as the most important financial measure linking our NEOs’ compensation actually paid to our performance, with performance on that measure accounting for 50%, 45%, 60%, 60% and 60% of our annual bonus program for 2021, 2022, 2023, 2024 and 2025, respectively. Accordingly, the graph below reflects general alignment between our consolidated adjusted OFCF and compensation actually paid to Mr. Nair and our other NEOs for 2021 through 2025.
|
|
|
|
|
| Total Shareholder Return Vs Peer Group |
As required by Item 402(v) of Regulation S-K, we are also presenting the graph below which compares the compensation actually paid to Mr. Nair and our other NEOs to the TSRs of our LILA and LILAK shares. This graph also compares the TSRs of our LILA and LILAK shares to the TSR of the MSCI Emerging Markets NTR Index, which is our peer group index in the 2025 Form 10-K. The TSRs reflected in the chart below assume reinvestment of dividends, where applicable, and that $100 was invested at the market close on December 31, 2020.
|
|
|
|
|
| Tabular List, Table |
| | | | Most Important Financial Measures for 2025 | •Consolidated adjusted OFCF | •Revenue |
|
|
|
|
|
| Peer Group Total Shareholder Return Amount |
$ 122.81
|
91.95
|
85.53
|
77.88
|
97.46
|
| Net Income (Loss), Including Portion Attributable to Noncontrolling Interest |
$ (554,300,000)
|
$ (659,700,000)
|
$ (86,800,000)
|
$ (207,800,000)
|
$ (490,600,000)
|
| Company Selected Measure Amount |
1,066,000,000
|
897,900,000
|
973,000,000.0
|
930,000,000.0
|
961,000,000.0
|
| PEO Name |
Mr. Nair
|
|
|
|
|
| Additional 402(v) Disclosure |
The total shareholder return (TSR) in columns (f), (g) and (h) compares the changes in the cumulative TSR on our LILA and LILAK shares from market close on December 31, 2020 to December 31 of each of 2021, 2022, 2023, 2024 and 2025, to the change in the cumulative TSR of the MSCI Emerging Markets NTR Index, which is our peer group index in the 2025 Form 10-K (assuming reinvestment of dividends, where applicable, and that $100 was invested at the market close on December 31, 2020).
|
|
|
|
|
| Total Shareholder Return Amount, Class C Shares |
$ 66.40
|
$ 57.14
|
|
|
|
| Total Shareholder Return Amount, Class A Shares |
|
|
$ 65.68
|
$ 67.65
|
$ 104.76
|
| Measure:: 1 |
|
|
|
|
|
| Pay vs Performance Disclosure |
|
|
|
|
|
| Name |
•Consolidated adjusted OFCF
|
|
|
|
|
| Non-GAAP Measure Description |
Consolidated adjusted OFCF is OFCF as adjusted each year in accordance with our annual bonus program and for certain other unbudgeted events that the compensation committee, in its discretion and consistent with past practice, determined distorted performance against the financial performance metrics. Historically, OFCF adjustments apply foreign currency exchange rates for the covered year to our OFCF for the immediately preceding year and include the impact of acquisitions, dispositions, volcanic activity, hurricanes, earthquakes and power outages. See Compensation Discussion and Analysis—Elements of Our Compensation Packages—Annual Performance Awards—Design of 2025 Annual Bonus Program and 2025 Performance for the definition of OFCF.
|
|
|
|
|
| Measure:: 2 |
|
|
|
|
|
| Pay vs Performance Disclosure |
|
|
|
|
|
| Name |
•Revenue
|
|
|
|
|
| LILAK [Member] |
|
|
|
|
|
| Pay vs Performance Disclosure |
|
|
|
|
|
| Total Shareholder Return Amount, Class C Shares |
$ 67.27
|
$ 57.17
|
$ 66.19
|
$ 68.53
|
$ 102.80
|
| PEO | Year-end Fair Value of Equity Awards Granted in Covered Year that are Outstanding and Unvested |
|
|
|
|
|
| Pay vs Performance Disclosure |
|
|
|
|
|
| Adjustment to Compensation, Amount |
10,915,555
|
|
|
|
|
| PEO | Year-over-Year Change in Fair Value of Equity Awards Granted in Prior Years That are Outstanding and Unvested |
|
|
|
|
|
| Pay vs Performance Disclosure |
|
|
|
|
|
| Adjustment to Compensation, Amount |
2,318,246
|
|
|
|
|
| PEO | Vesting Date Fair Value of Equity Awards Granted and Vested in Covered Year |
|
|
|
|
|
| Pay vs Performance Disclosure |
|
|
|
|
|
| Adjustment to Compensation, Amount |
0
|
|
|
|
|
| PEO | Change in Fair Value as of Vesting Date of Prior Year Equity Awards Vested in Covered Year |
|
|
|
|
|
| Pay vs Performance Disclosure |
|
|
|
|
|
| Adjustment to Compensation, Amount |
341,671
|
|
|
|
|
| PEO | Prior Year End Fair Value of Equity Awards Granted in Any Prior Year that Fail to Meet Applicable Vesting Conditions During Covered Year |
|
|
|
|
|
| Pay vs Performance Disclosure |
|
|
|
|
|
| Adjustment to Compensation, Amount |
0
|
|
|
|
|
| PEO | Dividends or Other Earnings Paid on Equity Awards not Otherwise Reflected in Total Compensation for Covered Year |
|
|
|
|
|
| Pay vs Performance Disclosure |
|
|
|
|
|
| Adjustment to Compensation, Amount |
0
|
|
|
|
|
| PEO | Stock Award Values Reported in SCT for the Covered Year [Member] |
|
|
|
|
|
| Pay vs Performance Disclosure |
|
|
|
|
|
| Adjustment to Compensation, Amount |
(5,888,225)
|
|
|
|
|
| PEO | Option Award Values Reported in SCT for the Covered Year [Member] |
|
|
|
|
|
| Pay vs Performance Disclosure |
|
|
|
|
|
| Adjustment to Compensation, Amount |
(5,327,633)
|
|
|
|
|
| Non-PEO NEO | Stock Award Values Reported in SCT for the Covered Year [Member] |
|
|
|
|
|
| Pay vs Performance Disclosure |
|
|
|
|
|
| Adjustment to Compensation, Amount |
(1,346,580)
|
|
|
|
|
| Non-PEO NEO | Option Award Values Reported in SCT for the Covered Year [Member] |
|
|
|
|
|
| Pay vs Performance Disclosure |
|
|
|
|
|
| Adjustment to Compensation, Amount |
(1,546,731)
|
|
|
|
|
| Non-PEO NEO | Fair Value of Equity Awards Granted in the Covered Year and Outstanding and Unvested at End of Covered Year [Member] |
|
|
|
|
|
| Pay vs Performance Disclosure |
|
|
|
|
|
| Adjustment to Compensation, Amount |
3,169,029
|
|
|
|
|
| Non-PEO NEO | Fair Value as of Vesting Date of Equity Awards Granted and Vested in Covered Year [Member] |
|
|
|
|
|
| Pay vs Performance Disclosure |
|
|
|
|
|
| Adjustment to Compensation, Amount |
0
|
|
|
|
|
| Non-PEO NEO | Change in Fair Value of Outstanding Unvested Equity Awards from Prior Years [Member] |
|
|
|
|
|
| Pay vs Performance Disclosure |
|
|
|
|
|
| Adjustment to Compensation, Amount |
472,135
|
|
|
|
|
| Non-PEO NEO | Change in Fair Value of Equity Awards from Prior Years that Vested in the Covered Year [Member] |
|
|
|
|
|
| Pay vs Performance Disclosure |
|
|
|
|
|
| Adjustment to Compensation, Amount |
116,890
|
|
|
|
|
| Non-PEO NEO | Fair Value of Equity Awards Forfeited during the Covered Year [Member] |
|
|
|
|
|
| Pay vs Performance Disclosure |
|
|
|
|
|
| Adjustment to Compensation, Amount |
0
|
|
|
|
|
| Non-PEO NEO | Value of Dividends or other Earnings Paid on Equity Awards [Member] |
|
|
|
|
|
| Pay vs Performance Disclosure |
|
|
|
|
|
| Adjustment to Compensation, Amount |
$ 0
|
|
|
|
|