Performance Management |
Dec. 31, 2025 |
|||||||||||||||||||||||||||||||||||||||||||||||||||||||||||||||||||||||||||||||||||||||||||||||||||||
|---|---|---|---|---|---|---|---|---|---|---|---|---|---|---|---|---|---|---|---|---|---|---|---|---|---|---|---|---|---|---|---|---|---|---|---|---|---|---|---|---|---|---|---|---|---|---|---|---|---|---|---|---|---|---|---|---|---|---|---|---|---|---|---|---|---|---|---|---|---|---|---|---|---|---|---|---|---|---|---|---|---|---|---|---|---|---|---|---|---|---|---|---|---|---|---|---|---|---|---|---|---|---|
| American Beacon Man Funds - Classes A, C, Y, R6, R5 and Investor | American Beacon Man Large Cap Growth Fund | ||||||||||||||||||||||||||||||||||||||||||||||||||||||||||||||||||||||||||||||||||||||||||||||||||||||
| Prospectus [Line Items] | ||||||||||||||||||||||||||||||||||||||||||||||||||||||||||||||||||||||||||||||||||||||||||||||||||||||
| Bar Chart and Performance Table [Heading] | Fund Performance | |||||||||||||||||||||||||||||||||||||||||||||||||||||||||||||||||||||||||||||||||||||||||||||||||||||
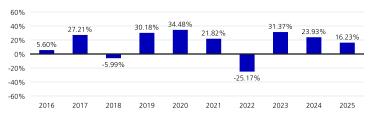
| Performance Narrative [Text Block] | The bar chart and table below provide an indication of risk by showing changes in the Fund’s performance over time. The bar chart shows how the Fund’s performance has varied from year to year. The table shows how the Fund’s average annual total returns compare to a broad-based securities market index, as well as an additional index with characteristics that are similar to those of the Fund, for the periods indicated. Effective May 1, 2024, a new sub-advisor began managing the Fund. Performance through April 30, 2024 reflects the Fund’s performance under the management of its prior sub-advisor. On February 5, 2016, the Fund acquired all the assets and assumed all the liabilities of the Fund’s predecessor. In connection with that reorganization, the R5 Class shares of the Fund adopted the performance history and financial statements of the Fund’s predecessor. In the bar chart and table below, for the period prior to February 5, 2016, the performance of the Fund’s R5 Class shares is the performance of the Fund’s predecessor. In the table below, for the period prior to February 5, 2016, the performance of the Fund’s A Class, C Class, Y Class, and Investor Class shares also reflects the returns of the Fund’s predecessor. Additionally, for the period prior to April 30, 2018, the performance of the R6 Class shares reflects the returns of the Fund’s predecessor from January 1, 2016 through February 4, 2016 and the performance of the Fund’s R5 Class from February 5, 2016 through April 29, 2018. In each case, the newer share classes would have had similar annual returns to the Fund’s predecessor or R5 Class shares, as applicable, because the shares of each class represent investments in the same portfolio securities. However, the expenses of the Fund’s predecessor or R5 Class shares, as applicable, differ from those of the newer share classes, which would affect performance. To the extent that the Fund’s predecessor or R5 Class shares, as applicable, may have had lower expenses than the newer share classes prior to February 5, 2016, or April 30, 2018, as applicable, the performance of the Fund’s predecessor or R5 Class shares, as applicable, would likely have been higher than the performance the newer share classes would have realized during the same period. The performance of the newer share classes shown in the table has not been adjusted for differences in operating expenses between those share classes and the shares of the Fund’s predecessor or R5 Class, as applicable, but the A Class and C Class shares performance has been adjusted for the impact of the maximum applicable sales charge. C Class shares automatically convert to A Class shares 8 years after purchase, if the conversion is available through your financial intermediary. In the table below, the performance for C Class shares reflects the performance as though C Class shares were held for the full 10-year period. You may obtain updated performance information on the Fund’s website at www.americanbeaconfunds.com. Past performance (before and after taxes) is not necessarily an indication of how the Fund will perform in the future.
|
|||||||||||||||||||||||||||||||||||||||||||||||||||||||||||||||||||||||||||||||||||||||||||||||||||||
| Performance Past Does Not Indicate Future [Text] | Past performance (before and after taxes) is not necessarily an indication of how the Fund will perform in the future. | |||||||||||||||||||||||||||||||||||||||||||||||||||||||||||||||||||||||||||||||||||||||||||||||||||||
| Performance Information Illustrates Variability of Returns [Text] | The bar chart and table below provide an indication of risk by showing changes in the Fund’s performance over time. The bar chart shows how the Fund’s performance has varied from year to year. The table shows how the Fund’s average annual total returns compare to a broad-based securities market index, as well as an additional index with characteristics that are similar to those of the Fund, for the periods indicated. Effective May 1, 2024, a new sub-advisor began managing the Fund. Performance through April 30, 2024 reflects the Fund’s performance under the management of its prior sub-advisor. | |||||||||||||||||||||||||||||||||||||||||||||||||||||||||||||||||||||||||||||||||||||||||||||||||||||
| Bar Chart [Heading] | Calendar year total returns for R5 Class Shares. Year Ended 12/31 | |||||||||||||||||||||||||||||||||||||||||||||||||||||||||||||||||||||||||||||||||||||||||||||||||||||
| Bar Chart [Table] | ![]() |
|||||||||||||||||||||||||||||||||||||||||||||||||||||||||||||||||||||||||||||||||||||||||||||||||||||
| Bar Chart Closing [Text Block] | Highest
Quarterly Return: 30.01% 2nd Quarter 2020 01/01/2016 through 12/31/2025 Lowest
Quarterly Return:
-20.94% 2nd Quarter 2022 01/01/2016 through 12/31/2025 |
|||||||||||||||||||||||||||||||||||||||||||||||||||||||||||||||||||||||||||||||||||||||||||||||||||||
| Performance Table Heading | Average annual total returns for periods ended December 31, 2025 | |||||||||||||||||||||||||||||||||||||||||||||||||||||||||||||||||||||||||||||||||||||||||||||||||||||
| Performance Table Uses Highest Federal Rate | After-tax returns are calculated using the historical highest individual federal marginal income tax rates and do not reflect the impact of state and local income taxes. | |||||||||||||||||||||||||||||||||||||||||||||||||||||||||||||||||||||||||||||||||||||||||||||||||||||
| Performance Table Not Relevant to Tax Deferred | If you are a tax-exempt entity or hold your Fund shares through a tax-deferred arrangement, such as an individual retirement account (“IRA”) or a 401(k) plan, the after-tax returns do not apply to your situation. | |||||||||||||||||||||||||||||||||||||||||||||||||||||||||||||||||||||||||||||||||||||||||||||||||||||
| Performance Table Explanation after Tax Higher | The return after taxes on distributions and sale of Fund shares may exceed the return before taxes due to an assumed tax benefit from any losses on a sale of Fund shares at the end of the measurement period. | |||||||||||||||||||||||||||||||||||||||||||||||||||||||||||||||||||||||||||||||||||||||||||||||||||||
| Performance [Table] |
|
|||||||||||||||||||||||||||||||||||||||||||||||||||||||||||||||||||||||||||||||||||||||||||||||||||||
| Performance Table One Class of after Tax Shown [Text] | After-tax returns are shown only for the R5 Class shares of the Fund; after-tax returns for other share classes will vary. | |||||||||||||||||||||||||||||||||||||||||||||||||||||||||||||||||||||||||||||||||||||||||||||||||||||
| Performance Table Closing [Text Block] | After-tax returns are calculated using the historical highest individual federal marginal income tax rates and do not reflect the impact of state and local income taxes. Actual after-tax returns depend on an investor’s tax situation and may differ from those shown. The return after taxes on distributions and sale of Fund shares may exceed the return before taxes due to an assumed tax benefit from any losses on a sale of Fund shares at the end of the measurement period. If you are a tax-exempt entity or hold your Fund shares through a tax-deferred arrangement, such as an individual retirement account (“IRA”) or a 401(k) plan, the after-tax returns do not apply to your situation. After-tax returns are shown only for the R5 Class shares of the Fund; after-tax returns for other share classes will vary.
|
|||||||||||||||||||||||||||||||||||||||||||||||||||||||||||||||||||||||||||||||||||||||||||||||||||||
| Performance Availability Website Address [Text] | www.americanbeaconfunds.com | |||||||||||||||||||||||||||||||||||||||||||||||||||||||||||||||||||||||||||||||||||||||||||||||||||||
| American Beacon Man Funds - Classes A, C, Y, R6, R5 and Investor | American Beacon Man Large Cap Growth Fund | R5 Class | ||||||||||||||||||||||||||||||||||||||||||||||||||||||||||||||||||||||||||||||||||||||||||||||||||||||
| Prospectus [Line Items] | ||||||||||||||||||||||||||||||||||||||||||||||||||||||||||||||||||||||||||||||||||||||||||||||||||||||
| Highest Quarterly Return, Label [Optional Text] | Highest Quarterly Return:30.01% 2nd Quarter 202001/01/2016 through 12/31/2025 | |||||||||||||||||||||||||||||||||||||||||||||||||||||||||||||||||||||||||||||||||||||||||||||||||||||
| Highest Quarterly Return | 30.01% | |||||||||||||||||||||||||||||||||||||||||||||||||||||||||||||||||||||||||||||||||||||||||||||||||||||
| Highest Quarterly Return, Date | Jun. 30, 2020 | |||||||||||||||||||||||||||||||||||||||||||||||||||||||||||||||||||||||||||||||||||||||||||||||||||||
| Lowest Quarterly Return, Label [Optional Text] | Lowest Quarterly Return:-20.94% 2nd Quarter 202201/01/2016 through 12/31/2025 | |||||||||||||||||||||||||||||||||||||||||||||||||||||||||||||||||||||||||||||||||||||||||||||||||||||
| Lowest Quarterly Return | (20.94%) | |||||||||||||||||||||||||||||||||||||||||||||||||||||||||||||||||||||||||||||||||||||||||||||||||||||
| Lowest Quarterly Return, Date | Jun. 30, 2022 | |||||||||||||||||||||||||||||||||||||||||||||||||||||||||||||||||||||||||||||||||||||||||||||||||||||
| American Beacon Man Funds - Classes A, C, Y, R6, R5 and Investor | American Beacon Man Large Cap Value Fund | ||||||||||||||||||||||||||||||||||||||||||||||||||||||||||||||||||||||||||||||||||||||||||||||||||||||
| Prospectus [Line Items] | ||||||||||||||||||||||||||||||||||||||||||||||||||||||||||||||||||||||||||||||||||||||||||||||||||||||
| Bar Chart and Performance Table [Heading] | Fund Performance | |||||||||||||||||||||||||||||||||||||||||||||||||||||||||||||||||||||||||||||||||||||||||||||||||||||
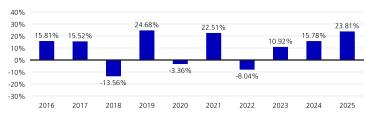
| Performance Narrative [Text Block] | The bar chart and table below provide an indication of risk by showing changes in the Fund’s performance over time. The bar chart shows how the Fund’s performance has varied from year to year. The table shows how the Fund’s average annual total returns compare to a broad-based securities market index, as well as an additional index with characteristics that are similar to those of the Fund, for the periods indicated. Effective May 1, 2024, a new sub-advisor began managing the Fund. Performance through April 30, 2024 reflects the Fund’s performance under the management of its prior sub-advisor. The chart and the table show the performance of the Fund’s Investor Class shares for all periods. In the table below, for the period prior to April 28, 2017, the performance of the R6 Class shares reflects the returns of the Investor Class shares of the Fund. The R6 Class shares would have had similar annual returns to the Investor Class shares because the shares of each class represent investments in the same portfolio securities. However, as reflected in the “Fees and Expenses of the Fund” section of this Fund Summary, the expenses of the Investor Class shares differ from those of the R6 Class shares, which would affect performance. To the extent that the Fund’s Investor Class shares may have had lower expenses than the R6 Class shares prior to April 28, 2017, the performance of the Investor Class shares would likely have been higher than the performance the R6 Class shares would have realized during the same period. The performance of the R6 Class shares shown in the table has not been adjusted for differences in operating expenses between that share class and the Investor Class shares. C Class shares automatically convert to A Class shares 8 years after purchase, if the conversion is available through your financial intermediary. In the table below, the performance for C Class shares reflects the performance as though C Class shares were held for the full 10 year period. You may obtain updated performance information on the Fund’s website at www.americanbeaconfunds.com. Past performance (before and after taxes) is not necessarily an indication of how the Fund will perform in the future.
|
|||||||||||||||||||||||||||||||||||||||||||||||||||||||||||||||||||||||||||||||||||||||||||||||||||||
| Performance Past Does Not Indicate Future [Text] | Past performance (before and after taxes) is not necessarily an indication of how the Fund will perform in the future. | |||||||||||||||||||||||||||||||||||||||||||||||||||||||||||||||||||||||||||||||||||||||||||||||||||||
| Performance Information Illustrates Variability of Returns [Text] | The bar chart and table below provide an indication of risk by showing changes in the Fund’s performance over time. The bar chart shows how the Fund’s performance has varied from year to year. The table shows how the Fund’s average annual total returns compare to a broad-based securities market index, as well as an additional index with characteristics that are similar to those of the Fund, for the periods indicated. Effective May 1, 2024, a new sub-advisor began managing the Fund. Performance through April 30, 2024 reflects the Fund’s performance under the management of its prior sub-advisor. | |||||||||||||||||||||||||||||||||||||||||||||||||||||||||||||||||||||||||||||||||||||||||||||||||||||
| Bar Chart [Heading] | Calendar year total returns for Investor Class Shares. Year Ended 12/31 | |||||||||||||||||||||||||||||||||||||||||||||||||||||||||||||||||||||||||||||||||||||||||||||||||||||
| Bar Chart [Table] | ![]() |
|||||||||||||||||||||||||||||||||||||||||||||||||||||||||||||||||||||||||||||||||||||||||||||||||||||
| Bar Chart Closing [Text Block] | Highest
Quarterly Return: 17.17% 2nd Quarter 2020 01/01/2016 through 12/31/2025 Lowest
Quarterly Return:
-31.76% 1st Quarter 2020 01/01/2016 through 12/31/2025 |
|||||||||||||||||||||||||||||||||||||||||||||||||||||||||||||||||||||||||||||||||||||||||||||||||||||
| Performance Table Heading | Average annual total returns for periods ended December 31, 2025 | |||||||||||||||||||||||||||||||||||||||||||||||||||||||||||||||||||||||||||||||||||||||||||||||||||||
| Performance Table Uses Highest Federal Rate | After-tax returns are calculated using the historical highest individual federal marginal income tax rates and do not reflect the impact of state and local income taxes. | |||||||||||||||||||||||||||||||||||||||||||||||||||||||||||||||||||||||||||||||||||||||||||||||||||||
| Performance Table Not Relevant to Tax Deferred | If you are a tax-exempt entity or hold your Fund shares through a tax-deferred arrangement, such as an individual retirement account (“IRA”) or a 401(k) plan, the after-tax returns do not apply to your situation. | |||||||||||||||||||||||||||||||||||||||||||||||||||||||||||||||||||||||||||||||||||||||||||||||||||||
| Performance Table Explanation after Tax Higher | The return after taxes on distributions and sale of Fund shares may exceed the return before taxes due to an assumed tax benefit from any losses on a sale of Fund shares at the end of the measurement period. | |||||||||||||||||||||||||||||||||||||||||||||||||||||||||||||||||||||||||||||||||||||||||||||||||||||
| Performance [Table] |
|
|||||||||||||||||||||||||||||||||||||||||||||||||||||||||||||||||||||||||||||||||||||||||||||||||||||
| Performance Table One Class of after Tax Shown [Text] | After-tax returns are shown only for Investor Class shares of the Fund; after-tax returns for other share classes will vary. | |||||||||||||||||||||||||||||||||||||||||||||||||||||||||||||||||||||||||||||||||||||||||||||||||||||
| Performance Table Closing [Text Block] | After-tax returns are calculated using the historical highest individual federal marginal income tax rates and do not reflect the impact of state and local income taxes. Actual after-tax returns depend on an investor’s tax situation and may differ from those shown. The return after taxes on distributions and sale of Fund shares may exceed the return before taxes due to an assumed tax benefit from any losses on a sale of Fund shares at the end of the measurement period. If you are a tax-exempt entity or hold your Fund shares through a tax-deferred arrangement, such as an individual retirement account (“IRA”) or a 401(k) plan, the after-tax returns do not apply to your situation. After-tax returns are shown only for Investor Class shares of the Fund; after-tax returns for other share classes will vary.
|
|||||||||||||||||||||||||||||||||||||||||||||||||||||||||||||||||||||||||||||||||||||||||||||||||||||
| Performance Availability Website Address [Text] | www.americanbeaconfunds.com | |||||||||||||||||||||||||||||||||||||||||||||||||||||||||||||||||||||||||||||||||||||||||||||||||||||
| American Beacon Man Funds - Classes A, C, Y, R6, R5 and Investor | American Beacon Man Large Cap Value Fund | Investor Class | ||||||||||||||||||||||||||||||||||||||||||||||||||||||||||||||||||||||||||||||||||||||||||||||||||||||
| Prospectus [Line Items] | ||||||||||||||||||||||||||||||||||||||||||||||||||||||||||||||||||||||||||||||||||||||||||||||||||||||
| Highest Quarterly Return, Label [Optional Text] | Highest Quarterly Return:17.17% 2nd Quarter 202001/01/2016 through 12/31/2025 | |||||||||||||||||||||||||||||||||||||||||||||||||||||||||||||||||||||||||||||||||||||||||||||||||||||
| Highest Quarterly Return | 17.17% | |||||||||||||||||||||||||||||||||||||||||||||||||||||||||||||||||||||||||||||||||||||||||||||||||||||
| Highest Quarterly Return, Date | Jun. 30, 2020 | |||||||||||||||||||||||||||||||||||||||||||||||||||||||||||||||||||||||||||||||||||||||||||||||||||||
| Lowest Quarterly Return, Label [Optional Text] | Lowest Quarterly Return:-31.76% 1st Quarter 202001/01/2016 through 12/31/2025 | |||||||||||||||||||||||||||||||||||||||||||||||||||||||||||||||||||||||||||||||||||||||||||||||||||||
| Lowest Quarterly Return | (31.76%) | |||||||||||||||||||||||||||||||||||||||||||||||||||||||||||||||||||||||||||||||||||||||||||||||||||||
| Lowest Quarterly Return, Date | Mar. 31, 2020 | |||||||||||||||||||||||||||||||||||||||||||||||||||||||||||||||||||||||||||||||||||||||||||||||||||||
| American Beacon Stephens Funds - Classes A, C, Y, R6, R5 and Investor | American Beacon Stephens Mid-Cap Growth Fund | ||||||||||||||||||||||||||||||||||||||||||||||||||||||||||||||||||||||||||||||||||||||||||||||||||||||
| Prospectus [Line Items] | ||||||||||||||||||||||||||||||||||||||||||||||||||||||||||||||||||||||||||||||||||||||||||||||||||||||
| Bar Chart and Performance Table [Heading] | Fund Performance | |||||||||||||||||||||||||||||||||||||||||||||||||||||||||||||||||||||||||||||||||||||||||||||||||||||
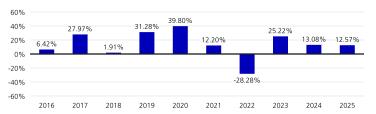
| Performance Narrative [Text Block] | The bar chart and table below provide an indication of risk by showing changes in the Fund’s performance over time. The bar chart shows how the Fund’s performance has varied from year to year. The table shows how the Fund’s average annual total returns compare to a broad-based securities market index, as well as an additional index with characteristics that are similar to those of the Fund, for the periods indicated. The chart and the table show the performance of the Fund’s Investor Class shares for all periods. In the table below, for the period prior to December 31, 2018, the performance of the Fund’s R6 Class shares reflects the returns of the R5 Class shares of the Fund. The R6 Class shares would have had similar annual returns to the R5 Class shares because the shares of each class represent investments in the same portfolio securities. However, as reflected in the “Fees and Expenses of the Fund” section of this Fund Summary, the expenses of the R5 Class shares differ from those of the R6 Class shares, which would affect performance. To the extent that the Fund’s R5 Class shares may have had lower expenses than the R6 Class shares prior to December 31, 2018, the performance of the R5 Class shares would likely have been higher than the performance the R6 Class shares would have realized during the same period. The performance of the R6 Class shares shown in the table has not been adjusted for differences in operating expenses between that share class and the R5 Class shares. C Class shares automatically convert to A Class shares 8 years after purchase, if the conversion is available through your financial intermediary. In the table below, the performance for C Class shares reflects the performance as though C Class shares were held for the full 10 year period. You may obtain updated performance information on the Fund’s website at www.americanbeaconfunds.com. Past performance (before and after taxes) is not necessarily an indication of how the Fund will perform in the future.
|
|||||||||||||||||||||||||||||||||||||||||||||||||||||||||||||||||||||||||||||||||||||||||||||||||||||
| Performance Past Does Not Indicate Future [Text] | Past performance (before and after taxes) is not necessarily an indication of how the Fund will perform in the future. | |||||||||||||||||||||||||||||||||||||||||||||||||||||||||||||||||||||||||||||||||||||||||||||||||||||
| Performance Information Illustrates Variability of Returns [Text] | The bar chart and table below provide an indication of risk by showing changes in the Fund’s performance over time. The bar chart shows how the Fund’s performance has varied from year to year. The table shows how the Fund’s average annual total returns compare to a broad-based securities market index, as well as an additional index with characteristics that are similar to those of the Fund, for the periods indicated. | |||||||||||||||||||||||||||||||||||||||||||||||||||||||||||||||||||||||||||||||||||||||||||||||||||||
| Bar Chart [Heading] | Calendar year total returns for Investor Class Shares. Year Ended 12/31 | |||||||||||||||||||||||||||||||||||||||||||||||||||||||||||||||||||||||||||||||||||||||||||||||||||||
| Bar Chart [Table] | ![]() |
|||||||||||||||||||||||||||||||||||||||||||||||||||||||||||||||||||||||||||||||||||||||||||||||||||||
| Bar Chart Closing [Text Block] | Highest
Quarterly Return: 34.11% 2nd Quarter 2020 01/01/2016 through 12/31/2025 Lowest
Quarterly Return:
-20.89% 2nd Quarter 2022 01/01/2016 through 12/31/2025 |
|||||||||||||||||||||||||||||||||||||||||||||||||||||||||||||||||||||||||||||||||||||||||||||||||||||
| Performance Table Heading | Average annual total returns for periods ended December 31, 2025 | |||||||||||||||||||||||||||||||||||||||||||||||||||||||||||||||||||||||||||||||||||||||||||||||||||||
| Performance Table Uses Highest Federal Rate | After-tax returns are calculated using the historical highest individual federal marginal income tax rates and do not reflect the impact of state and local income taxes. | |||||||||||||||||||||||||||||||||||||||||||||||||||||||||||||||||||||||||||||||||||||||||||||||||||||
| Performance Table Not Relevant to Tax Deferred | If you are a tax-exempt entity or hold your Fund shares through a tax-deferred arrangement, such as an individual retirement account (“IRA”) or a 401(k) plan, the after-tax returns do not apply to your situation. | |||||||||||||||||||||||||||||||||||||||||||||||||||||||||||||||||||||||||||||||||||||||||||||||||||||
| Performance Table Explanation after Tax Higher | The return after taxes on distributions and sale of Fund shares may exceed the return before taxes due to an assumed tax benefit from any losses on a sale of Fund shares at the end of the measurement period. | |||||||||||||||||||||||||||||||||||||||||||||||||||||||||||||||||||||||||||||||||||||||||||||||||||||
| Performance [Table] |
|
|||||||||||||||||||||||||||||||||||||||||||||||||||||||||||||||||||||||||||||||||||||||||||||||||||||
| Performance Table One Class of after Tax Shown [Text] | After-tax returns are shown only for Investor Class shares of the Fund; after-tax returns for other share classes will vary. | |||||||||||||||||||||||||||||||||||||||||||||||||||||||||||||||||||||||||||||||||||||||||||||||||||||
| Performance Table Closing [Text Block] | After-tax returns are calculated using the historical highest individual federal marginal income tax rates and do not reflect the impact of state and local income taxes. Actual after-tax returns depend on an investor’s tax situation and may differ from those shown. The return after taxes on distributions and sale of Fund shares may exceed the return before taxes due to an assumed tax benefit from any losses on a sale of Fund shares at the end of the measurement period. If you are a tax-exempt entity or hold your Fund shares through a tax-deferred arrangement, such as an individual retirement account (“IRA”) or a 401(k) plan, the after-tax returns do not apply to your situation. After-tax returns are shown only for Investor Class shares of the Fund; after-tax returns for other share classes will vary.
|
|||||||||||||||||||||||||||||||||||||||||||||||||||||||||||||||||||||||||||||||||||||||||||||||||||||
| Performance Availability Website Address [Text] | www.americanbeaconfunds.com | |||||||||||||||||||||||||||||||||||||||||||||||||||||||||||||||||||||||||||||||||||||||||||||||||||||
| American Beacon Stephens Funds - Classes A, C, Y, R6, R5 and Investor | American Beacon Stephens Mid-Cap Growth Fund | Investor Class | ||||||||||||||||||||||||||||||||||||||||||||||||||||||||||||||||||||||||||||||||||||||||||||||||||||||
| Prospectus [Line Items] | ||||||||||||||||||||||||||||||||||||||||||||||||||||||||||||||||||||||||||||||||||||||||||||||||||||||
| Highest Quarterly Return, Label [Optional Text] | Highest Quarterly Return:34.11% 2nd Quarter 202001/01/2016 through 12/31/2025 | |||||||||||||||||||||||||||||||||||||||||||||||||||||||||||||||||||||||||||||||||||||||||||||||||||||
| Highest Quarterly Return | 34.11% | |||||||||||||||||||||||||||||||||||||||||||||||||||||||||||||||||||||||||||||||||||||||||||||||||||||
| Highest Quarterly Return, Date | Jun. 30, 2020 | |||||||||||||||||||||||||||||||||||||||||||||||||||||||||||||||||||||||||||||||||||||||||||||||||||||
| Lowest Quarterly Return, Label [Optional Text] | Lowest Quarterly Return:-20.89% 2nd Quarter 202201/01/2016 through 12/31/2025 | |||||||||||||||||||||||||||||||||||||||||||||||||||||||||||||||||||||||||||||||||||||||||||||||||||||
| Lowest Quarterly Return | (20.89%) | |||||||||||||||||||||||||||||||||||||||||||||||||||||||||||||||||||||||||||||||||||||||||||||||||||||
| Lowest Quarterly Return, Date | Jun. 30, 2022 | |||||||||||||||||||||||||||||||||||||||||||||||||||||||||||||||||||||||||||||||||||||||||||||||||||||
| American Beacon Stephens Funds - Classes A, C, Y, R6, R5 and Investor | American Beacon Stephens Small Cap Growth Fund | ||||||||||||||||||||||||||||||||||||||||||||||||||||||||||||||||||||||||||||||||||||||||||||||||||||||
| Prospectus [Line Items] | ||||||||||||||||||||||||||||||||||||||||||||||||||||||||||||||||||||||||||||||||||||||||||||||||||||||
| Bar Chart and Performance Table [Heading] | Fund Performance | |||||||||||||||||||||||||||||||||||||||||||||||||||||||||||||||||||||||||||||||||||||||||||||||||||||
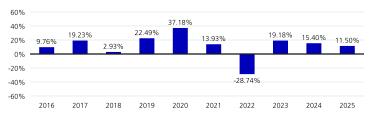
| Performance Narrative [Text Block] | The bar chart and table below provide an indication of risk by showing changes in the Fund’s performance over time. The bar chart shows how the Fund’s performance has varied from year to year. The table shows how the Fund’s average annual total returns compare to a broad-based securities market index, as well as an additional index with characteristics that are similar to those of the Fund, for the periods indicated. The chart and the table show the performance of the Fund’s Investor Class shares for all periods. In the table below, for the period prior to April 30, 2019, the performance for the Fund’s R6 Class shares reflects the returns of the Fund’s R5 Class shares. The R6 Class shares would have had similar annual returns to the R5 Class shares because the shares of each class represent investments in the same portfolio securities. However, as reflected in the “Fees and Expenses of the Fund” section of this Fund Summary, the expenses of the R5 Class shares differ from those of the R6 Class shares, which would affect performance. To the extent that the Fund’s R5 Class shares may have had lower expenses than the R6 Class shares prior to April 30, 2019, the performance of the R5 Class shares would likely have been higher than the performance the R6 Class shares would have realized during the same period. The performance of the R6 Class shares shown in the table has not been adjusted for differences in operating expenses between that share class and the R5 Class shares. C Class shares automatically convert to A Class shares 8 years after purchase, if the conversion is available through your financial intermediary. In the table below, the performance for C Class shares reflects the performance as though C Class shares were held for the full 10 year period. You may obtain updated performance information on the Fund’s website at www.americanbeaconfunds.com. Past performance (before and after taxes) is not necessarily an indication of how the Fund will perform in the future.
|
|||||||||||||||||||||||||||||||||||||||||||||||||||||||||||||||||||||||||||||||||||||||||||||||||||||
| Performance Past Does Not Indicate Future [Text] | Past performance (before and after taxes) is not necessarily an indication of how the Fund will perform in the future. | |||||||||||||||||||||||||||||||||||||||||||||||||||||||||||||||||||||||||||||||||||||||||||||||||||||
| Performance Information Illustrates Variability of Returns [Text] | The bar chart and table below provide an indication of risk by showing changes in the Fund’s performance over time. The bar chart shows how the Fund’s performance has varied from year to year. The table shows how the Fund’s average annual total returns compare to a broad-based securities market index, as well as an additional index with characteristics that are similar to those of the Fund, for the periods indicated. | |||||||||||||||||||||||||||||||||||||||||||||||||||||||||||||||||||||||||||||||||||||||||||||||||||||
| Bar Chart [Heading] | Calendar year total returns for Investor Class Shares. Year Ended 12/31 | |||||||||||||||||||||||||||||||||||||||||||||||||||||||||||||||||||||||||||||||||||||||||||||||||||||
| Bar Chart [Table] | ![]() |
|||||||||||||||||||||||||||||||||||||||||||||||||||||||||||||||||||||||||||||||||||||||||||||||||||||
| Bar Chart Closing [Text Block] | Highest
Quarterly Return: 37.56% 2nd Quarter 2020 01/01/2016 through 12/31/2025 Lowest
Quarterly Return:
-22.26% 1st Quarter 2020 01/01/2016 through 12/31/2025 |
|||||||||||||||||||||||||||||||||||||||||||||||||||||||||||||||||||||||||||||||||||||||||||||||||||||
| Performance Table Heading | Average annual total returns for periods ended December 31, 2025 | |||||||||||||||||||||||||||||||||||||||||||||||||||||||||||||||||||||||||||||||||||||||||||||||||||||
| Performance Table Uses Highest Federal Rate | After-tax returns are calculated using the historical highest individual federal marginal income tax rates and do not reflect the impact of state and local income taxes. | |||||||||||||||||||||||||||||||||||||||||||||||||||||||||||||||||||||||||||||||||||||||||||||||||||||
| Performance Table Not Relevant to Tax Deferred | If you are a tax-exempt entity or hold your Fund shares through a tax-deferred arrangement, such as an individual retirement account (“IRA”) or a 401(k) plan, the after-tax returns do not apply to your situation. | |||||||||||||||||||||||||||||||||||||||||||||||||||||||||||||||||||||||||||||||||||||||||||||||||||||
| Performance Table Explanation after Tax Higher | The return after taxes on distributions and sale of Fund shares may exceed the return before taxes due to an assumed tax benefit from any losses on a sale of Fund shares at the end of the measurement period. | |||||||||||||||||||||||||||||||||||||||||||||||||||||||||||||||||||||||||||||||||||||||||||||||||||||
| Performance [Table] |
|
[1] | ||||||||||||||||||||||||||||||||||||||||||||||||||||||||||||||||||||||||||||||||||||||||||||||||||||
| Performance Table One Class of after Tax Shown [Text] | After-tax returns are shown only for Investor Class shares of the Fund; after-tax returns for other share classes will vary. | |||||||||||||||||||||||||||||||||||||||||||||||||||||||||||||||||||||||||||||||||||||||||||||||||||||
| Performance Table Closing [Text Block] | After-tax returns are calculated using the historical highest individual federal marginal income tax rates and do not reflect the impact of state and local income taxes. Actual after-tax returns depend on an investor’s tax situation and may differ from those shown. The return after taxes on distributions and sale of Fund shares may exceed the return before taxes due to an assumed tax benefit from any losses on a sale of Fund shares at the end of the measurement period. If you are a tax-exempt entity or hold your Fund shares through a tax-deferred arrangement, such as an individual retirement account (“IRA”) or a 401(k) plan, the after-tax returns do not apply to your situation. After-tax returns are shown only for Investor Class shares of the Fund; after-tax returns for other share classes will vary.
|
|||||||||||||||||||||||||||||||||||||||||||||||||||||||||||||||||||||||||||||||||||||||||||||||||||||
| Performance Availability Website Address [Text] | www.americanbeaconfunds.com | |||||||||||||||||||||||||||||||||||||||||||||||||||||||||||||||||||||||||||||||||||||||||||||||||||||
| American Beacon Stephens Funds - Classes A, C, Y, R6, R5 and Investor | American Beacon Stephens Small Cap Growth Fund | Investor Class | ||||||||||||||||||||||||||||||||||||||||||||||||||||||||||||||||||||||||||||||||||||||||||||||||||||||
| Prospectus [Line Items] | ||||||||||||||||||||||||||||||||||||||||||||||||||||||||||||||||||||||||||||||||||||||||||||||||||||||
| Highest Quarterly Return, Label [Optional Text] | Highest Quarterly Return:37.56% 2nd Quarter 202001/01/2016 through 12/31/2025 | |||||||||||||||||||||||||||||||||||||||||||||||||||||||||||||||||||||||||||||||||||||||||||||||||||||
| Highest Quarterly Return | 37.56% | |||||||||||||||||||||||||||||||||||||||||||||||||||||||||||||||||||||||||||||||||||||||||||||||||||||
| Highest Quarterly Return, Date | Jun. 30, 2020 | |||||||||||||||||||||||||||||||||||||||||||||||||||||||||||||||||||||||||||||||||||||||||||||||||||||
| Lowest Quarterly Return, Label [Optional Text] | Lowest Quarterly Return:-22.26% 1st Quarter 202001/01/2016 through 12/31/2025 | |||||||||||||||||||||||||||||||||||||||||||||||||||||||||||||||||||||||||||||||||||||||||||||||||||||
| Lowest Quarterly Return | (22.26%) | |||||||||||||||||||||||||||||||||||||||||||||||||||||||||||||||||||||||||||||||||||||||||||||||||||||
| Lowest Quarterly Return, Date | Mar. 31, 2020 | |||||||||||||||||||||||||||||||||||||||||||||||||||||||||||||||||||||||||||||||||||||||||||||||||||||
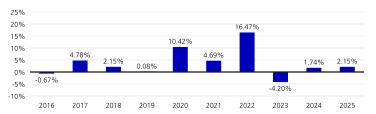
| American Beacon AHL Funds - Classes A, C, Y, R6, R5 and Investor | American Beacon AHL Managed Futures Strategy Fund | ||||||||||||||||||||||||||||||||||||||||||||||||||||||||||||||||||||||||||||||||||||||||||||||||||||||
| Prospectus [Line Items] | ||||||||||||||||||||||||||||||||||||||||||||||||||||||||||||||||||||||||||||||||||||||||||||||||||||||
| Bar Chart and Performance Table [Heading] | Fund Performance | |||||||||||||||||||||||||||||||||||||||||||||||||||||||||||||||||||||||||||||||||||||||||||||||||||||
| Performance Narrative [Text Block] | The bar chart and table below provide an indication of risk by showing changes in the Fund’s performance over time. The bar chart shows how the Fund’s performance has varied from year to year. The table shows how the Fund’s average annual total returns compare to a broad-based securities market index, as well as an additional market index with characteristics that are similar to those of the Fund, for the periods indicated. The chart and the table show the performance of the Fund’s Investor Class shares for all periods. C Class shares automatically convert to A Class shares 8 years after purchase, if the conversion is available through your financial intermediary. In the table below, the performance for C Class shares reflects the performance as though C Class shares were held for the full 10-year period. You may obtain updated performance information on the Fund’s website at www.americanbeaconfunds.com. Past performance (before and after taxes) is not necessarily an indication of how the Fund will perform in the future.
|
|||||||||||||||||||||||||||||||||||||||||||||||||||||||||||||||||||||||||||||||||||||||||||||||||||||
| Performance Past Does Not Indicate Future [Text] | Past performance (before and after taxes) is not necessarily an indication of how the Fund will perform in the future. | |||||||||||||||||||||||||||||||||||||||||||||||||||||||||||||||||||||||||||||||||||||||||||||||||||||
| Performance Information Illustrates Variability of Returns [Text] | The bar chart and table below provide an indication of risk by showing changes in the Fund’s performance over time. The bar chart shows how the Fund’s performance has varied from year to year. The table shows how the Fund’s average annual total returns compare to a broad-based securities market index, as well as an additional market index with characteristics that are similar to those of the Fund, for the periods indicated. | |||||||||||||||||||||||||||||||||||||||||||||||||||||||||||||||||||||||||||||||||||||||||||||||||||||
| Bar Chart [Heading] | Calendar year total returns for Investor Class Shares. Year Ended 12/31 | |||||||||||||||||||||||||||||||||||||||||||||||||||||||||||||||||||||||||||||||||||||||||||||||||||||
| Bar Chart [Table] | ![]() |
|||||||||||||||||||||||||||||||||||||||||||||||||||||||||||||||||||||||||||||||||||||||||||||||||||||
| Bar Chart Closing [Text Block] | Highest
Quarterly Return: 9.59% 1st Quarter 2022 01/01/2016 through 12/31/2025 Lowest
Quarterly Return:
-5.80% 4th Quarter 2022 01/01/2016 through 12/31/2025 |
|||||||||||||||||||||||||||||||||||||||||||||||||||||||||||||||||||||||||||||||||||||||||||||||||||||
| Performance Table Heading | Average annual total returns for periods ended December 31, 2025 | |||||||||||||||||||||||||||||||||||||||||||||||||||||||||||||||||||||||||||||||||||||||||||||||||||||
| Performance Table Uses Highest Federal Rate | After-tax returns are calculated using the historical highest individual federal marginal income tax rates and do not reflect the impact of state and local income taxes. | |||||||||||||||||||||||||||||||||||||||||||||||||||||||||||||||||||||||||||||||||||||||||||||||||||||
| Performance Table Not Relevant to Tax Deferred | If you are a tax-exempt entity or hold your Fund shares through a tax-deferred arrangement, such as an individual retirement account (“IRA”) or a 401(k) plan, the after-tax returns do not apply to your situation. | |||||||||||||||||||||||||||||||||||||||||||||||||||||||||||||||||||||||||||||||||||||||||||||||||||||
| Performance Table Explanation after Tax Higher | The return after taxes on distributions and sale of Fund shares may exceed the return before taxes due to an assumed tax benefit from any losses on a sale of Fund shares at the end of the measurement period. | |||||||||||||||||||||||||||||||||||||||||||||||||||||||||||||||||||||||||||||||||||||||||||||||||||||
| Performance [Table] |
|
|||||||||||||||||||||||||||||||||||||||||||||||||||||||||||||||||||||||||||||||||||||||||||||||||||||
| Performance Table One Class of after Tax Shown [Text] | After-tax returns are shown only for Investor Class shares of the Fund; after-tax returns for other share classes will vary. | |||||||||||||||||||||||||||||||||||||||||||||||||||||||||||||||||||||||||||||||||||||||||||||||||||||
| Performance Table Closing [Text Block] | After-tax returns are calculated using the historical highest individual federal marginal income tax rates and do not reflect the impact of state and local income taxes. Actual after-tax returns depend on an investor’s tax situation and may differ from those shown. The return after taxes on distributions and sale of Fund shares may exceed the return before taxes due to an assumed tax benefit from any losses on a sale of Fund shares at the end of the measurement period. If you are a tax-exempt entity or hold your Fund shares through a tax-deferred arrangement, such as an individual retirement account (“IRA”) or a 401(k) plan, the after-tax returns do not apply to your situation. After-tax returns are shown only for Investor Class shares of the Fund; after-tax returns for other share classes will vary.
|
|||||||||||||||||||||||||||||||||||||||||||||||||||||||||||||||||||||||||||||||||||||||||||||||||||||
| Performance Availability Website Address [Text] | www.americanbeaconfunds.com | |||||||||||||||||||||||||||||||||||||||||||||||||||||||||||||||||||||||||||||||||||||||||||||||||||||
| American Beacon AHL Funds - Classes A, C, Y, R6, R5 and Investor | American Beacon AHL Managed Futures Strategy Fund | Investor Class | ||||||||||||||||||||||||||||||||||||||||||||||||||||||||||||||||||||||||||||||||||||||||||||||||||||||
| Prospectus [Line Items] | ||||||||||||||||||||||||||||||||||||||||||||||||||||||||||||||||||||||||||||||||||||||||||||||||||||||
| Highest Quarterly Return, Label [Optional Text] | Highest Quarterly Return:9.59% 1st Quarter 202201/01/2016 through 12/31/2025 | |||||||||||||||||||||||||||||||||||||||||||||||||||||||||||||||||||||||||||||||||||||||||||||||||||||
| Highest Quarterly Return | 9.59% | |||||||||||||||||||||||||||||||||||||||||||||||||||||||||||||||||||||||||||||||||||||||||||||||||||||
| Highest Quarterly Return, Date | Mar. 31, 2022 | |||||||||||||||||||||||||||||||||||||||||||||||||||||||||||||||||||||||||||||||||||||||||||||||||||||
| Lowest Quarterly Return, Label [Optional Text] | Lowest Quarterly Return:-5.80% 4th Quarter 202201/01/2016 through 12/31/2025 | |||||||||||||||||||||||||||||||||||||||||||||||||||||||||||||||||||||||||||||||||||||||||||||||||||||
| Lowest Quarterly Return | (5.80%) | |||||||||||||||||||||||||||||||||||||||||||||||||||||||||||||||||||||||||||||||||||||||||||||||||||||
| Lowest Quarterly Return, Date | Dec. 31, 2022 | |||||||||||||||||||||||||||||||||||||||||||||||||||||||||||||||||||||||||||||||||||||||||||||||||||||
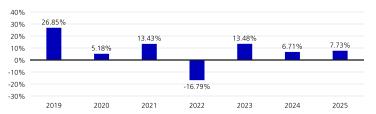
| American Beacon AHL Funds - Classes A, C, Y, R6, R5 and Investor | American Beacon AHL TargetRisk Fund | ||||||||||||||||||||||||||||||||||||||||||||||||||||||||||||||||||||||||||||||||||||||||||||||||||||||
| Prospectus [Line Items] | ||||||||||||||||||||||||||||||||||||||||||||||||||||||||||||||||||||||||||||||||||||||||||||||||||||||
| Bar Chart and Performance Table [Heading] | Fund Performance | |||||||||||||||||||||||||||||||||||||||||||||||||||||||||||||||||||||||||||||||||||||||||||||||||||||
| Performance Narrative [Text Block] | The bar chart and table below provide an indication of risk by showing changes in the Fund’s performance over time. The bar chart shows how the Fund’s performance has varied from year to year. The table shows how the Fund’s average annual total returns compare to a broad-based securities market index, as well as an additional composite index with characteristics that are similar to those of the Fund, and the two indices that comprise the composite index, for the periods indicated. The chart and the table show the performance of the Fund’s Investor Class shares for all periods. In the table below, for the period prior to April 30, 2019, the performance of the A Class and C Class shares reflects the returns of the Investor Class shares of the Fund. The newer share classes would have had similar annual returns to the Investor Class shares because the shares of each class represent investments in the same portfolio securities. However, as reflected in the “Fees and Expenses of the Fund” section of this Fund Summary, the expenses of the Investor Class shares differ from those of the newer share classes, which would affect performance. To the extent that the Investor Class shares had lower expenses than a newer share class, the performance of the Investor Class shares would likely have been higher than the newer share class would have realized during the same period. The performance of the newer share classes shown in the table has not been adjusted for differences in operating expenses between those share classes and the Investor Class shares, but the A Class and C Class shares performance has been adjusted for the impact of the maximum applicable sales charge. You may obtain updated performance information on the Fund’s website at www.americanbeaconfunds.com. Past performance (before and after taxes) is not necessarily an indication of how the Fund will perform in the future.
|
|||||||||||||||||||||||||||||||||||||||||||||||||||||||||||||||||||||||||||||||||||||||||||||||||||||
| Performance Past Does Not Indicate Future [Text] | Past performance (before and after taxes) is not necessarily an indication of how the Fund will perform in the future. | |||||||||||||||||||||||||||||||||||||||||||||||||||||||||||||||||||||||||||||||||||||||||||||||||||||
| Performance Information Illustrates Variability of Returns [Text] | The bar chart and table below provide an indication of risk by showing changes in the Fund’s performance over time. The bar chart shows how the Fund’s performance has varied from year to year. The table shows how the Fund’s average annual total returns compare to a broad-based securities market index, as well as an additional composite index with characteristics that are similar to those of the Fund, and the two indices that comprise the composite index, for the periods indicated. | |||||||||||||||||||||||||||||||||||||||||||||||||||||||||||||||||||||||||||||||||||||||||||||||||||||
| Bar Chart [Heading] | Calendar year total returns for Investor Class Shares. Year Ended 12/31 | |||||||||||||||||||||||||||||||||||||||||||||||||||||||||||||||||||||||||||||||||||||||||||||||||||||
| Bar Chart [Table] | ![]() |
|||||||||||||||||||||||||||||||||||||||||||||||||||||||||||||||||||||||||||||||||||||||||||||||||||||
| Bar Chart Closing [Text Block] | Highest
Quarterly Return: 12.00% 1st Quarter 2019 01/01/2019 through 12/31/2025 Lowest
Quarterly Return:
-9.83% 2nd Quarter 2022 01/01/2019 through 12/31/2025 |
|||||||||||||||||||||||||||||||||||||||||||||||||||||||||||||||||||||||||||||||||||||||||||||||||||||
| Performance Table Heading | Average annual total returns for periods ended December 31, 2025 | |||||||||||||||||||||||||||||||||||||||||||||||||||||||||||||||||||||||||||||||||||||||||||||||||||||
| Performance Table Uses Highest Federal Rate | After-tax returns are calculated using the historical highest individual federal marginal income tax rates and do not reflect the impact of state and local income taxes. | |||||||||||||||||||||||||||||||||||||||||||||||||||||||||||||||||||||||||||||||||||||||||||||||||||||
| Performance Table Not Relevant to Tax Deferred | If you are a tax-exempt entity or hold your Fund shares through a tax-deferred arrangement, such as an individual retirement account (“IRA”) or a 401(k) plan, the after-tax returns do not apply to your situation. | |||||||||||||||||||||||||||||||||||||||||||||||||||||||||||||||||||||||||||||||||||||||||||||||||||||
| Performance Table Explanation after Tax Higher | The return after taxes on distributions and sale of Fund shares may exceed the return before taxes due to an assumed tax benefit from any losses on a sale of Fund shares at the end of the measurement period. | |||||||||||||||||||||||||||||||||||||||||||||||||||||||||||||||||||||||||||||||||||||||||||||||||||||
| Performance [Table] |
|
|||||||||||||||||||||||||||||||||||||||||||||||||||||||||||||||||||||||||||||||||||||||||||||||||||||
| Performance Table One Class of after Tax Shown [Text] | After-tax returns are shown only for Investor Class shares of the Fund; after-tax returns for other share classes will vary. | |||||||||||||||||||||||||||||||||||||||||||||||||||||||||||||||||||||||||||||||||||||||||||||||||||||
| Performance Table Closing [Text Block] | After-tax returns are calculated using the historical highest individual federal marginal income tax rates and do not reflect the impact of state and local income taxes. Actual after-tax returns depend on an investor’s tax situation and may differ from those shown. The return after taxes on distributions and sale of Fund shares may exceed the return before taxes due to an assumed tax benefit from any losses on a sale of Fund shares at the end of the measurement period. If you are a tax-exempt entity or hold your Fund shares through a tax-deferred arrangement, such as an individual retirement account (“IRA”) or a 401(k) plan, the after-tax returns do not apply to your situation. After-tax returns are shown only for Investor Class shares of the Fund; after-tax returns for other share classes will vary.
|
|||||||||||||||||||||||||||||||||||||||||||||||||||||||||||||||||||||||||||||||||||||||||||||||||||||
| Performance Availability Website Address [Text] | www.americanbeaconfunds.com | |||||||||||||||||||||||||||||||||||||||||||||||||||||||||||||||||||||||||||||||||||||||||||||||||||||
| American Beacon AHL Funds - Classes A, C, Y, R6, R5 and Investor | American Beacon AHL TargetRisk Fund | Investor Class | ||||||||||||||||||||||||||||||||||||||||||||||||||||||||||||||||||||||||||||||||||||||||||||||||||||||
| Prospectus [Line Items] | ||||||||||||||||||||||||||||||||||||||||||||||||||||||||||||||||||||||||||||||||||||||||||||||||||||||
| Highest Quarterly Return, Label [Optional Text] | Highest Quarterly Return:12.00% 1st Quarter 201901/01/2019 through 12/31/2025 | |||||||||||||||||||||||||||||||||||||||||||||||||||||||||||||||||||||||||||||||||||||||||||||||||||||
| Highest Quarterly Return | 12.00% | |||||||||||||||||||||||||||||||||||||||||||||||||||||||||||||||||||||||||||||||||||||||||||||||||||||
| Highest Quarterly Return, Date | Mar. 31, 2019 | |||||||||||||||||||||||||||||||||||||||||||||||||||||||||||||||||||||||||||||||||||||||||||||||||||||
| Lowest Quarterly Return, Label [Optional Text] | Lowest Quarterly Return:-9.83% 2nd Quarter 202201/01/2019 through 12/31/2025 | |||||||||||||||||||||||||||||||||||||||||||||||||||||||||||||||||||||||||||||||||||||||||||||||||||||
| Lowest Quarterly Return | (9.83%) | |||||||||||||||||||||||||||||||||||||||||||||||||||||||||||||||||||||||||||||||||||||||||||||||||||||
| Lowest Quarterly Return, Date | Jun. 30, 2022 | |||||||||||||||||||||||||||||||||||||||||||||||||||||||||||||||||||||||||||||||||||||||||||||||||||||
| ||||||||||||||||||||||||||||||||||||||||||||||||||||||||||||||||||||||||||||||||||||||||||||||||||||||