Baillie Gifford International Alpha Fund seeks capital appreciation.
The tables below describe the fees and expenses that you may pay if you buy, hold, and sell shares of the Fund. You may pay other fees, such as brokerage commissions and other fees to financial intermediaries, which are not reflected in the tables and examples below.
Class K | Institutional Class | |
None | None |
| Class K |
| Institutional Class |
|
Management Fees(a) | 0.52% |
| 0.52% |
|
Distribution (12b‑1) Fees | None |
| None |
|
Other Expenses(b) | 0.07% |
| 0.17% |
|
Total Annual Fund Operating | 0.59% |
| 0.69% |
|
(a) | The Management Fee consists of an Advisory Fee and an Administration and Supervisory Fee paid by the Fund to Baillie Gifford Overseas Limited. |
(b) | Other Expenses for Institutional Class differ due to sub-accounting expenses. |
The example below is intended to help you compare the cost of investing in the Fund with the cost of investing in other mutual funds. It assumes that you invest $10,000 in the Fund for the time periods indicated, regardless of whether or not you redeem your shares at the end of such periods. It also assumes that your investment has a 5% return each year and that the Fund’s operating expenses remain the same.
Class K | Institutional Class | |||
1 Year | $60 | $70 | ||
3 Years | $189 | $221 | ||
5 Years | $329 | $384 | ||
10 Years | $738 | $859 | ||
Class K | Institutional Class | |||
1 Year | $60 | $70 | ||
3 Years | $189 | $221 | ||
5 Years | $329 | $384 | ||
10 Years | $738 | $859 | ||
The Fund pays transaction costs, such as commissions, when it buys and sells securities (or “turns over” its portfolio). A higher portfolio turnover rate may indicate higher transaction costs and may result in higher taxes when Fund shares are held in a taxable account. These transaction costs, which are not reflected in “Annual Fund Operating Expenses” or in the “Example of Expenses” above, affect the Fund’s performance. During the
Fund’s most recent fiscal year, the Fund’s portfolio turnover rate was 19% of the average value of its portfolio.
The Fund seeks to meet its objective by investing in an international portfolio of equities, which include common stock and other equity securities, of issuers located in countries of developed and emerging markets.
Under normal circumstances, the Fund invests at least 80% of its net assets (plus any borrowings for investment purposes) in common stocks and other equity securities. The Fund invests predominantly in securities issued by companies located in countries represented in the MSCI ACWI ex USA Index which includes issuers from a range of developed and emerging market countries. The Fund may invest to a lesser extent in frontier markets. The Fund ordinarily invests in securities of issuers located in at least three countries outside the U.S. The Fund invests in equity securities either directly or indirectly, such as through depositary receipts, and may invest in preferred stocks, convertible securities, rights and warrants. The Fund is not constrained with respect to market capitalization and may participate in initial public offerings (“IPOs”). In addition, investment is permitted in securities offerings that are not registered in the U.S.
The portfolio managers employ a bottom-up approach to stock selection, seeking to identify companies they believe have attractive long-term growth prospects, and principally select companies without being constrained by the MSCI ACWI ex USA benchmark. The portfolio managers focus on company research and the long-term outlook of companies and industries. Ideas can come from a wide variety of sources, including, but not limited to, research trips, company meetings, and relationships with industry thought leaders and academic institutions. Stock ideas are normally researched to assess a range of factors, including: long-term growth potential, geographic and industry positioning, competitive advantage, management, financial strength and valuation. Under normal circumstances, the intended outcome is a diversified portfolio typically consisting of between 60 and 90 growth companies with the potential to outperform the Fund’s benchmark over the long term. The process can result in significant exposure to a single country or a small number of countries. The Fund expects to invest in Chinese companies, among other means, through China A shares, which are common stocks and other equity securities that are listed or traded on a Chinese stock exchange and which are quoted in renminbi, the official currency of China. The Fund aims to hold securities for long periods (typically at least 5 years), which generally results in relatively low portfolio turnover and is in line with the portfolio managers’ long-term investment outlook. When assessing a company’s long-term growth prospects, the portfolio managers seek to identify and to incorporate a range of factors that are material to managing the Fund’s investment risks and maximizing capital appreciation. Such factors potentially include the environmental, social, and/or governance characteristics of the company, such as stewardship, sustainable business practices, and/or corporate culture.
The Fund may invest without limitation in securities quoted or denominated in currencies other than the U.S. dollar and may hold such currencies. The Fund does not expect to engage in
currency hedging and thus expects to be fully exposed to currency fluctuations relative to the U.S. dollar.
The bar chart and table below provide some indication of the risks of investing in the Fund by showing changes in the Fund’s annual total returns from year to year and by comparing the Fund’s average annual total returns with those of the Fund’s benchmark. Past performance (before and after taxes) is not an indication of future performance.
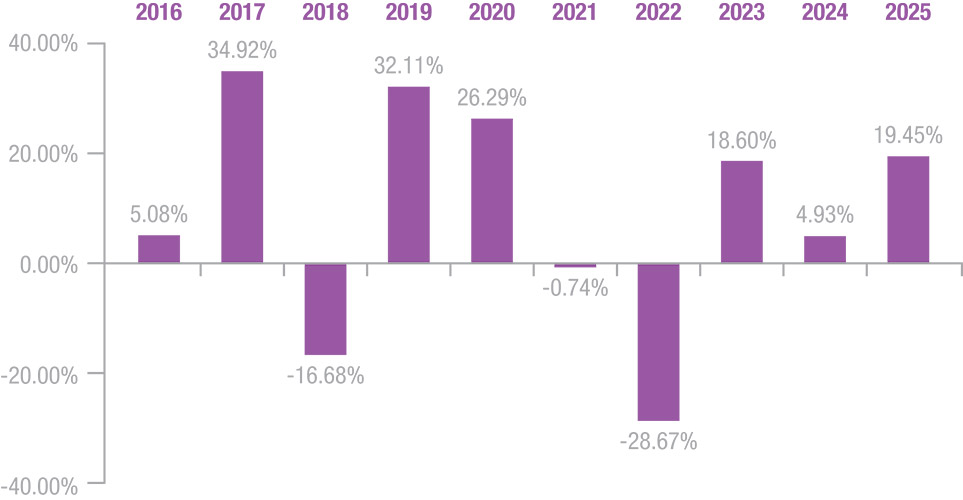
(1) | Performance for Institutional Class shares prior to their date of inception (April 28, 2017) is derived from the historical performance of Class 2 shares, which are not offered under this Prospectus and are currently closed to new investors. The historical Class 2 performance has been adjusted for the higher total annual operating expenses incurred by Institutional Class. |
Highest Quarterly Return: 25.58% (Q2, 2020)
Lowest Quarterly Return: ‑20.84% (Q1, 2020)
In the table below, after-tax returns are calculated using the historical highest individual federal marginal income tax rates and do not reflect the impact of state and local taxes. After-tax returns are shown for Institutional Class shares only, and after-tax returns for other share classes will vary. Actual after-tax returns depend on your tax situation and may differ from those shown. After-tax returns shown are not relevant if you are tax-exempt or if you hold your Fund shares through a tax-advantaged account. A description of the Fund’s comparative index and details regarding the calculation of the Fund’s class-by-class performance are provided in the section of the Prospectus entitled “Additional Performance Information.”
Average Annual Total | 1 Year | 5 Years | 10 Years | |||
Institutional Class Returns Before | 19.45% | 1.02% | 7.59% | |||
Institutional Class Returns After | 16.73% | 0.03% | 6.56% | |||
Institutional Class Returns After | 14.12% | 0.91% | 6.15% | |||
Class K Returns Before Taxes | 19.59% | 1.10% | 7.67% | |||
Comparative Index | ||||||
MSCI ACWI ex USA Index(2) | 33.11% | 8.45% | 8.94% | |||
(1) | Performance for Class K and Institutional Class shares prior to their date of inception (April 28, 2017) is derived from the historical performance of Class 2 shares and, for Institutional Class, has been adjusted for the higher total annual operating expenses incurred by Institutional Class. |
(2) | The source of the index data is MSCI Inc. MSCI makes no express or implied warranties or representations and shall have no liability whatsoever with respect to any MSCI data contained herein. The MSCI data may not be further redistributed or used as a basis for other indexes or any securities or financial products. This Prospectus is not approved, endorsed, reviewed or produced by MSCI. None of the MSCI data is intended to constitute investment advice or a recommendation to make (or refrain from making) any kind of investment decision and may not be relied on as such. |
Updated information on the Fund’s investment performance can be obtained by visiting http://USmutualfund.bailliegifford.com.