Performance Management - Ivy Variable Insurance Portfolios Classes - Standard and Service
Dec. 31, 2025
The
bar chart and table below provide some indication of the risks of investing in the Series. The bar chart shows changes in the Series’
performance from year
to year and the table shows how the Series’ average annual total returns for the 1-, 5-, and 10-year periods compare with those
of a broad measure of
market performance.
The
Series’ past performance is not necessarily an indication of how the Series will perform in the future.
The returns reflect
any expense caps in effect during these periods. The returns would be lower without the expense caps.
On April 30, 2021, Delaware
Management Company became the Series’ investment manager. The returns shown from before April 30, 2021 are from
the Series’ prior investment manager.
You may obtain the Series’
most recently available month-end performance by calling 800
523-1918
or by visiting our website at nomuraassetmanagement.com/vip-performance.
Performance reflects all
Series expenses but does not include any fees or sales charges imposed by variable insurance contracts. If they had been included,
the returns shown below would be lower. Investors should consult the variable contract prospectus for more information.
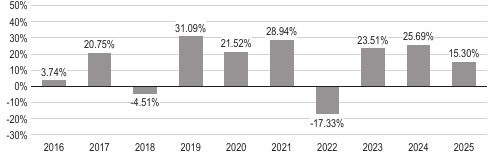
During the periods illustrated in this bar
chart, Service Class’s highest
quarterly return was
20.25%
for the quarter ended June
30, 2020, and
its lowest
quarterly return was
-17.87%
for the quarter ended March
31, 2020.
|
|
1
year |
5
years |
10
years |
|
Service
Class...........................................................
|
15.30%
|
13.79%
|
13.78%
|
|
S&P
500®
Index (reflects
no deduction for fees, expenses, or taxes)....................
|
17.88%
|
14.42%
|
14.82%
|
The
bar chart and table below provide some indication of the risks of investing in the Series. The bar chart shows changes in the Series’
performance from year
to year and the table shows how the Series’ average annual total returns for the 1-, 5-, and 10-year periods compare with those
of a broad measure of
market performance and
an additional index with characteristics relevant to the Series.
The
Series’ past performance is not necessarily an
indication of how the Series will perform in the future.
The returns reflect any expense caps in effect during these periods. The returns would be lower
without the expense caps.
On April 30, 2021, Delaware
Management Company became the Series’ investment manager. The returns shown from before April 30, 2021 are from
the Series’ prior investment manager.
You may obtain the Series’
most recently available month-end performance by calling 800
523-1918
or by visiting our website at nomuraassetmanagement.com/vip-performance.
Performance reflects all Series expenses but
does not include any fees or sales charges imposed by variable insurance contracts. If they had been included,
the returns shown below would be lower. Investors should consult the variable contract prospectus for more information.
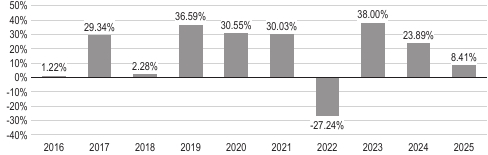
During the periods illustrated in this bar
chart, Service Class’s highest
quarterly return was
25.41%
for the quarter ended June
30, 2020, and
its lowest
quarterly return was
-19.68%
for the quarter ended June
30, 2022.
|
|
1
year |
5
years |
10
years |
|
Service
Class...........................................................
|
8.41%
|
11.89%
|
15.40%
|
|
Russell
1000®
Index (reflects
no deduction for fees, expenses, or taxes).................
|
17.37%
|
13.59%
|
14.59%
|
|
Russell
1000®
Growth Index (reflects no deduction for fees, expenses, or taxes)...........
|
18.56%
|
15.32%
|
18.13%
|
The
bar chart and table below provide some indication of the risks of investing in the Series. The bar chart shows changes in the Series’
performance from year
to year and the table shows how the Series’ average annual total returns for the 1-, 5-, and 10-year or lifetime periods compare
with those of a broad
measure of market performance and
an additional index with characteristics relevant to the Series.
The
Series’ past performance is not necessarily
an indication of how the Series will perform in the future.
The returns reflect any expense caps in effect during these periods. The returns would
be lower without the expense caps.
On April 30, 2021, Delaware
Management Company became the Series’ investment manager. The returns shown from before April 30, 2021 are from
the Series’ prior investment manager.
You may obtain the Series’
most recently available month-end performance by calling 800
523-1918
or by visiting our website at nomuraassetmanagement.com/vip-performance.
Performance reflects all Series expenses but
does not include any fees or sales charges imposed by variable insurance contracts. If they had been included,
the returns shown below would be lower. Investors should consult the variable contract prospectus for more information.
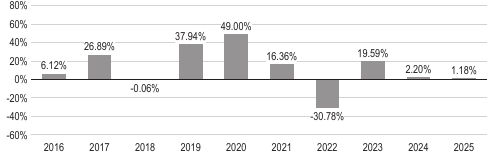
During the periods illustrated in this bar
chart, Service Class’s highest
quarterly return was
37.22%
for the quarter ended June
30, 2020, and
its lowest
quarterly return was
-21.86%
for the quarter ended June
30, 2022.
|
|
1
year |
5
years |
10
years or lifetime
|
|
Service
Class...........................................................
|
1.18%
|
-0.08%
|
10.66%
|
|
Standard
Class (lifetime: 4/28/17-12/31/25)......................................
|
1.38%
|
0.16%
|
10.77%
|
|
Russell
3000®
Index (reflects
no deduction for fees, expenses, or taxes).................
|
17.15%
|
13.15%
|
14.29%
|
|
Russell
Midcap®
Growth Index (reflects no deduction for fees, expenses, or taxes)..........
|
8.66%
|
6.65%
|
12.49%
|
The
bar chart and table below provide some indication of the risks of investing in the Series. The bar chart shows changes in the Series’
performance from year
to year and the table shows how the Series’ average annual total returns for the 1-, 5-, and 10-year periods compare with those
of a broad measure of
market performance and
an additional index with characteristics relevant to the Series.
The
Series’ past performance is not necessarily an
indication of how the Series will perform in the future.
The returns reflect any expense caps in effect during these periods. The returns would be lower
without the expense caps.
Effective April 28, 2017, the Series changed
its name and strategy to reflect a greater emphasis on core style companies. Performance prior to April 28,
2017 reflects the Series’ former strategy and may have differed if the Series’ current strategy had been in place.
On April 30, 2021, Delaware
Management Company became the Series’ investment manager. The returns shown from before April 30, 2021 are from
the Series’ prior investment manager.
Effective November 15, 2021, the Series changed
its investment strategy. Performance prior to November 15, 2021 reflects the Series’ former strategy;
its performance may have differed if the Series’ current strategy had been in place.
You may obtain the Series’
most recently available month-end performance by calling 800
523-1918
or by visiting our website at nomuraassetmanagement.com/vip-performance.
Performance reflects all Series expenses but
does not include any fees or sales charges imposed by variable insurance contracts. If they had been included,
the returns shown below would be lower. Investors should consult the variable contract prospectus for more information.
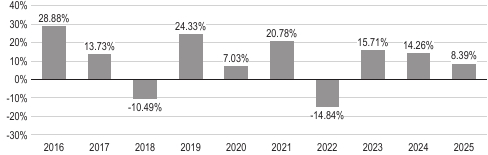
During the periods illustrated in this bar
chart, Service Class’s highest
quarterly return was
26.96%
for the quarter ended December
31, 2020, and
its lowest
quarterly return was
-29.04%
for the quarter ended March
31, 2020.
|
|
1
year |
5
years |
10
years |
|
Service
Class...........................................................
|
8.39%
|
8.07%
|
9.91%
|
|
Russell
3000®
Index (reflects
no deduction for fees, expenses, or taxes).................
|
17.15%
|
13.15%
|
14.29%
|
|
Russell
2500™ Index (reflects no deduction for fees, expenses, or taxes)................
|
11.91%
|
7.26%
|
10.40%
|
The
bar chart and table below provide some indication of the risks of investing in the Series. The bar chart shows changes in the Series’
performance from year
to year and the table shows how the Series’ average annual total returns for the 1-, 5-, and 10-year or lifetime periods compare
with those of a broad
measure of market performance and
an additional index with characteristics relevant to the Series.
The
Series’ past performance is not necessarily
an indication of how the Series will perform in the future.
The returns reflect any expense caps in effect during these periods. The returns would
be lower without the expense caps.
On April 30, 2021, Delaware
Management Company became the Series’ investment manager. The returns shown from before April 30, 2021 are from
the Series’ prior investment manager.
You may obtain the Series’
most recently available month-end performance by calling 800
523-1918
or by visiting our website at nomuraassetmanagement.com/vip-performance.
Performance reflects all
Series expenses but does not include any fees or sales charges imposed by variable insurance contracts. If they had been included,
the returns shown below would be lower. Investors should consult the variable contract prospectus for more information.
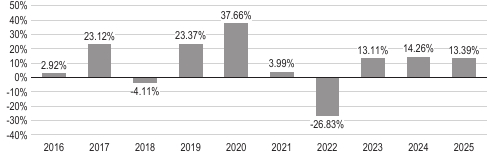
During the periods illustrated in this bar
chart, Service Class’s highest
quarterly return was
27.15%
for the quarter ended June
30, 2020, and
its lowest
quarterly return was
-21.59%
for the quarter ended March
31, 2020.
|
|
1
year |
5
years |
10
years or
lifetime |
|
Service
Class...........................................................
|
13.39%
|
2.20%
|
8.69%
|
|
Standard
Class (lifetime: 11/2/18-12/31/25)......................................
|
13.73%
|
2.47%
|
7.62%
|
|
Russell
3000®
Index (reflects
no deduction for fees, expenses, or taxes).................
|
17.15%
|
13.15%
|
14.29%
|
|
Russell
2000®
Growth Index (reflects no deduction for fees, expenses, or taxes)...........
|
13.01%
|
3.18%
|
9.57%
|
The
bar chart and table below provide some indication of the risks of investing in the Series. The bar chart shows changes in the Series’
performance from year
to year and the table shows how the Series’ average annual total returns for the 1-, 5-, and 10-year periods compare with those
of a broad measure of
market performance and an additional index with characteristics relevant to the Series. The
Series’ past performance is not necessarily an
indication of how the Series will perform in the future.
The returns reflect any expense caps in effect during these periods. The returns would be lower
without the expense caps.
On April 30, 2021, Delaware
Management Company became the Series’ investment manager. The returns shown from before April 30, 2021 are from
the Series’ prior investment manager.
You may obtain the Series’
most recently available month-end performance by calling 800
523-1918
or by visiting our website at nomuraassetmanagement.com/vip-performance.
Performance reflects all
Series expenses but does not include any fees or sales charges imposed by variable insurance contracts. If they had been included,
the returns shown below would be lower. Investors should consult the variable contract prospectus for more information.
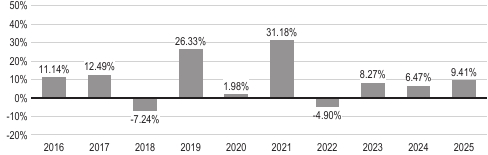
During the periods illustrated in this bar
chart, Service Class’s highest
quarterly return was
18.82%
for the quarter ended December
31, 2020, and
its lowest
quarterly return was
-29.30%
for the quarter ended March
31, 2020.
|
|
1
year |
5
years |
10
years |
|
Service
Class...........................................................
|
9.41%
|
9.49%
|
8.92%
|
|
Russell
1000®
Index (reflects
no deduction for fees, expenses, or taxes).................
|
17.37%
|
13.59%
|
14.59%
|
|
Russell
1000®
Value Index (reflects no deduction for fees, expenses, or taxes).............
|
15.91%
|
11.33%
|
10.53%
|
The
bar chart and table below provide some indication of the risks of investing in the Series. The bar chart shows changes in the Series’
performance from year
to year and the table shows how the Series’ average annual total returns for the 1-, 5-, and 10-year periods compare with those
of a broad measure of
market performance and an additional index with characteristics relevant to the Series. The
Series’ past performance is not necessarily an
indication of how the Series will perform in the future.
The returns reflect any expense caps in effect during these periods. The returns would be lower
without the expense caps.
Effective April 30, 2018,
the Series changed its name and strategy to reflect a focus on corporate bonds, rather than in bonds generally. Performance prior
to April 30, 2018 reflects the Series’ former strategy and may have differed if the Series’ current strategy had been in
place.
On April 30, 2021, the
Series became part of the Nomura Funds and Delaware Management Company became the Series’ investment manager. The returns
shown from before April 30, 2021 are from the Series’ prior investment manager.
Effective November 15,
2021, the Series changed its investment strategy. Performance prior to November 15, 2021 reflects the Series’ former strategy;
its performance may have differed if the Series’ current strategy had been in place.
You may obtain the Series’
most recently available month-end performance by calling 800
523-1918
or by visiting our website at nomuraassetmanagement.com/vip-performance.
Performance reflects all
Series expenses but does not include any fees or sales charges imposed by variable insurance contracts. If they had been included,
the returns shown below would be lower. Investors should consult the variable contract prospectus for more information.
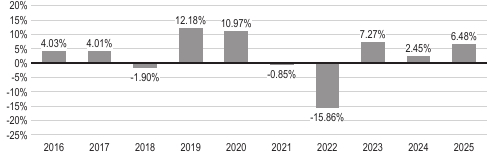
During the periods illustrated in this bar
chart, Service Class’s highest
quarterly return was
9.53%
for the quarter ended June
30, 2020, and
its lowest
quarterly return
was
-7.47%
for the quarter ended June
30, 2022.
|
|
1
year |
5
years |
10
years |
|
Service
Class...........................................................
|
6.48%
|
-0.48%
|
2.58%
|
|
Bloomberg
US Aggregate Index (reflects
no deduction for fees, expenses, or taxes).........
|
7.30%
|
-0.36%
|
2.01%
|
|
Bloomberg
US Corporate Bond Index (reflects no deduction for fees, expenses, or taxes).....
|
7.77%
|
-0.09%
|
3.27%
|
The
bar chart and table below provide some indication of the risks of investing in the Series. The bar chart shows changes in the Series’
performance from year
to year and the table shows how the Series’ average annual total returns for the 1-, 5-, and 10-year or lifetime periods compare
with those of a broad
measure of market performance and
an additional index with characteristics relevant to the Series.
The
Series’ past performance is not necessarily
an indication of how the Series will perform in the future.
The returns reflect any expense caps in effect during these periods. The returns would
be lower without the expense caps.
On April 30, 2021, Delaware
Management Company became the Series’ investment manager. The returns shown from before April 30, 2021 are from
the Series’ prior investment manager.
Effective November 15, 2021, the Series changed
its investment strategy. Performance prior to November 15, 2021 reflects the Series’ former strategy;
its performance may have differed if the Series’ current strategy had been in place.
You may obtain the Series’
most recently available month-end performance by calling 800
523-1918
or by visiting our website at nomuraassetmanagement.com/vip-performance.
Performance reflects all Series expenses but
does not include any fees or sales charges imposed by variable insurance contracts. If they had been included,
the returns shown below would be lower. Investors should consult the variable contract prospectus for more information.
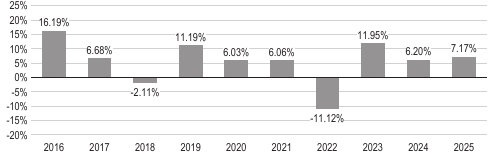
During the periods illustrated in this bar
chart, Service Class’s highest
quarterly return was
8.56%
for the quarter ended June
30, 2020, and
its lowest
quarterly return
was
-14.50%
for the quarter ended March
31, 2020.
|
|
1
year |
5
years |
10
years or
lifetime |
|
Service
Class...........................................................
|
7.17%
|
3.73%
|
5.56%
|
|
Standard
Class (lifetime: 4/28/17-12/31/25)......................................
|
7.41%
|
3.98%
|
4.47%
|
|
Bloomberg
US Aggregate Index (reflects
no deduction for fees, expenses, or taxes).........
|
7.30%
|
-0.36%
|
2.01%
|
|
ICE
BofA US High Yield Constrained Index (reflects no deduction for fees, expenses, or taxes).
|
8.50%
|
4.50%
|
6.44%
|
The
bar chart and table below provide some indication of the risks of investing in the Series. The bar chart shows changes in the Series’
performance from year
to year and the table shows how the Series’ average annual total returns for the 1-, 5-, and 10-year periods compare with those
of a broad measure of
market performance and
an additional index with characteristics relevant to the Series.
The
Series’ past performance is not necessarily an
indication of how the Series will perform in the future.
The returns reflect any expense caps in effect during these periods. The returns would be lower
without the expense caps.
On April 30, 2021, Delaware
Management Company became the Series’ investment manager. The returns shown from before April 30, 2021 are from
the Series’ prior investment manager.
Effective November 15, 2021, the Series changed
its investment strategy. Performance prior to November 15, 2021 reflects the Series’ former strategy;
its performance may have differed if the Series’ current strategy had been in place.
You may obtain the Series’
most recently available month-end performance by calling 800
523-1918
or by visiting our website at nomuraassetmanagement.com/vip-performance.
Performance reflects all Series expenses but
does not include any fees or sales charges imposed by variable insurance contracts. If they had been included,
the returns shown below would be lower. Investors should consult the variable contract prospectus for more information.
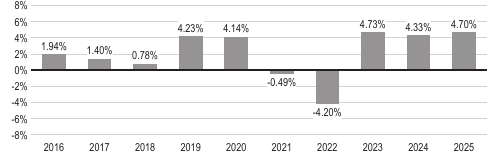
During the periods illustrated in this bar
chart, Service Class’s highest
quarterly return was
3.06%
for the quarter ended December
31, 2023, and
its lowest
quarterly return was
-2.70%
for the quarter ended March
31, 2022.
|
|
1
year |
5
years |
10
years |
|
Service
Class...........................................................
|
4.70%
|
1.75%
|
2.12%
|
|
Bloomberg
US Aggregate Index (reflects
no deduction for fees, expenses, or taxes).........
|
7.30%
|
-0.36%
|
2.01%
|
|
Bloomberg
1-3 Year US Government/Credit Index (reflects no deduction for fees, expenses, or taxes)............................................................... |
5.35%
|
1.97%
|
2.09%
|
The
bar chart and table below provide some indication of the risks of investing in the Series. The bar chart shows changes in the Series’
performance from year
to year and the table shows how the Series’ average annual total returns for the 1-, 5-, and 10-year periods compare with those
of a broad measure of
market performance.
The
Series’ past performance is not necessarily an indication of how the Series will perform in the future.
The returns reflect
any expense caps in effect during these periods. The returns would be lower without the expense caps.
On April 30, 2021, Delaware
Management Company became the Series’ investment manager. The returns shown from before April 30, 2021 are from
the Series’ prior investment manager.
Effective November 15, 2021, the Series changed
its investment strategy. Performance prior to November 15, 2021 reflects the Series’ former strategy;
its performance may have differed if the Series’ current strategy had been in place.
You may obtain the Series’
most recently available month-end performance by calling 800
523-1918
or by visiting our website at nomuraassetmanagement.com/vip-performance.
Performance reflects all Series expenses but
does not include any fees or sales charges imposed by variable insurance contracts. If they had been included,
the returns shown below would be lower. Investors should consult the variable contract prospectus for more information.
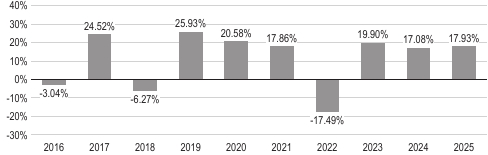
During the periods illustrated in this bar
chart, Service Class’s highest
quarterly return was
22.38%
for the quarter ended June
30, 2020, and
its lowest
quarterly return was
-20.55%
for the quarter ended March
31, 2020.
|
|
1
year |
5
years |
10
years |
|
Service
Class...........................................................
|
17.93%
|
9.99%
|
10.71%
|
|
MSCI
ACWI (All Country World Index) (net) (reflects
no deduction for fees or expenses)......
|
22.34%
|
11.19%
|
11.72%
|
|
MSCI
ACWI (All Country World Index) (gross) (reflects no deduction for fees, expenses, or taxes)............................................................... |
22.87%
|
11.70%
|
12.28%
|
The
bar chart and table below provide some indication of the risks of investing in the Series. The bar chart shows changes in the Series’
performance from year
to year and the table shows how the Series’ average annual total returns for the 1-, 5-, and 10-year periods compare with those
of a broad measure of
market performance.
The
Series’ past performance is not necessarily an indication of how the Series will perform in the future.
The returns reflect
any expense caps in effect during these periods. The returns would be lower without the expense caps.
On April 30, 2021, Delaware
Management Company became the Series’ investment manager. The returns shown from before April 30, 2021 are from
the Series’ prior investment manager.
Effective November 15, 2021, the Series changed
its investment strategy. Performance prior to November 15, 2021 reflects the Series’ former strategy;
its performance may have differed if the Series’ current strategy had been in place.
You may obtain the Series’
most recently available month-end performance by calling 800
523-1918
or by visiting our website at nomuraassetmanagement.com/vip-performance.
Performance reflects all Series expenses but
does not include any fees or sales charges imposed by variable insurance contracts. If they had been included,
the returns shown below would be lower. Investors should consult the variable contract prospectus for more information.
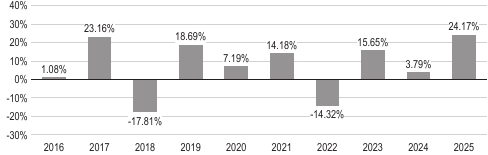
During the periods illustrated in this bar
chart, Service Class’s highest
quarterly return was
18.89%
for the quarter ended December
31, 2022, and
its lowest
quarterly return was
-24.54%
for the quarter ended March
31, 2020.
|
|
1
year |
5
years |
10
years |
|
Service
Class...........................................................
|
24.17%
|
7.83%
|
6.62%
|
|
Standard
Class (lifetime): 3/28/24-12/31/25......................................
|
24.55%
|
n/a
|
12.07%
|
|
MSCI
ACWI (All Country World Index) ex USA (net) (reflects
no deduction for fees or expenses)............................................................ |
32.39%
|
7.91%
|
8.41%
|
|
MSCI
ACWI (All Country World Index) ex USA (gross) (reflects no deduction for fees, expenses, or taxes)...................................................... |
33.11%
|
8.46%
|
8.95%
|
The
bar chart and table below provide some indication of the risks of investing in the Series. The bar chart shows changes in the Series’
performance from year
to year and the table shows how the Series’ average annual total returns for the 1-, 5-, and 10-year or lifetime periods compare
with those of a broad
measure of market performance.
The
Series’ past performance is not necessarily an indication of how the Series will perform in the future.
The returns reflect
any expense caps in effect during these periods. The returns would be lower without the expense caps.
On April 30, 2021, Delaware
Management Company became the Series’ investment manager. The returns shown from before April 30, 2021 are from
the Series’ prior investment manager.
Effective November 15, 2021, the Series changed
its investment strategy. Performance prior to November 15, 2021 reflects the Series’ former strategy;
its performance may have differed if the Series’ current strategy had been in place.
You may obtain the Series’
most recently available month-end performance by calling 800
523-1918
or by visiting our website at nomuraassetmanagement.com/vip-performance.
Performance reflects all Series expenses but
does not include any fees or sales charges imposed by variable insurance contracts. If they had been included,
the returns shown below would be lower. Investors should consult the variable contract prospectus for more information.
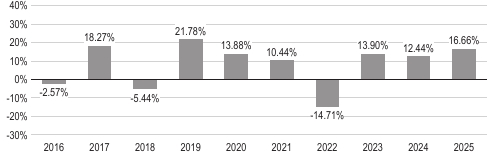
During the periods illustrated in this bar
chart, Service Class’s highest
quarterly return was
17.70%
for the quarter ended June
30, 2020, and
its lowest
quarterly return was
-19.16%
for the quarter ended March
31, 2020.
|
|
1
year |
5
years |
10
years or
lifetime |
|
Service
Class...........................................................
|
16.66%
|
7.07%
|
7.84%
|
|
Standard
Class (lifetime: 4/28/17-12/31/25)......................................
|
16.87%
|
7.33%
|
8.88%
|
|
MSCI
ACWI (All Country World Index) (gross) (reflects
no deduction for fees, expenses, or taxes)............................................................... |
22.87%
|
11.70%
|
12.28%
|
|
MSCI
ACWI (All Country World Index) (net) (reflects no deduction for fees or expenses)......
|
22.34%
|
11.19%
|
11.72%
|
The
bar chart and table below provide some indication of the risks of investing in the Series. The bar chart shows changes in the Series’
performance from year
to year and the table shows how the Series’ average annual total returns for the 1-, 5-, and 10-year periods compare with those
of broad measures of
market performance.
The
Series’ past performance is not necessarily an indication of how the Series will perform in the future.
The returns reflect
any expense caps in effect during these periods. The returns would be lower without the expense caps.
On April 30, 2021, Delaware
Management Company became the Series’ investment manager. The returns shown from before April 30, 2021 are from
the Series’ prior investment manager.
Effective November 15, 2021, the Series changed
its investment strategy. Performance prior to November 15, 2021 reflects the Series’ former strategy;
its performance may have differed if the Series’ current strategy had been in place.
You may obtain the Series’
most recently available month-end performance by calling 800
523-1918
or by visiting our website at nomuraassetmanagement.com/vip-performance.
Performance reflects all Series expenses but
does not include any fees or sales charges imposed by variable insurance contracts. If they had been included,
the returns shown below would be lower. Investors should consult the variable contract prospectus for more information.
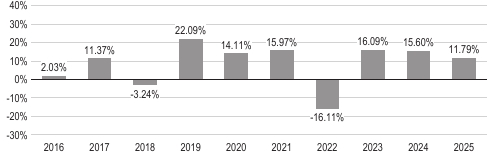
During the periods illustrated in this bar
chart, Service Class’s highest
quarterly return was
15.52%
for the quarter ended June
30, 2020, and
its lowest
quarterly return was
-16.23%
for the quarter ended March
31, 2020.
|
|
1
year |
5
years |
10
years |
|
Service
Class...........................................................
|
11.79%
|
7.85%
|
8.38%
|
|
S&P
500®
Index (reflects
no deduction for fees, expenses, or taxes)....................
|
17.88%
|
14.42%
|
14.82%
|
|
Bloomberg
US Aggregate Index (reflects no deduction for fees, expenses, or taxes).........
|
7.30%
|
-0.36%
|
2.01%
|
The
bar chart and table below provide some indication of the risks of investing in the Series. The bar chart shows changes in the Series’
performance from year
to year and the table shows how the Series’ average annual total returns for the 1-, 5-, and 10-year or lifetime periods compare
with those of a broad
measure of market performance and
an additional index with characteristics relevant to the Series.
The
Series’ past performance is not necessarily
an indication of how the Series will perform in the future.
The returns reflect any expense caps in effect during these periods. The returns would
be lower without the expense caps.
On April 30, 2021, Delaware
Management Company became the Series’ investment manager. The returns shown from before April 30, 2021 are from
the Series’ prior investment manager.
Effective November 15, 2021, the Series changed
its investment strategy. Performance prior to November 15, 2021 reflects the Series’ former strategy;
its performance may have differed if the Series’ current strategy had been in place.
You may obtain the Series’
most recently available month-end performance by calling 800
523-1918
or by visiting our website at nomuraassetmanagement.com/vip-performance.
Performance reflects all Series expenses but
does not include any fees or sales charges imposed by variable insurance contracts. If they had been included,
the returns shown below would be lower. Investors should consult the variable contract prospectus for more information.
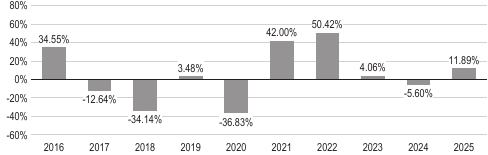
During the periods illustrated in this bar
chart, Service Class’s highest
quarterly return was
37.65%
for the quarter ended December
31, 2020, and
its lowest
quarterly return was
-59.78%
for the quarter ended March
31, 2020.
|
|
1
year |
5
years |
10
years or
lifetime |
|
Service
Class...........................................................
|
11.89%
|
18.61%
|
1.74%
|
|
Standard
Class (lifetime: 4/28/17-12/31/25)......................................
|
12.41%
|
18.94%
|
0.55%
|
|
S&P
500 Index (reflects
no deduction for fees, expenses, or taxes).....................
|
17.88%
|
14.42%
|
14.82%
|
|
S&P
1500 Energy Sector Index (reflects no deduction for fees, expenses, or taxes).........
|
7.69%
|
23.58%
|
7.77%
|
The
bar chart and table below provide some indication of the risks of investing in the Series. The bar chart shows changes in the Series’
performance from year
to year and the table shows how the Series’ average annual total returns for the 1-, 5-, and 10-year periods compare with those
of a broad measure of
market performance and an additional index with characteristics relevant to the Series.
The
Series’ past performance is not necessarily an
indication of how the Series will perform in the future.
The returns reflect any expense caps in effect during these periods. The returns would be lower
without the expense caps.
Waddell & Reed Investment
Management Company (WRIMCO) served as the Series’ investment adviser until October 1, 2016, when Ivy Investment Management
Company, an affiliate of WRIMCO, became the Series’ investment adviser. On April 30, 2021, Delaware Management Company became
the Series’ investment manager. The returns shown from before April 30, 2021 are from the Series’ prior investment managers.
Effective November 15,
2021, the Series changed its investment strategy. Performance prior to November 15, 2021 reflects the Series’ former strategy;
its performance may have differed if the Series’ current strategy had been in place.
You may obtain the Series’
most recently available month-end performance by calling 800
523-1918
or by visiting our website at nomuraassetmanagement.com/vip-performance.
Performance reflects all Series expenses but
does not include any fees or sales charges imposed by variable insurance contracts. If they had been included,
the returns shown below would be lower. Investors should consult the variable contract prospectus for more information.
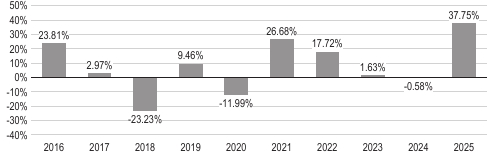
During the periods illustrated in this bar
chart, Service Class’s highest
quarterly return was
25.22%
for the quarter ended June
30, 2020, and
its lowest
quarterly return was
-38.30%
for the quarter ended March
31, 2020.
|
|
1
year |
5
years |
10
years |
|
Service
Class...........................................................
|
37.75%
|
15.73%
|
6.94%
|
|
S&P
500 Index (reflects
no deduction for fees, expenses, or taxes).....................
|
17.88%
|
14.42%
|
14.82%
|
|
S&P
Global Natural Resources Index (reflects no deduction for fees, expenses, or taxes).....
|
28.86%
|
10.60%
|
10.38%
|
The
bar chart and table below provide some indication of the risks of investing in the Series. The bar chart shows changes in the Series’
performance from year
to year and the table shows how the Series’ average annual total returns for the 1-, 5-, and 10-year or lifetime periods compare
with those of a broad
measure of market performance and
an additional index with characteristics relevant to the Series.
The
Series’ past performance is not necessarily
an indication of how the Series will perform in the future.
The returns reflect any expense caps in effect during these periods. The returns would
be lower without the expense caps.
On April 30, 2021, Delaware
Management Company became the Series’ investment manager. The returns shown from before April 30, 2021 are from
the Series’ prior investment manager.
You may obtain the Series’
most recently available month-end performance by calling 800
523-1918
or by visiting our website at nomuraassetmanagement.com/vip-performance.
Performance reflects all
Series expenses but does not include any fees or sales charges imposed by variable insurance contracts. If they had been included,
the returns shown below would be lower. Investors should consult the variable contract prospectus for more information.
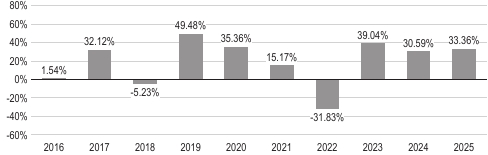
During the periods illustrated in this bar
chart, Service Class’s highest
quarterly return was
27.96%
for the quarter ended June
30, 2025, and
its lowest
quarterly return was
-23.42%
for the quarter ended June
30, 2022.
|
|
1
year |
5
years |
10
years or
lifetime |
|
Service
Class...........................................................
|
33.36%
|
13.71%
|
17.20%
|
|
Standard
Class (lifetime: 4/28/17-12/31/25)......................................
|
33.69%
|
13.99%
|
18.49%
|
|
S&P
500 Index (reflects
no deduction for fees, expenses, or taxes).....................
|
17.88%
|
14.42%
|
14.82%
|
|
S&P
North American Technology Sector Index (reflects no deduction for fees, expenses, or taxes)............................................................... |
27.82%
|
18.02%
|
22.54%
|
The
bar chart and table below provide some indication of the risks of investing in the Series. The bar chart shows changes in the Series’
performance from year
to year and the table shows how the Series’ average annual total returns for the 1-, 5-, and 10-year periods compare with those
of broad measures of
market performance and additional indexes with characteristics relevant to the Series.
The
Series’ past performance is not necessarily an
indication of how the Series will perform in the future.
The returns reflect any expense caps in effect during these periods. The returns would be lower
without the expense caps.
On April 30, 2021, Delaware
Management Company became the Series’ investment manager. The returns shown from before April 30, 2021 are from
the Series’ prior investment manager.
You may obtain the Series’
most recently available month-end performance by calling 800
523-1918
or by visiting our website at nomuraassetmanagement.com/vip-performance.
Performance reflects all
Series expenses but does not include any fees or sales charges imposed by variable insurance contracts. If they had been included,
the returns shown below would be lower. Investors should consult the variable contract prospectus for more information.
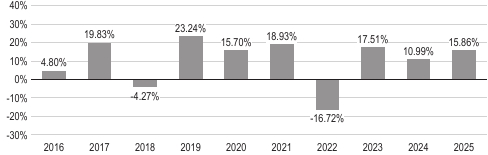
During the periods illustrated in this bar
chart, Service Class’s highest
quarterly return was
18.87%
for the quarter ended June
30, 2020, and
its lowest
quarterly return was
-18.62%
for the quarter ended March
31, 2020.
|
|
1
year |
5
years |
10
years |
|
Service
Class...........................................................
|
15.86%
|
8.40%
|
9.88%
|
|
S&P
500 Index (reflects
no deduction for fees, expenses, or taxes).....................
|
17.88%
|
14.42%
|
14.82%
|
|
Bloomberg
US Aggregate Index (reflects no deduction for fees, expenses, or taxes).........
|
7.30%
|
-0.36%
|
2.01%
|
|
Current
Blended Benchmark (reflects no deduction for fees, expenses, or taxes)*...........
|
19.90%
|
9.97%
|
10.89%
|
|
Russell
3000 Index (reflects no deduction for fees, expenses, or taxes)..................
|
17.15%
|
13.15%
|
14.29%
|
|
MSCI
EAFE Index (net) (reflects no deduction for fees or expenses)....................
|
31.22%
|
8.92%
|
8.18%
|
|
MSCI
EAFE Index (gross) (reflects no deduction for fees, expenses, or taxes).............
|
31.89%
|
9.47%
|
8.72%
|
|
Bloomberg
US Credit Index (reflects no deduction for fees, expenses, or taxes)............
|
7.83%
|
-0.05%
|
3.15%
|
The
bar chart and table below provide some indication of the risks of investing in the Series. The bar chart shows changes in the Series’
performance from year
to year and the table shows how the Series’ average annual total returns for the 1-, 5-, and 10-year periods compare with those
of broad measures of
market performance and additional indexes with characteristics relevant to the Series.
The
Series’ past performance is not necessarily an
indication of how the Series will perform in the future.
The returns reflect any expense caps in effect during these periods. The returns would be lower
without the expense caps.
On April 30, 2021, Delaware
Management Company became the Series’ investment manager. The returns shown from before April 30, 2021 are from
the Series’ prior investment manager.
You may obtain the Series’
most recently available month-end performance by calling 800
523-1918
or by visiting our website at nomuraassetmanagement.com/vip-performance.
Performance reflects all
Series expenses but does not include any fees or sales charges imposed by variable insurance contracts. If they had been included,
the returns shown below would be lower. Investors should consult the variable contract prospectus for more information.
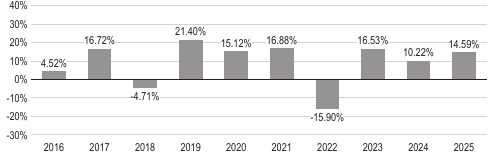
During the periods illustrated in this bar
chart, Service Class’s highest
quarterly return was
17.27%
for the quarter ended June
30, 2020, and
its lowest
quarterly return was
-16.61%
for the quarter ended March
31, 2020.
|
|
1
year |
5
years |
10
years |
|
Service
Class...........................................................
|
14.59%
|
7.67%
|
8.92%
|
|
S&P
500 Index (reflects
no deduction for fees, expenses, or taxes).....................
|
17.88%
|
14.42%
|
14.82%
|
|
Bloomberg
US Aggregate Index (reflects no deduction for fees, expenses, or taxes).........
|
7.30%
|
-0.36%
|
2.01%
|
|
Current
Blended Benchmark (reflects no deduction for fees, expenses, or taxes)*...........
|
18.11%
|
8.97%
|
10.05%
|
|
Russell
3000 Index (reflects no deduction for fees, expenses, or taxes)..................
|
17.15%
|
13.15%
|
14.29%
|
|
MSCI
EAFE Index (net) (reflects no deduction for fees or expenses)....................
|
31.22%
|
8.92%
|
8.18%
|
|
MSCI
EAFE Index (gross) (reflects no deduction for fees, expenses, or taxes).............
|
31.89%
|
9.47%
|
8.72%
|
|
Bloomberg
US Credit Index (reflects no deduction for fees, expenses, or taxes)............
|
7.83%
|
-0.05%
|
3.15%
|
|
Bloomberg
1-3 Year US Government/Credit Index (reflects no deduction for fees, expenses, or taxes)............................................................... |
5.35%
|
1.97%
|
2.09%
|
The
bar chart and table below provide some indication of the risks of investing in the Series. The bar chart shows changes in the Series’
performance from year
to year and the table shows how the Series’ average annual total returns for the 1-, 5-, and 10-year periods compare with those
of broad measures of
market performance and additional indexes with characteristics relevant to the Series.
The
Series’ past performance is not necessarily an
indication of how the Series will perform in the future.
The returns reflect any expense caps in effect during these periods. The returns would be lower
without the expense caps.
On April 30, 2021, Delaware
Management Company became the Series’ investment manager. The returns shown from before April 30, 2021 are from
the Series’ prior investment manager.
You may obtain the Series’
most recently available month-end performance by calling 800
523-1918
or by visiting our website at nomuraassetmanagement.com/vip-performance.
Performance reflects all
Series expenses but does not include any fees or sales charges imposed by variable insurance contracts. If they had been included,
the returns shown below would be lower. Investors should consult the variable contract prospectus for more information.
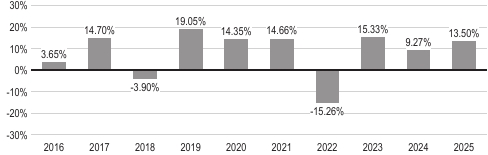
During the periods illustrated in this bar
chart, Service Class’s highest
quarterly return was
15.60%
for the quarter ended June
30, 2020, and
its lowest
quarterly return was
-14.48%
for the quarter ended March
31, 2020.
|
|
1
year |
5
years |
10
years |
|
Service
Class...........................................................
|
13.50%
|
6.81%
|
8.01%
|
|
S&P
500 Index (reflects
no deduction for fees, expenses, or taxes).....................
|
17.88%
|
14.42%
|
14.82%
|
|
Bloomberg
US Aggregate Index (reflects no deduction for fees, expenses, or taxes).........
|
7.30%
|
-0.36%
|
2.01%
|
|
Current
Blended Benchmark (reflects no deduction for fees, expenses, or taxes)*...........
|
16.35%
|
7.97%
|
9.21%
|
|
Russell
3000 Index (reflects no deduction for fees, expenses, or taxes)..................
|
17.15%
|
13.15%
|
14.29%
|
|
Bloomberg
US Credit Index (reflects no deduction for fees, expenses, or taxes)............
|
7.83%
|
-0.05%
|
3.15%
|
|
MSCI
EAFE Index (net) (reflects no deduction for fees or expenses)....................
|
31.22%
|
8.92%
|
8.18%
|
|
MSCI
EAFE Index (gross) (reflects no deduction for fees, expenses, or taxes).............
|
31.89%
|
9.47%
|
8.72%
|
|
Bloomberg
1-3 Year US Government/Credit Index (reflects no deduction for fees, expenses, or taxes)............................................................... |
5.35%
|
1.97%
|
2.09%
|
The
bar chart and table below provide some indication of the risks of investing in the Series. The bar chart shows changes in the Series’
performance from year
to year and the table shows how the Series’ average annual total returns for the 1-, 5-, and 10-year periods compare with those
of broad measures of
market performance and additional indexes with characteristics relevant to the Series.
The
Series’ past performance is not necessarily an
indication of how the Series will perform in the future.
The returns reflect any expense caps in effect during these periods. The returns would be lower
without the expense caps.
On April 30, 2021, Delaware
Management Company became the Series’ investment manager. The returns shown from before April 30, 2021 are from
the Series’ prior investment manager.
You may obtain the Series’
most recently available month-end performance by calling 800
523-1918
or by visiting our website at nomuraassetmanagement.com/vip-performance.
Performance reflects all
Series expenses but does not include any fees or sales charges imposed by variable insurance contracts. If they had been included,
the returns shown below would be lower. Investors should consult the variable contract prospectus for more information.
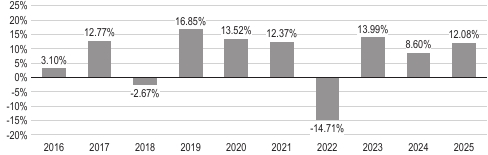
During the periods illustrated in this bar
chart, Service Class’s highest
quarterly return was
14.04%
for the quarter ended June
30, 2020, and
its lowest
quarterly return was
-12.43%
for the quarter ended March
31, 2020.
|
|
1
year |
5
years |
10
years |
|
Service
Class...........................................................
|
12.08%
|
5.87%
|
7.16%
|
|
S&P
500 Index (reflects
no deduction for fees, expenses, or taxes).....................
|
17.88%
|
14.42%
|
14.82%
|
|
Bloomberg
US Aggregate Index (reflects no deduction for fees, expenses, or taxes).........
|
7.30%
|
-0.36%
|
2.01%
|
|
Current
Blended Benchmark (reflects no deduction for fees, expenses, or taxes)*...........
|
14.60%
|
6.96%
|
8.35%
|
|
Russell
3000 Index (reflects no deduction for fees, expenses, or taxes)..................
|
17.15%
|
13.15%
|
14.29%
|
|
Bloomberg
US Credit Index (reflects no deduction for fees, expenses, or taxes)............
|
7.83%
|
-0.05%
|
3.15%
|
|
MSCI
EAFE Index (net) (reflects no deduction for fees or expenses)....................
|
31.22%
|
8.92%
|
8.18%
|
|
MSCI
EAFE Index (gross) (reflects no deduction for fees, expenses, or taxes).............
|
31.89%
|
9.47%
|
8.72%
|
|
Bloomberg
1-3 Year US Government/Credit Index (reflects no deduction for fees, expenses, or taxes)............................................................... |
5.35%
|
1.97%
|
2.09%
|
The
bar chart and table below provide some indication of the risks of investing in the Series. The bar chart shows changes in the Series’
performance from year
to year and the table shows how the Series’ average annual total returns for the 1-, 5-, and 10-year periods compare with those
of broad measures of
market performance and additional indexes with characteristics relevant to the Series.
The
Series’ past performance is not necessarily an
indication of how the Series will perform in the future.
The returns reflect any expense caps in effect during these periods. The returns would be lower
without the expense caps.
On April 30, 2021, Delaware
Management Company became the Series’ investment manager. The returns shown from before April 30, 2021 are from
the Series’ prior investment manager.
You may obtain the Series’
most recently available month-end performance by calling 800
523-1918
or by visiting our website at nomuraassetmanagement.com/vip-performance.
Performance reflects all
Series expenses but does not include any fees or sales charges imposed by variable insurance contracts. If they had been included,
the returns shown below would be lower. Investors should consult the variable contract prospectus for more information.
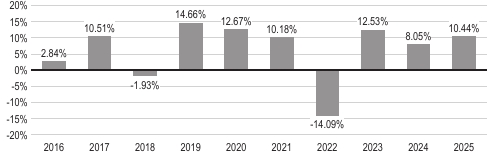
During the periods illustrated in this bar
chart, Service Class’s highest
quarterly return was
12.39%
for the quarter ended June
30, 2020, and
its lowest
quarterly return was
-10.22%
for the quarter ended March
31, 2020.
|
|
1
year |
5
years |
10
years |
|
Service
Class...........................................................
|
10.44%
|
4.91%
|
6.23%
|
|
S&P
500 Index (reflects
no deduction for fees, expenses, or taxes).....................
|
17.88%
|
14.42%
|
14.82%
|
|
Bloomberg
US Aggregate Index (reflects no deduction for fees, expenses, or taxes).........
|
7.30%
|
-0.36%
|
2.01%
|
|
Current
Blended Benchmark (reflects no deduction for fees, expenses, or taxes)*...........
|
12.86%
|
5.95%
|
7.49%
|
|
Russell
3000 Index (reflects no deduction for fees, expenses, or taxes)..................
|
17.15%
|
13.15%
|
14.29%
|
|
Bloomberg
US Credit Index (reflects no deduction for fees, expenses, or taxes)............
|
7.83%
|
-0.05%
|
3.15%
|
|
Bloomberg
1-3 Year US Government/Credit Index (reflects no deduction for fees, expenses, or taxes)............................................................... |
5.35%
|
1.97%
|
2.09%
|
|
MSCI
EAFE Index (net) (reflects no deduction for fees or expenses)....................
|
31.22%
|
8.92%
|
8.18%
|
|
MSCI
EAFE Index (gross) (reflects no deduction for fees, expenses, or taxes).............
|
31.89%
|
9.47%
|
8.72%
|
The
bar chart and table below provide some indication of the risks of investing in the Series. The bar chart shows changes in the Series’
performance from year
to year and the table shows how the Series’ average annual total returns for the 1-, 5-, and 10-year periods compare with those
of broad measures of
market performance and additional indexes with characteristics relevant to the Series.
The
Series’ past performance is not necessarily an
indication of how the Series will perform in the future.
The returns reflect any expense caps in effect during these periods. The returns would be lower
without the expense caps.
On April 30, 2021, Delaware
Management Company became the Series’ investment manager. The returns shown from before April 30, 2021 are from
the Series’ prior investment manager.
You may obtain the Series’
most recently available month-end performance by calling 800
523-1918
or by visiting our website at nomuraassetmanagement.com/vip-performance.
Performance reflects all
Series expenses but does not include any fees or sales charges imposed by variable insurance contracts. If they had been included,
the returns shown below would be lower. Investors should consult the variable contract prospectus for more information.
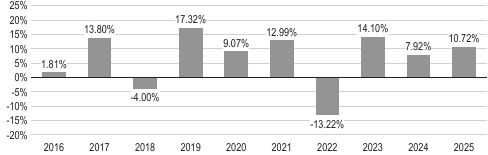
During the periods illustrated in this bar
chart, Service Class’s highest
quarterly return was
9.04%
for the quarter ended December
31, 2020, and
its lowest
quarterly return was
-11.06%
for the quarter ended March
31, 2020.
|
|
1
year |
5
years |
10
years |
|
Service
Class...........................................................
|
10.72%
|
5.98%
|
6.64%
|
|
S&P
500 Index (reflects
no deduction for fees, expenses, or taxes).....................
|
17.88%
|
14.42%
|
14.82%
|
|
Bloomberg
US Aggregate Index (reflects no deduction for fees, expenses, or taxes).........
|
7.30%
|
-0.36%
|
2.01%
|
|
Current
Blended Benchmark (reflects no deduction for fees, expenses, or taxes)*...........
|
16.35%
|
7.97%
|
9.21%
|
|
Russell
3000 Index (reflects no deduction for fees, expenses, or taxes)..................
|
17.15%
|
13.15%
|
14.29%
|
|
Bloomberg
US Credit Index (reflects no deduction for fees, expenses, or taxes)............
|
7.83%
|
-0.05%
|
3.15%
|
|
MSCI
EAFE Index (net) (reflects no deduction for fees or expenses)....................
|
31.22%
|
8.92%
|
8.18%
|
|
MSCI
EAFE Index (gross) (reflects no deduction for fees, expenses, or taxes).............
|
31.89%
|
9.47%
|
8.72%
|
|
Bloomberg
1-3 Year US Government/Credit Index (reflects no deduction for fees, expenses, or taxes)............................................................... |
5.35%
|
1.97%
|
2.09%
|
The
bar chart and table below provide some indication of the risks of investing in the Series. The bar chart shows changes in the Series’
performance from year
to year and the table shows how the Series’ average annual total returns for the 1-, 5-, and 10-year periods compare with those
of broad measures of
market performance and additional indexes with characteristics relevant to the Series.
The
Series’ past performance is not necessarily an
indication of how the Series will perform in the future.
The returns reflect any expense caps in effect during these periods. The returns would be lower
without the expense caps.
On April 30, 2021, Delaware
Management Company became the Series’ investment manager. The returns shown from before April 30, 2021 are from
the Series’ prior investment manager.
You may obtain the Series’
most recently available month-end performance by calling 800
523-1918
or by visiting our website at nomuraassetmanagement.com/vip-performance.
Performance reflects all
Series expenses but does not include any fees or sales charges imposed by variable insurance contracts. If they had been included,
the returns shown below would be lower. Investors should consult the variable contract prospectus for more information.
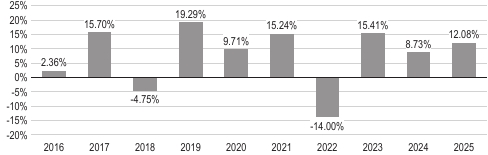
During the periods illustrated in this bar
chart, Service Class’s highest
quarterly return was
10.47%
for the quarter ended December
31, 2020, and
its lowest
quarterly return was
-13.29%
for the quarter ended March
31, 2020.
|
|
1
year |
5
years |
10
years |
|
Service
Class...........................................................
|
12.08%
|
6.87%
|
7.48%
|
|
S&P
500 Index (reflects
no deduction for fees, expenses, or taxes).....................
|
17.88%
|
14.42%
|
14.82%
|
|
Bloomberg
US Aggregate Index (reflects no deduction for fees, expenses, or taxes).........
|
7.30%
|
-0.36%
|
2.01%
|
|
Current
Blended Benchmark (reflects no deduction for fees, expenses, or taxes)*...........
|
18.11%
|
8.97%
|
10.05%
|
|
Russell
3000 Index (reflects no deduction for fees, expenses, or taxes)..................
|
17.15%
|
13.15%
|
14.29%
|
|
MSCI
EAFE Index (net) (reflects no deduction for fees or expenses)....................
|
31.22%
|
8.92%
|
8.18%
|
|
MSCI
EAFE Index (gross) (reflects no deduction for fees, expenses, or taxes).............
|
31.89%
|
9.47%
|
8.72%
|
|
Bloomberg
US Credit Index (reflects no deduction for fees, expenses, or taxes)............
|
7.83%
|
-0.05%
|
3.15%
|
|
Bloomberg
1-3 Year US Government/Credit Index (reflects no deduction for fees, expenses, or taxes)............................................................... |
5.35%
|
1.97%
|
2.09%
|
The
bar chart and table below provide some indication of the risks of investing in the Series. The bar chart shows changes in the Series’
performance from year
to year and the table shows how the Series’ average annual total returns for the 1-, 5-, and 10-year periods compare with those
of broad measures of
market performance and additional indexes with characteristics relevant to the Series.
The
Series’ past performance is not necessarily an
indication of how the Series will perform in the future.
The returns reflect any expense caps in effect during these periods. The returns would be lower
without the expense caps.
On April 30, 2021, Delaware
Management Company became the Series’ investment manager. The returns shown from before April 30, 2021 are from
the Series’ prior investment manager.
You may obtain the Series’
most recently available month-end performance by calling 800
523-1918
or by visiting our website at nomuraassetmanagement.com/vip-performance.
Performance reflects all
Series expenses but does not include any fees or sales charges imposed by variable insurance contracts. If they had been included,
the returns shown below would be lower. Investors should consult the variable contract prospectus for more information.
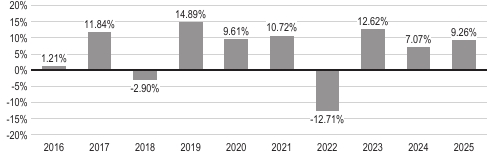
During the periods illustrated in this bar
chart, Service Class’s highest
quarterly return was
8.62%
for the quarter ended December
31, 2023, and
its lowest
quarterly return was
-8.68%
for the quarter ended March
31, 2020.
|
|
1
year |
5
years |
10
years |
|
Service
Class...........................................................
|
9.26%
|
4.95%
|
5.83%
|
|
S&P
500 Index (reflects
no deduction for fees, expenses, or taxes).....................
|
17.88%
|
14.42%
|
14.82%
|
|
Bloomberg
US Aggregate Index (reflects no deduction for fees, expenses, or taxes).........
|
7.30%
|
-0.36%
|
2.01%
|
|
Current
Blended Benchmark (reflects no deduction for fees, expenses, or taxes)*...........
|
14.60%
|
6.96%
|
8.35%
|
|
Russell
3000 Index (reflects no deduction for fees, expenses, or taxes)..................
|
17.15%
|
13.15%
|
14.29%
|
|
Bloomberg
US Credit Index (reflects no deduction for fees, expenses, or taxes)............
|
7.83%
|
-0.05%
|
3.15%
|
|
MSCI
EAFE Index (net) (reflects no deduction for fees or expenses)....................
|
31.22%
|
8.92%
|
8.18%
|
|
MSCI
EAFE Index (gross) (reflects no deduction for fees, expenses, or taxes).............
|
31.89%
|
9.47%
|
8.72%
|
|
Bloomberg
1-3 Year US Government/Credit Index (reflects no deduction for fees, expenses, or taxes)............................................................... |
5.35%
|
1.97%
|
2.09%
|
| [1] |
|
||
| [2] |
|
||
| [3] |
|
||
| [4] |
|
||
| [5] |
|
||
| [6] |
|
||
| [7] |
|
||
| [8] |
|
||
| [9] |
|
||
| [10] |
|
||
| [11] |
|
||
| [12] |
|
||
| [13] |
|
||
| [14] |
|
||
| [15] |
|
||
| [16] |
|
||
| [17] |
|
||
| [18] |
|
||
| [19] |
|
||
| [20] |
|
||
| [21] |
|