Performance Management - American Beacon Select Funds - American Beacon U.S. Government Money Market Select Fund
Dec. 31, 2025
The bar chart and table below provide an indication of risk by showing changes in the Fund’s performance over time. The bar chart shows how the Fund’s performance has varied from year to year. The table shows how the Fund’s average annual total returns compare to a broad-based securities market index, as well as an additional index with characteristics that are similar to those of the Fund, for the periods indicated. Prior to April 29, 2016, the Fund invested in certain types of securities that are no longer generally permitted for “government money market funds,” as currently defined in Rule 2a-7 under the Investment Company Act. Consequently, the performance shown below may have been different if the current limitation on the Fund’s investments had been in effect. Past performance is not necessarily an indication of how the Fund will perform in the future. You may call 1-800-658-5811 or visit the Fund’s website at www.americanbeaconfunds.com to obtain the Fund’s current seven-day yield.
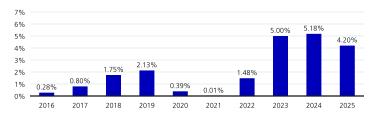
Highest
Quarterly Return:
1.32% 4th Quarter 2023
01/01/2016 through 12/31/2025
1.32% 4th Quarter 2023
01/01/2016 through 12/31/2025
Lowest
Quarterly Return:
0.00% First Occurred in 1st Quarter 2021
01/01/2016 through 12/31/2025
0.00% First Occurred in 1st Quarter 2021
01/01/2016 through 12/31/2025
|
|
1 Year
|
5 Years
|
10 Years
|
|
Shares (Before Taxes)
|
|
|
|
|
|
4.20%
|
3.15%
|
2.11%
|
|
|
|
1 Year
|
5 Years
|
10 Years
|
|
Index (Reflects no deduction for fees, expenses or taxes)
|
|
|
|
|
|
|
1 Year
|
5 Years
|
10 Years
|
|
Bloomberg US Aggregate Bond Index
|
|
7.30%
|
-0.36%
|
2.01%
|
|
Lipper Institutional U.S. Government Money Market Average
|
|
4.10%
|
3.04%
|
1.94%
|