Performance Management
|
May 01, 2026 |
| Conservative Allocation Fund |
|
| Prospectus [Line Items] |
|
| Bar Chart and Performance Table [Heading] |
Performance
|
| Performance Narrative [Text Block] |
The
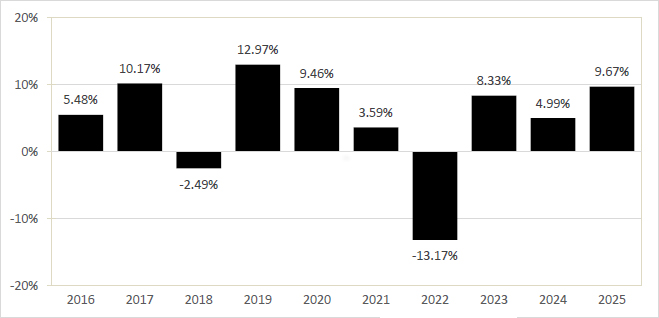
following bar chart and table provide some indication of the risks of investing in the Fund. The bar chart shows how the Fund’s
investment results have varied from year to year. The table shows the Fund’s average annual total returns for one, five
and ten year periods compared to a broad market index, as well as a custom index that reflects the Fund’s asset allocation
targets. Neither the bar chart nor the table reflects charges deducted in connection with variable contracts. If these charges
were reflected, returns would be less than those shown. The Fund’s past performance is not necessarily an indication of
its future performance. Updated performance information current to the most recent month-end is available at no cost by visiting
www.ultraseriesfund.com or by calling 1-800-670-3600.
Madison
waived 0.10% of the 0.30% annualized management fee for the period July 1, 2014 through April 30, 2022. If the management fee
had not been waived, returns would have been lower.
|
| Performance Past Does Not Indicate Future [Text] |
The Fund’s past performance is not necessarily an indication of
its future performance.
|
| Performance Information Illustrates Variability of Returns [Text] |
The
following bar chart and table provide some indication of the risks of investing in the Fund. The bar chart shows how the Fund’s
investment results have varied from year to year.
|
| Performance Additional Market Index [Text] |
The Conservative Allocation Fund Custom Index consists of 65% Bloomberg U.S. Aggregate Bond Index, 24.5% Russell 3000® Index, and
10.5% MSCI ACWI ex-USA Index (net).
|
| Bar Chart [Heading] |
Calendar
Year Total Returns for Class I Shares
|
| Bar Chart [Table] |
| |
|
| 2016 |
5.48 |
| 2017 |
10.17 |
| 2018 |
-2.49 |
| 2019 |
12.97 |
| 2020 |
9.46 |
| 2021 |
3.59 |
| 2022 |
-13.17 |
| 2023 |
8.33 |
| 2024 |
4.99 |
| 2025 |
9.67 |
|
| Bar Chart Closing [Text Block] |
| Best
Calendar Quarter: |
2Q
2020 |
7.53 % |
| Worst
Calendar Quarter: |
2Q
2022 |
-7.53 % |
|
| Performance Table Heading |
Average
Annual Total Returns1
For
Periods Ended December 31, 2025
|
| Performance [Table] |
| |
1
Year |
5
Years |
10
Years |
| Class
I Shares 1 |
9.67% |
2.33% |
4.63% |
| Class
II Shares 1 |
9.40% |
2.08% |
4.37% |
| ICE
BofA U.S. Corporate, Government & Mortgage Index2 (reflects no deduction for sales charges, account fees, expenses
or taxes) 1 2 |
7.16% |
-0.48% |
1.99% |
| Bloomberg
U.S. Aggregate Bond Index3 1 3 |
7.30% |
(0.36%) |
2.01% |
| Conservative
Allocation Fund Custom Index4 (reflects no deduction for sales charges, account fees, expenses or taxes) 1 4 |
12.24% |
3.84% |
5.82% |
| 1 |
Fund returns are calculated after fund expenses have been subtracted and assume that dividends and capital gains are reinvested in additional
shares of a fund. Returns do not reflect the deduction of taxes that a shareholder would pay on fund distributions or the redemption of
fund shares. Investment return and principal value will fluctuate, so an investor’s shares, when redeemed, may be worth more or
less than original cost. Further information relating to the fund’s performance is contained in the prospectus and at www.madisonfunds.com/funds/ultra-series-fund.
The Fund’s past performance is not indicative of future performance. |
| 2 |
The ICE BofA U.S. Corporate, Government & Mortgage Index is a broad-based measure of the total rate of return performance of the U.S.
investment-grade bond markets. The index is a capitalization-weighted aggregation of outstanding U.S. treasury, agency and supranational
mortgage pass-through, and investment-grade corporate bonds meeting specified selection criteria. |
| 3 |
The Bloomberg US Aggregate Bond Index is a broad-based flagship benchmark that measures the investment grade, US dollar-denominated, fixed-rate
taxable bond market. |
| 4 |
The Conservative Allocation Fund Custom Index consists of 65% Bloomberg U.S. Aggregate Bond Index, 24.5% Russell 3000® Index, and
10.5% MSCI ACWI ex-USA Index (net). |
1
Fund returns are calculated after fund expenses have been subtracted and assume that dividends and capital gains are reinvested
in additional shares of a fund. Returns do not reflect the deduction of taxes that a shareholder would pay on fund distributions
or the redemption of fund shares. Investment return and principal value will fluctuate, so an investor’s shares, when redeemed,
may be worth more or less than original cost. Further information relating to the fund’s performance is contained in the prospectus
and at www.madisonfunds.com/funds/ultra-series-fund. The Fund’s past performance is not indicative of future performance.
2
The ICE BofA U.S. Corporate, Government & Mortgage Index is a broad-based measure of the total rate of return performance
of the U.S. investment-grade bond markets. The index is a capitalization-weighted aggregation of outstanding U.S. treasury, agency
and supranational mortgage pass-through, and investment-grade corporate bonds meeting specified selection criteria.
3
The Bloomberg US Aggregate Bond Index is a broad-based flagship benchmark that measures the investment grade, US dollar-denominated,
fixed-rate taxable bond market.
4
The Conservative Allocation Fund Custom Index consists of 65% Bloomberg U.S. Aggregate Bond Index, 24.5% Russell 3000®
Index, and 10.5% MSCI ACWI ex-USA Index (net).
The Conservative Allocation Fund Custom Index consists of 65% Bloomberg U.S. Aggregate Bond Index, 24.5% Russell 3000® Index, and
10.5% MSCI ACWI ex-USA Index (net).
|
| Index No Deduction for Fees, Expenses, or Taxes [Text] |
(reflects no deduction for sales charges, account fees, expenses or taxes)
|
| Performance Availability Website Address [Text] |
www.ultraseriesfund.com
|
| Performance Availability Phone [Text] |
1-800-670-3600
|
| Conservative Allocation Fund | Conservative Allocation Fund Class I |
|
| Prospectus [Line Items] |
|
| Highest Quarterly Return, Label [Optional Text] |
Best
Calendar Quarter:
|
| Highest Quarterly Return |
7.53%
|
| Highest Quarterly Return, Date |
Jun. 30, 2020
|
| Lowest Quarterly Return, Label [Optional Text] |
Worst
Calendar Quarter:
|
| Lowest Quarterly Return |
(7.53%)
|
| Lowest Quarterly Return, Date |
Jun. 30, 2022
|
| Moderate Allocation Fund |
|
| Prospectus [Line Items] |
|
| Bar Chart and Performance Table [Heading] |
Performance
|
| Performance Narrative [Text Block] |
The
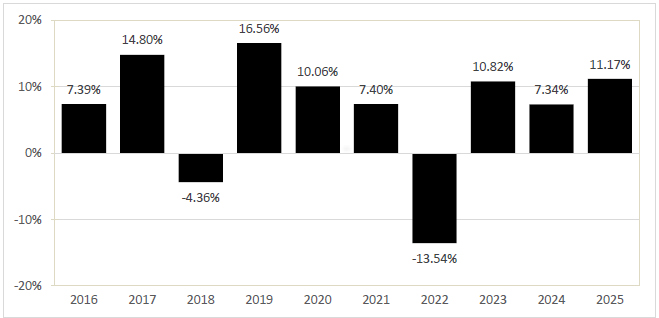
following bar chart and table provide some indication of the risks of investing in the Fund. The bar chart shows how the Fund’s
investment results have varied from year to year. The table shows the Fund’s average annual total returns for one, five
and ten year periods compared to a broad market index, as well as a custom index that reflects the Fund’s asset allocation
targets. Neither the bar chart nor the table reflects charges deducted in connection with variable contracts. If these charges
were reflected, returns would be less than those shown. The Fund’s past performance is not necessarily an indication of
its future performance. Updated performance information current to the most recent month-end is available at no cost by visiting
www.ultraseriesfund.com or by calling 1-800-670-3600.
Madison
waived 0.10% of the 0.30% annualized management fee for the period July 1, 2014 through April 30, 2022. If the management fee
had not been waived, returns would have been lower.
|
| Performance Past Does Not Indicate Future [Text] |
The Fund’s past performance is not necessarily an indication of
its future performance.
|
| Performance Information Illustrates Variability of Returns [Text] |
The
following bar chart and table provide some indication of the risks of investing in the Fund. The bar chart shows how the Fund’s
investment results have varied from year to year.
|
| Performance Additional Market Index [Text] |
1The
Moderate Allocation Fund Custom Index consists of 42% Russell 3000® Index, 40% Bloomberg U.S. Aggregate Bond Index
and 18% MSCI ACWI ex-USA Index (net).
|
| Bar Chart [Heading] |
Calendar
Year Total Returns for Class I Shares
|
| Bar Chart [Table] |
| |
|
| 2016 |
7.39 |
| 2017 |
14.80 |
| 2018 |
-4.36 |
| 2019 |
16.56 |
| 2020 |
10.06 |
| 2021 |
7.40 |
| 2022 |
-13.54 |
| 2023 |
10.82 |
| 2024 |
7.34 |
| 2025 |
11.17 |
|
| Bar Chart Closing [Text Block] |
| Best
Calendar Quarter: |
2Q
2020 |
10.00 % |
| Worst
Calendar Quarter: |
2Q
2022 |
-9.85 % |
|
| Performance Table Heading |
Average
Annual Total Returns
For
Periods Ended December 31, 2025
|
| Performance [Table] |
| |
1
Year |
5
Years |
10
Years |
| Class
I Shares |
11.17% |
4.19% |
6.39% |
| Class
II Shares |
10.89% |
3.93% |
6.12% |
| S&P
500® Index (reflects no deduction for sales charges, account fees, expenses or taxes) |
17.88% |
14.42% |
14.82% |
| Moderate
Allocation Fund Custom Index1 (reflects no deduction for sales charges, account fees, expenses or taxes) |
15.82% |
6.85% |
8.47% |
| 1 |
The Moderate Allocation Fund Custom Index consists of 42% Russell 3000® Index, 40% Bloomberg U.S. Aggregate Bond Index and 18% MSCI
ACWI ex-USA Index (net). |
1The
Moderate Allocation Fund Custom Index consists of 42% Russell 3000® Index, 40% Bloomberg U.S. Aggregate Bond Index
and 18% MSCI ACWI ex-USA Index (net).
|
| Index No Deduction for Fees, Expenses, or Taxes [Text] |
(reflects no deduction for sales charges, account fees, expenses or taxes)
|
| Performance Availability Website Address [Text] |
www.ultraseriesfund.com
|
| Performance Availability Phone [Text] |
1-800-670-3600
|
| Moderate Allocation Fund | Moderate Allocation Fund Class I |
|
| Prospectus [Line Items] |
|
| Highest Quarterly Return, Label [Optional Text] |
Best
Calendar Quarter:
|
| Highest Quarterly Return |
10.00%
|
| Highest Quarterly Return, Date |
Jun. 30, 2020
|
| Lowest Quarterly Return, Label [Optional Text] |
Worst
Calendar Quarter:
|
| Lowest Quarterly Return |
(9.85%)
|
| Lowest Quarterly Return, Date |
Jun. 30, 2022
|
| Aggressive Allocation Fund |
|
| Prospectus [Line Items] |
|
| Bar Chart and Performance Table [Heading] |
Performance
|
| Performance Narrative [Text Block] |
The
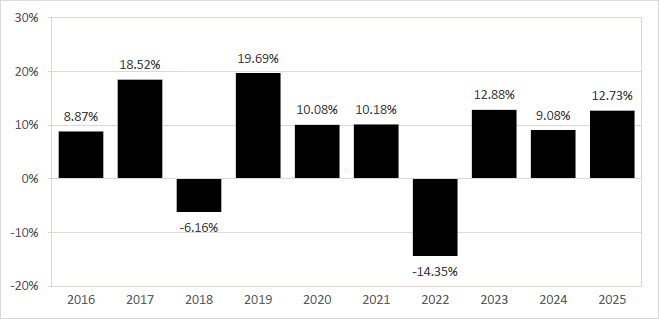
following bar chart and table provide some indication of the risks of investing in the Fund. The bar chart shows how the Fund’s
investment results have varied from year to year. The table shows the Fund’s average annual total returns for one, five
and ten year periods compared to a broad market index, as well as a custom index that reflects the Fund’s asset allocation
targets. Neither the bar chart nor the table reflects charges deducted in connection with variable contracts. If these charges
were reflected, returns would be less than those shown. The Fund’s past performance is not necessarily an indication of
its future performance. Updated performance information current to the most recent month-end is available at no cost by visiting
www.ultraseriesfund.com or by calling 1-800-670-3600.
Madison
waived 0.10% of the 0.30% annualized management fee for the period July 1, 2014 through April 30, 2022. If the management fee
had not been waived, returns would have been lower.
|
| Performance Past Does Not Indicate Future [Text] |
The Fund’s past performance is not necessarily an indication of
its future performance.
|
| Performance Information Illustrates Variability of Returns [Text] |
The
following bar chart and table provide some indication of the risks of investing in the Fund. The bar chart shows how the Fund’s
investment results have varied from year to year.
|
| Performance Additional Market Index [Text] |
The Aggressive Allocation Fund Custom Index consists of 56% Russell 3000® Index, 24% MSCI ACWI ex-USA Index and 20% Bloomberg U.S.
Aggregate Bond Index (net).
|
| Bar Chart [Heading] |
Calendar
Year Total Returns for Class I Shares
|
| Bar Chart [Table] |
| |
|
| 2016 |
8.87 |
| 2017 |
18.52 |
| 2018 |
-6.16 |
| 2019 |
19.69 |
| 2020 |
10.08 |
| 2021 |
10.18 |
| 2022 |
-14.35 |
| 2023 |
12.88 |
| 2024 |
9.08 |
| 2025 |
12.73 |
|
| Bar Chart Closing [Text Block] |
| Best
Calendar Quarter: |
2Q
2020 |
12.22 % |
| Worst
Calendar Quarter: |
1Q
2020 |
-13.45 % |
|
| Performance Table Heading |
Average
Annual Total Returns
For
Periods Ended December 31, 2025
|
| Performance [Table] |
| |
1
Year |
5
Years |
10
Years |
| Class
I Shares |
12.73% |
5.55% |
7.65% |
| Class
II Shares |
12.45% |
5.28% |
7.38% |
| S&P
500® Index (reflects no deduction for sales charges, account fees, expenses or taxes) |
17.88% |
14.42% |
14.82% |
| Aggressive
Allocation Fund Custom Index1 (reflects no deduction for sales charges, account fees, expenses or taxes) |
18.71% |
9.25% |
10.55% |
| 1 | The Aggressive Allocation
Fund Custom Index consists of 56% Russell 3000® Index, 24% MSCI ACWI ex-USA Index and 20% Bloomberg U.S. Aggregate
Bond Index (net). |
|
| Index No Deduction for Fees, Expenses, or Taxes [Text] |
(reflects no deduction for sales charges, account fees, expenses or taxes)
|
| Performance Availability Website Address [Text] |
www.ultraseriesfund.com
|
| Performance Availability Phone [Text] |
1-800-670-3600
|
| Aggressive Allocation Fund | Aggressive Allocation Fund Class I |
|
| Prospectus [Line Items] |
|
| Highest Quarterly Return, Label [Optional Text] |
Best
Calendar Quarter:
|
| Highest Quarterly Return |
12.22%
|
| Highest Quarterly Return, Date |
Jun. 30, 2020
|
| Lowest Quarterly Return, Label [Optional Text] |
Worst
Calendar Quarter:
|
| Lowest Quarterly Return |
(13.45%)
|
| Lowest Quarterly Return, Date |
Mar. 31, 2020
|
| Diversified Income Fund |
|
| Prospectus [Line Items] |
|
| Bar Chart and Performance Table [Heading] |
Performance
|
| Performance Narrative [Text Block] |
The
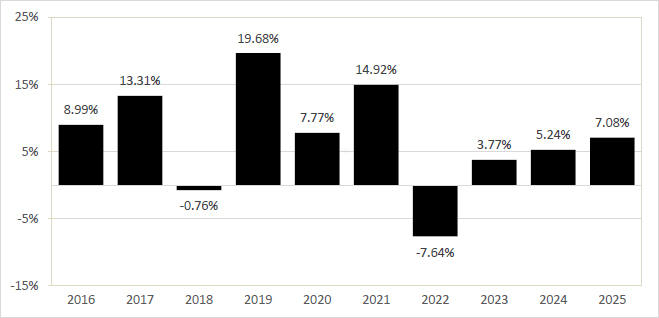
following bar chart and table provide some indication of the risks of investing in the Fund. The bar chart shows how the Fund’s
investment results have varied from year to year. The table shows the Fund’s average annual total returns for one, five
and ten year periods compared to broad measures of market performance, as well as a custom index that reflects a hypothetical
investment allocation of 50% bonds and 50% stocks. Neither the bar chart nor the table reflects charges deducted in connection
with variable contracts. If these charges were reflected, returns would be less than those shown. The Fund’s past performance
is not necessarily an indication of its future performance. Performance data presented below for all periods prior to July 31,
2023, represents the performance of the previous portfolio management team of Madison who used different principal investment
strategies to achieve the Fund’s investment objective. Updated performance information current to the most recent month-end is
available at no cost by visiting www.ultraseriesfund.com or by calling 1-800-670-3600.
|
| Performance Past Does Not Indicate Future [Text] |
The Fund’s past performance
is not necessarily an indication of its future performance.
|
| Performance Information Illustrates Variability of Returns [Text] |
The
following bar chart and table provide some indication of the risks of investing in the Fund. The bar chart shows how the Fund’s
investment results have varied from year to year.
|
| Performance Additional Market Index [Text] |
The
Diversified Income Custom Benchmark consists of 50% Bloomberg US Intermediate Aggregate Bond Index; 30% Dow Jones US Dividend100 Index;
20% CBOE S&P 500 BuyWrite Index.
|
| Bar Chart [Heading] |
Calendar
Year Total Returns for Class I Shares
|
| Bar Chart [Table] |
| |
|
| 2016 |
8.99 |
| 2017 |
13.31 |
| 2018 |
-0.76 |
| 2019 |
19.68 |
| 2020 |
7.77 |
| 2021 |
14.92 |
| 2022 |
-7.64 |
| 2023 |
3.77 |
| 2024 |
5.24 |
| 2025 |
7.08 |
|
| Bar Chart Closing [Text Block] |
| Best
Calendar Quarter: |
4Q
2022 |
10.18 % |
| Worst
Calendar Quarter: |
1Q
2020 |
-13.56 % |
|
| Performance Table Heading |
Average
Annual Total Returns1
For
Periods Ended December 31, 2025
|
| Performance [Table] |
| |
1
Year |
5
Years |
10
Years |
| Class
I Shares 1 |
7.08% |
4.42% |
6.97% |
| Class
II Shares 1 |
6.81% |
4.16% |
6.71% |
| S&P
500® Index2 (reflects no deduction for sales charges, account fees, expenses or taxes) 1 2 |
17.88% |
14.42% |
14.82% |
| Diversified
Income Custom Benchmark3 (reflects no deduction for sales charges, account fees, expenses
or taxes) 1 3 |
6.94% |
5.00% |
6.20% |
| 1 | Fund
returns are calculated after fund expenses have been subtracted and assume that dividends and capital gains are reinvested in additional
shares of a fund. Returns do not reflect the deduction of taxes that a shareholder would pay on fund distributions or the redemption
of fund shares. Investment return and principal value will fluctuate, so an investor’s shares, when redeemed, may be worth more
or less than original cost. Further information relating to the fund’s performance is contained in the prospectus and at www.madisonfunds.com/funds/ultra-series-fund.
The Fund’s past performance is not indicative of future performance. |
| 2 | The
S&P 500 Index is a large-cap market index which measures the performance of a representative sample of 500 leading companies inleading
industries in the U.S. |
| 3 | The
Diversified Income Custom Benchmark consists of 50% Bloomberg US Intermediate Aggregate Bond Index; 30% Dow Jones US Dividend100 Index;
20% CBOE S&P 500 BuyWrite Index. |
|
| Performance Availability Website Address [Text] |
www.ultraseriesfund.com
|
| Performance Availability Phone [Text] |
1-800-670-3600
|
| Diversified Income Fund | Diversified Income Fund Class I |
|
| Prospectus [Line Items] |
|
| Highest Quarterly Return, Label [Optional Text] |
Best
Calendar Quarter:
|
| Highest Quarterly Return |
10.18%
|
| Highest Quarterly Return, Date |
Dec. 31, 2022
|
| Lowest Quarterly Return, Label [Optional Text] |
Worst
Calendar Quarter:
|
| Lowest Quarterly Return |
(13.56%)
|
| Lowest Quarterly Return, Date |
Mar. 31, 2020
|
| Core Bond Fund |
|
| Prospectus [Line Items] |
|
| Bar Chart and Performance Table [Heading] |
Performance
|
| Performance Narrative [Text Block] |
The
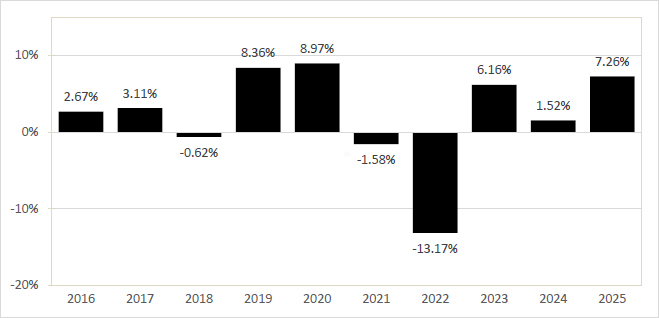
following bar chart and table provide some indication of the risks of investing in the Fund. The bar chart shows how the Fund’s
investment results have varied from year to year. The table shows the Fund’s average annual total returns for one, five
and ten year periods compared to a broad measure of market performance. Neither the bar chart nor the table reflects charges deducted
in connection with variable contracts. If these charges were reflected, returns would be less than those shown. The Fund’s
past performance is not necessarily an indication of its future performance. Updated performance information current to the most
recent month-end is available at no cost by visiting www.ultraseriesfund.com or by calling 1-800-670-3600.
|
| Performance Past Does Not Indicate Future [Text] |
The Fund’s
past performance is not necessarily an indication of its future performance.
|
| Performance Information Illustrates Variability of Returns [Text] |
The
following bar chart and table provide some indication of the risks of investing in the Fund. The bar chart shows how the Fund’s
investment results have varied from year to year.
|
| Bar Chart [Heading] |
Calendar
Year Total Returns for Class I Shares
|
| Bar Chart [Table] |
| |
|
| 2016 |
2.67 |
| 2017 |
3.11 |
| 2018 |
-0.62 |
| 2019 |
8.36 |
| 2020 |
8.97 |
| 2021 |
-1.58 |
| 2022 |
-13.17 |
| 2023 |
6.16 |
| 2024 |
1.52 |
| 2025 |
7.26 |
|
| Bar Chart Closing [Text Block] |
| Best
Calendar Quarter: |
4Q
2023 |
7.27 % |
| Worst
Calendar Quarter: |
1Q
2022 |
-5.99 % |
|
| Performance Table Heading |
Average
Annual Total Returns
For
Periods Ended December 31, 2025
|
| Performance [Table] |
| |
1
Year |
5
Years |
10
Years |
| Class
I Shares |
7.26% |
-0.24% |
2.07% |
| Class
II Shares |
7.00% |
-0.49% |
1.81% |
| Bloomberg
U.S. Aggregate Bond Index (reflects no deduction for sales charges, account fees, expenses or taxes) |
7.30% |
-0.36% |
2.01% |
|
| Index No Deduction for Fees, Expenses, or Taxes [Text] |
(reflects no deduction for sales charges, account fees, expenses or taxes)
|
| Performance Availability Website Address [Text] |
www.ultraseriesfund.com
|
| Performance Availability Phone [Text] |
1-800-670-3600
|
| Core Bond Fund | Core Bond Fund Class I |
|
| Prospectus [Line Items] |
|
| Highest Quarterly Return, Label [Optional Text] |
Best
Calendar Quarter:
|
| Highest Quarterly Return |
7.27%
|
| Highest Quarterly Return, Date |
Dec. 31, 2023
|
| Lowest Quarterly Return, Label [Optional Text] |
Worst
Calendar Quarter:
|
| Lowest Quarterly Return |
(5.99%)
|
| Lowest Quarterly Return, Date |
Mar. 31, 2022
|
| Large Cap Value Fund |
|
| Prospectus [Line Items] |
|
| Bar Chart and Performance Table [Heading] |
Performance
|
| Performance Narrative [Text Block] |
The
following bar chart and table provide some indication of the risks of investing in the Fund. The bar chart shows how the Fund’s
investment results have varied from year to year. The table shows the Fund’s average annual total returns for one, five
and ten year periods compared to a broad measure of market performance as well as a more narrowly tailored index. Neither the
bar chart nor the table reflects charges deducted in connection with variable contracts. If these charges were reflected, returns
would be less than those shown. The Fund’s past performance is not necessarily an indication of its future performance.
Updated performance information current to the most recent month-end is available at no cost by visiting www.ultraseriesfund.com
or by calling 1-800-670-3600.
|
| Performance Past Does Not Indicate Future [Text] |
The Fund’s past performance is not necessarily an indication of its future performance.
|
| Performance Information Illustrates Variability of Returns [Text] |
The
following bar chart and table provide some indication of the risks of investing in the Fund. The bar chart shows how the Fund’s
investment results have varied from year to year.
|
| Bar Chart [Heading] |
Calendar
Year Total Returns for Class I Shares
|
| Bar Chart [Table] |
| |
|
| 2016 |
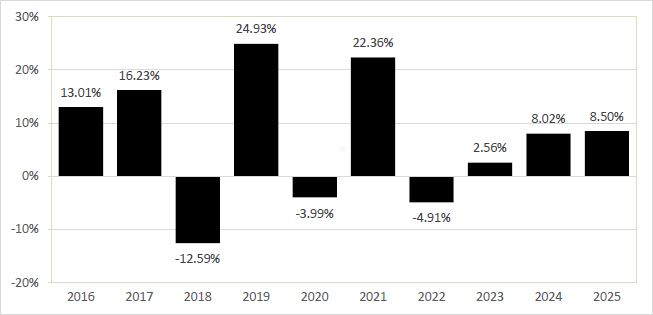
13.01 |
| 2017 |
16.23 |
| 2018 |
-12.59 |
| 2019 |
24.93 |
| 2020 |
-3.99 |
| 2021 |
22.36 |
| 2022 |
-4.91 |
| 2023 |
2.56 |
| 2024 |
8.02 |
| 2025 |
8.50 |
|
| Bar Chart Closing [Text Block] |
| Best
Calendar Quarter: |
4Q
2022 |
14.14 % |
| Worst
Calendar Quarter: |
1Q
2020 |
-26.71 % |
|
| Performance Table Heading |
Average
Annual Total Returns
For
Periods Ended December 31, 2025
|
| Performance [Table] |
| |
1
Year |
5
Years |
10
Years |
| Class
I Shares |
8.50% |
6.94% |
6.77% |
| Class
II Shares |
8.23% |
6.67% |
6.51% |
| S&P
500® Index (reflects no deductions for sales charges, account fees, expenses or taxes) |
17.88% |
14.42% |
14.82% |
| Russell
1000® Value Index (reflects no deduction for sales charges, account fees, expenses or taxes) |
15.91% |
11.33% |
10.53% |
|
| Index No Deduction for Fees, Expenses, or Taxes [Text] |
(reflects no deduction for sales charges, account fees, expenses or taxes)
|
| Performance Availability Website Address [Text] |
www.ultraseriesfund.com
|
| Performance Availability Phone [Text] |
1-800-670-3600
|
| Large Cap Value Fund | Large Cap Value Fund Class I |
|
| Prospectus [Line Items] |
|
| Highest Quarterly Return, Label [Optional Text] |
Best
Calendar Quarter:
|
| Highest Quarterly Return |
14.14%
|
| Highest Quarterly Return, Date |
Dec. 31, 2022
|
| Lowest Quarterly Return, Label [Optional Text] |
Worst
Calendar Quarter:
|
| Lowest Quarterly Return |
(26.71%)
|
| Lowest Quarterly Return, Date |
Mar. 31, 2020
|
| Large Cap Growth Fund |
|
| Prospectus [Line Items] |
|
| Bar Chart and Performance Table [Heading] |
Performance
|
| Performance Narrative [Text Block] |
The
following bar chart and table provide some indication of the risks of investing in the Fund. The bar chart shows how the Fund’s
investment results have varied from year to year. The table shows the Fund’s average annual total returns for one, five
and ten year periods compared to a broad measure of market performance as well as a more narrowly tailored index. Neither the
bar chart nor the table reflects charges deducted in connection with variable contracts. If these charges were reflected, returns
would be less than those shown. The Fund’s past performance is not necessarily an indication of its future performance.
Updated performance information current to the most recent month-end is available at no cost by visiting www.ultraseriesfund.com
or by calling 1-800-670-3600.
|
| Performance Past Does Not Indicate Future [Text] |
The Fund’s past performance is not necessarily an indication of its future performance.
|
| Performance Information Illustrates Variability of Returns [Text] |
The
following bar chart and table provide some indication of the risks of investing in the Fund. The bar chart shows how the Fund’s
investment results have varied from year to year.
|
| Bar Chart [Heading] |
Calendar
Year Total Returns for Class I Shares
|
| Bar Chart [Table] |
| |
|
| 2016 |
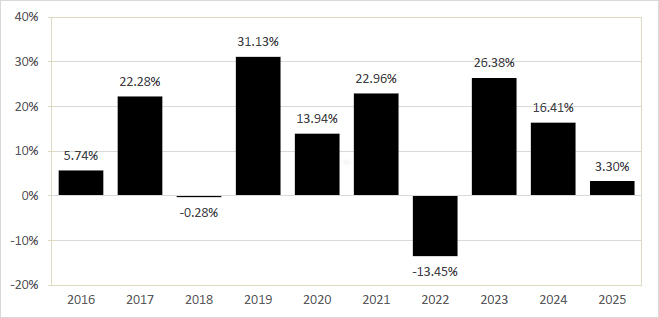
5.74 |
| 2017 |
22.28 |
| 2018 |
-0.28 |
| 2019 |
31.13 |
| 2020 |
13.94 |
| 2021 |
22.96 |
| 2022 |
-13.45 |
| 2023 |
26.38 |
| 2024 |
16.41 |
| 2025 |
3.30 |
|
| Bar Chart Closing [Text Block] |
| Best
Calendar Quarter: |
2Q
2020 |
17.73 % |
| Worst
Calendar Quarter: |
1Q
2020 |
-21.34 % |
|
| Performance Table Heading |
Average
Annual Total Returns
For
Periods Ended December 31, 2025
|
| Performance [Table] |
| |
1
Year |
5
Years |
10
Years |
| Class
I Shares |
3.30% |
10.09% |
12.04% |
| Class
II Shares |
3.04% |
9.82% |
11.76% |
| S&P
500® Index (reflects no deductions for sales charges, account fees, expenses or taxes) |
17.88% |
14.42% |
14.82% |
| Russell
1000® Growth Index (reflects no deduction for sales charges, account fees, expenses or taxes) |
18.56% |
15.32% |
18.13% |
|
| Index No Deduction for Fees, Expenses, or Taxes [Text] |
(reflects no deduction for sales charges, account fees, expenses or taxes)
|
| Performance Availability Website Address [Text] |
www.ultraseriesfund.com
|
| Performance Availability Phone [Text] |
1-800-670-3600
|
| Large Cap Growth Fund | Large Cap Growth Fund Class I |
|
| Prospectus [Line Items] |
|
| Highest Quarterly Return, Label [Optional Text] |
Best
Calendar Quarter:
|
| Highest Quarterly Return |
17.73%
|
| Highest Quarterly Return, Date |
Jun. 30, 2020
|
| Lowest Quarterly Return, Label [Optional Text] |
Worst
Calendar Quarter:
|
| Lowest Quarterly Return |
(21.34%)
|
| Lowest Quarterly Return, Date |
Mar. 31, 2020
|
| Mid Cap Fund |
|
| Prospectus [Line Items] |
|
| Bar Chart and Performance Table [Heading] |
Performance
|
| Performance Narrative [Text Block] |
The
following bar chart and table provide some indication of the risks of investing in the Fund. The bar chart shows how the Fund’s
investment results have varied from year to year. The table shows the Fund’s average annual total returns for one, five
and ten year periods compared to a broad measure of market performance as well as a more narrowly tailored index. Neither the
bar chart nor the table reflects charges deducted in connection with variable contracts. If these charges were reflected, returns
would be less than those shown. The Fund’s past performance is not necessarily an indication of its future performance.
Updated performance information current to the most recent month-end is available at no cost by visiting www.ultraseriesfund.com
or by calling 1-800-670-3600.
|
| Performance Past Does Not Indicate Future [Text] |
The Fund’s past performance is not necessarily an indication of its future performance.
|
| Performance Information Illustrates Variability of Returns [Text] |
The
following bar chart and table provide some indication of the risks of investing in the Fund. The bar chart shows how the Fund’s
investment results have varied from year to year.
|
| Bar Chart [Heading] |
Calendar
Year Total Returns for Class I Shares
|
| Bar Chart [Table] |
| |
|
| 2016 |
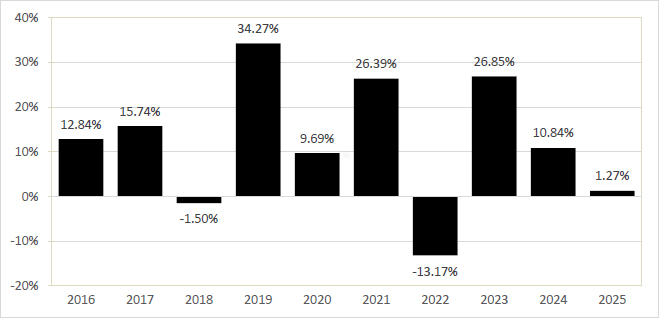
12.84 |
| 2017 |
15.74 |
| 2018 |
-1.50 |
| 2019 |
34.27 |
| 2020 |
9.69 |
| 2021 |
26.39 |
| 2022 |
-13.17 |
| 2023 |
26.85 |
| 2024 |
10.84 |
| 2025 |
1.27 |
|
| Bar Chart Closing [Text Block] |
| Best
Calendar Quarter: |
2Q
2020 |
16.43 % |
| Worst
Calendar Quarter: |
1Q
2020 |
-23.89 % |
|
| Performance Table Heading |
Average
Annual Total Returns
For
Periods Ended December 31, 2025
|
| Performance [Table] |
| |
1
Year |
5
Years |
10
Years |
| Class
I Shares |
1.27% |
9.34% |
11.46% |
| Class
II Shares |
1.02% |
9.06% |
11.19% |
| S&P
500® Index (reflects no deductions for sales charges, account fees, expenses or taxes) |
17.88% |
14.42% |
14.82% |
| Russell
Midcap® Index (reflects no deduction for sales charges, account fees, expenses or taxes) |
10.60% |
8.67% |
11.01% |
|
| Index No Deduction for Fees, Expenses, or Taxes [Text] |
(reflects no deduction for sales charges, account fees, expenses or taxes)
|
| Performance Availability Website Address [Text] |
www.ultraseriesfund.com
|
| Performance Availability Phone [Text] |
1-800-670-3600
|
| Mid Cap Fund | Mid Cap Fund Class I |
|
| Prospectus [Line Items] |
|
| Highest Quarterly Return, Label [Optional Text] |
Best
Calendar Quarter:
|
| Highest Quarterly Return |
16.43%
|
| Highest Quarterly Return, Date |
Jun. 30, 2020
|
| Lowest Quarterly Return, Label [Optional Text] |
Worst
Calendar Quarter:
|
| Lowest Quarterly Return |
(23.89%)
|
| Lowest Quarterly Return, Date |
Mar. 31, 2020
|
| Madison Target Retirement 2020 Fund |
|
| Prospectus [Line Items] |
|
| Bar Chart and Performance Table [Heading] |
Performance
|
| Performance Narrative [Text Block] |
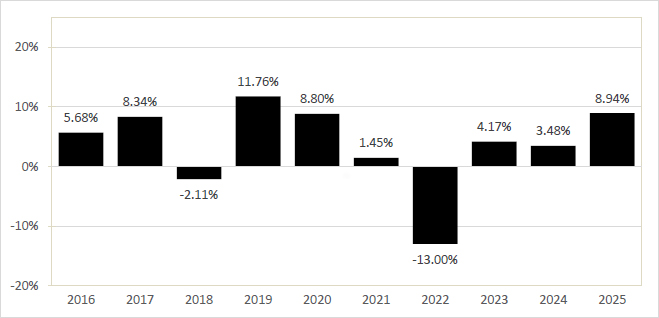
The
following bar chart and table provide some indication of the risks of investing in the Fund. The bar chart shows how the Fund’s
investment results have varied from year to year. The table shows the Fund’s average annual total returns for one, five
and ten year periods compared to a broad market index as well as a more narrowly tailored index. Neither the bar chart nor the
table reflects charges deducted in connection with variable contracts. If these charges were reflected, returns would be less
than those shown. The Fund’s past performance is not necessarily an indication of its future performance. Updated performance
information current to the most recent month-end is available at no cost by visiting www.ultraseriesfund.com or by calling 1-800-670-3600.
|
| Performance Past Does Not Indicate Future [Text] |
The Fund’s past performance is not necessarily an indication of its future performance.
|
| Performance Information Illustrates Variability of Returns [Text] |
The
following bar chart and table provide some indication of the risks of investing in the Fund. The bar chart shows how the Fund’s
investment results have varied from year to year.
|
| Bar Chart [Heading] |
Calendar
Year Total Returns for Class I Shares
|
| Bar Chart [Table] |
| |
|
| 2016 |
5.68 |
| 2017 |
8.34 |
| 2018 |
-2.11 |
| 2019 |
11.76 |
| 2020 |
8.80 |
| 2021 |
1.45 |
| 2022 |
-13.00 |
| 2023 |
4.17 |
| 2024 |
3.48 |
| 2025 |
8.94 |
|
| Bar Chart Closing [Text Block] |
| Best
Calendar Quarter: |
2Q
2022 |
5.74 % |
| Worst
Calendar Quarter: |
3Q
2022 |
-5.66 % |
|
| Performance Table Heading |
Average
Annual Total Returns
For
Periods Ended December 31, 2025
|
| Performance [Table] |
| |
1
Year |
5
Years |
10
Years |
| Class I Shares |
8.94% |
0.72% |
3.51% |
| Bloomberg
U.S. Aggregate Bond Index (reflects no deductions for sales charges, account fees, expenses or taxes) |
7.30% |
-0.36% |
2.01% |
| S&P
Target Date To 2020 Index (reflects no deductions for sales charges, account fees, expenses or taxes) |
10.96% |
4.40% |
5.92% |
|
| Performance Availability Website Address [Text] |
www.ultraseriesfund.com
|
| Performance Availability Phone [Text] |
1-800-670-3600
|
| Madison Target Retirement 2020 Fund | Madison Target Retirement 2020 Fund Class I |
|
| Prospectus [Line Items] |
|
| Highest Quarterly Return, Label [Optional Text] |
Best
Calendar Quarter:
|
| Highest Quarterly Return |
5.74%
|
| Highest Quarterly Return, Date |
Jun. 30, 2022
|
| Lowest Quarterly Return, Label [Optional Text] |
Worst
Calendar Quarter:
|
| Lowest Quarterly Return |
(5.66%)
|
| Lowest Quarterly Return, Date |
Sep. 30, 2022
|
| Madison Target Retirement 2030 Fund |
|
| Prospectus [Line Items] |
|
| Bar Chart and Performance Table [Heading] |
Performance
|
| Performance Narrative [Text Block] |
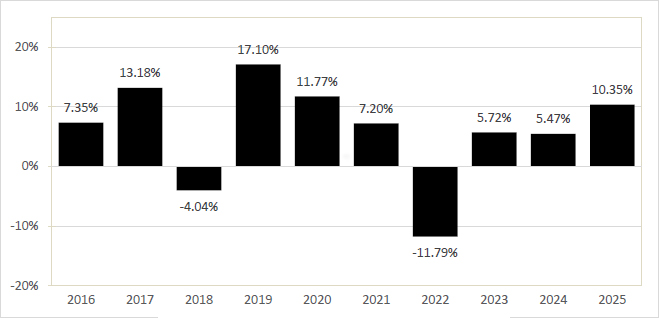
The
following bar chart and table provide some indication of the risks of investing in the Fund. The bar chart shows how the Fund’s
investment results have varied from year to year. The table shows the Fund’s average annual total returns for one, five
and ten year periods compared to a broad market index as well as a more narrowly tailored index. Neither the bar chart nor the
table reflects charges deducted in connection with variable contracts. If these charges were reflected, returns would be less
than those shown. The Fund’s past performance is not necessarily an indication of its future performance. Updated performance
information current to the most recent month-end is available at no cost by visiting www.ultraseriesfund.com or by calling 1-800-670-3600.
|
| Performance Past Does Not Indicate Future [Text] |
The Fund’s past performance is not necessarily an indication of its future performance.
|
| Performance Information Illustrates Variability of Returns [Text] |
The
following bar chart and table provide some indication of the risks of investing in the Fund. The bar chart shows how the Fund’s
investment results have varied from year to year.
|
| Bar Chart [Heading] |
Calendar
Year Total Returns for Class I Shares
|
| Bar Chart [Table] |
| |
|
| 2016 |
7.35 |
| 2017 |
13.18 |
| 2018 |
-4.04 |
| 2019 |
17.10 |
| 2020 |
11.77 |
| 2021 |
7.20 |
| 2022 |
-11.79 |
| 2023 |
5.72 |
| 2024 |
5.47 |
| 2025 |
10.35 |
|
| Bar Chart Closing [Text Block] |
| Best
Calendar Quarter: |
2Q
2020 |
10.16 % |
| Worst
Calendar Quarter: |
2Q
2022 |
-8.00 % |
|
| Performance Table Heading |
Average
Annual Total Returns
For
Periods Ended December 31, 2025
|
| Performance [Table] |
| |
1
Year |
5
Years |
10
Years |
| Class I Shares |
10.35% |
3.08% |
5.91% |
| Russell
3000 Index (reflects no deductions for sales charges, account fees, expenses or taxes) |
17.15% |
13.15% |
14.29% |
| S&P
Target Date To 2030 Index (reflects no deduction for sales charges, account fees, expenses or taxes) |
13.97% |
6.50% |
7.83% |
|
| Performance Availability Website Address [Text] |
www.ultraseriesfund.com
|
| Performance Availability Phone [Text] |
1-800-670-3600
|
| Madison Target Retirement 2030 Fund | Madison Target Retirement 2030 Fund Class I |
|
| Prospectus [Line Items] |
|
| Highest Quarterly Return, Label [Optional Text] |
Best
Calendar Quarter:
|
| Highest Quarterly Return |
10.16%
|
| Highest Quarterly Return, Date |
Jun. 30, 2020
|
| Lowest Quarterly Return, Label [Optional Text] |
Worst
Calendar Quarter:
|
| Lowest Quarterly Return |
(8.00%)
|
| Lowest Quarterly Return, Date |
Jun. 30, 2022
|
| Madison Target Retirement 2040 Fund |
|
| Prospectus [Line Items] |
|
| Bar Chart and Performance Table [Heading] |
Performance
|
| Performance Narrative [Text Block] |
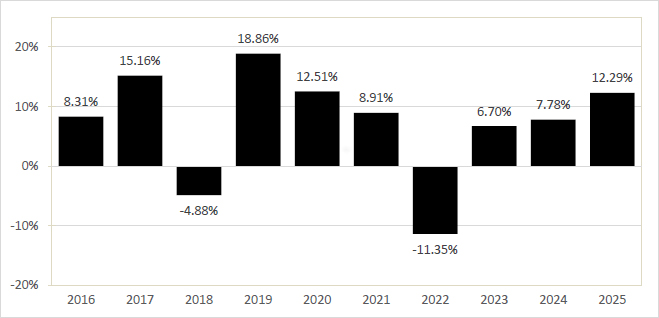
The
following bar chart and table provide some indication of the risks of investing in the Fund. The bar chart shows how the Fund’s
investment results have varied from year to year. The table shows the Fund’s average annual total returns for one, five
and ten year periods compared to a broad market index as well as a more narrowly tailored index. Neither the bar chart nor the
table reflects charges deducted in connection with variable contracts. If these charges were reflected, returns would be less
than those shown. The Fund’s past performance is not necessarily an indication of its future performance. Updated performance
information current to the most recent month-end is available at no cost by visiting www.ultraseriesfund.com or by calling 1-800-670-3600.
|
| Performance Past Does Not Indicate Future [Text] |
The Fund’s past performance is not necessarily an indication of its future performance.
|
| Performance Information Illustrates Variability of Returns [Text] |
The
following bar chart and table provide some indication of the risks of investing in the Fund. The bar chart shows how the Fund’s
investment results have varied from year to year.
|
| Bar Chart [Heading] |
Calendar
Year Total Returns for Class I Shares
|
| Bar Chart [Table] |
| |
|
| 2016 |
8.31 |
| 2017 |
15.16 |
| 2018 |
-4.88 |
| 2019 |
18.86 |
| 2020 |
12.51 |
| 2021 |
8.91 |
| 2022 |
-11.35 |
| 2023 |
6.70 |
| 2024 |
7.78 |
| 2025 |
12.29 |
|
| Bar Chart Closing [Text Block] |
| Best
Calendar Quarter: |
2Q
2020 |
11.70 % |
| Worst
Calendar Quarter: |
2Q
2022 |
-9.44 % |
|
| Performance Table Heading |
Average
Annual Total Returns
For
Periods Ended December 31, 2025
|
| Performance [Table] |
| |
1
Year |
5
Years |
10
Years |
| Class I Shares |
12.29% |
4.51% |
7.06% |
| Russell 3000 Index (reflects no deductions
for sales charges, account fees, expenses or taxes) |
17.15% |
13.15% |
14.29% |
| S&P
Target Date To 2040 Index (reflects no deduction for sales charges, account fees, expenses or taxes) |
17.26% |
8.69% |
9.52% |
|
| Performance Availability Website Address [Text] |
www.ultraseriesfund.com
|
| Performance Availability Phone [Text] |
1-800-670-3600
|
| Madison Target Retirement 2040 Fund | Madison Target Retirement 2040 Fund Class I |
|
| Prospectus [Line Items] |
|
| Highest Quarterly Return, Label [Optional Text] |
Best
Calendar Quarter:
|
| Highest Quarterly Return |
11.70%
|
| Highest Quarterly Return, Date |
Jun. 30, 2020
|
| Lowest Quarterly Return, Label [Optional Text] |
Worst
Calendar Quarter:
|
| Lowest Quarterly Return |
(9.44%)
|
| Lowest Quarterly Return, Date |
Jun. 30, 2022
|
| Madison Target Retirement 2050 Fund |
|
| Prospectus [Line Items] |
|
| Bar Chart and Performance Table [Heading] |
Performance
|
| Performance Narrative [Text Block] |
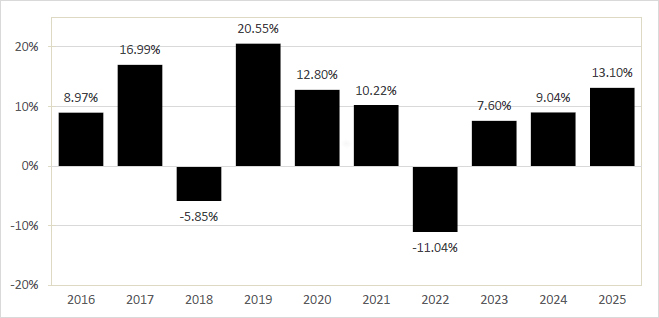
The
following bar chart and table provide some indication of the risks of investing in the Fund. The bar chart shows how the Fund’s
investment results have varied from year to year. The table shows the Fund’s average annual total returns for one, five
and ten year periods compared to a broad market index as well as a more narrowly tailored index. Neither the bar chart nor the
table reflects charges deducted in connection with variable contracts. If these charges were reflected, returns would be less
than those shown. The Fund’s past performance is not necessarily an indication of its future performance. Updated performance
information current to the most recent month-end is available at no cost by visiting www.ultraseriesfund.com or by calling 1-800-670-3600.
|
| Performance Past Does Not Indicate Future [Text] |
The Fund’s past performance is not necessarily an indication of its future performance.
|
| Performance Information Illustrates Variability of Returns [Text] |
The
following bar chart and table provide some indication of the risks of investing in the Fund. The bar chart shows how the Fund’s
investment results have varied from year to year.
|
| Bar Chart [Heading] |
Calendar
Year Total Returns for Class I Shares
|
| Bar Chart [Table] |
| |
|
| 2016 |
8.97 |
| 2017 |
16.99 |
| 2018 |
-5.85 |
| 2019 |
20.55 |
| 2020 |
12.80 |
| 2021 |
10.22 |
| 2022 |
-11.04 |
| 2023 |
7.60 |
| 2024 |
9.04 |
| 2025 |
13.10 |
|
| Bar Chart Closing [Text Block] |
| Best
Calendar Quarter: |
2Q
2020 |
13.16 % |
| Worst
Calendar Quarter: |
2Q
2022 |
-10.48 % |
|
| Performance Table Heading |
Average
Annual Total Returns
For
Periods Ended December 31, 2025
|
| Performance [Table] |
| |
1
Year |
5
Years |
10
Years |
| Class I Shares |
13.10% |
5.41 % |
7.82 % |
| Russell 3000
Index (reflects no deductions for sales charges, account fees, expenses or taxes) |
17.15% |
13.15% |
14.29% |
| S&P
Target Date To 2050 Index (reflects no deduction for sales charges, account fees, expenses or taxes) |
19.18% |
9.97% |
10.47% |
|
| Performance Availability Website Address [Text] |
www.ultraseriesfund.com
|
| Performance Availability Phone [Text] |
1-800-670-3600
|
| Madison Target Retirement 2050 Fund | Madison Target Retirement 2050 Fund Class I |
|
| Prospectus [Line Items] |
|
| Highest Quarterly Return, Label [Optional Text] |
Best
Calendar Quarter:
|
| Highest Quarterly Return |
13.16%
|
| Highest Quarterly Return, Date |
Jun. 30, 2020
|
| Lowest Quarterly Return, Label [Optional Text] |
Worst
Calendar Quarter:
|
| Lowest Quarterly Return |
(10.48%)
|
| Lowest Quarterly Return, Date |
Jun. 30, 2022
|