Pay vs Performance Disclosure - USD ($)
Dec. 31, 2025
Dec. 28, 2024
Dec. 30, 2023
PAY VERSUS PERFORMANCE DISCLOSURE
The following table and supporting narrative contain information regarding “compensation actually paid” to our named executive officers and the relationship to Company performance as required by Item 402(v) of Regulation
S-K. Our
principal executive officers are referred to herein together as “PEOs” and individually as a “PEO”. Our non-PEO
named executive officers are collectively referred to herein as the “Other NEOs”. Year |
Summary Compensation Table Total for PEO Tara Comonte ($) (1) |
Compensation Actually Paid to PEO Tara Comonte ($) (1)(2) |
Summary Compensation Table Total for PEO Sima Sistani ($) (3) |
Compensation Actually Paid to PEO Sima Sistani ($) (2)(3) |
Average Summary Compensation Table Total for Non-PEO Named Executive Officers ($) (4) |
Average Compensation Actually Paid to Non-PEO Named Executive Officers ($) (2) (4) |
Value of Initial Fixed $100 Investment Based on Total Shareholder Return (5) |
Net Income (Loss) ($ in millions) |
||||||||||||||||||||||||
2025 |
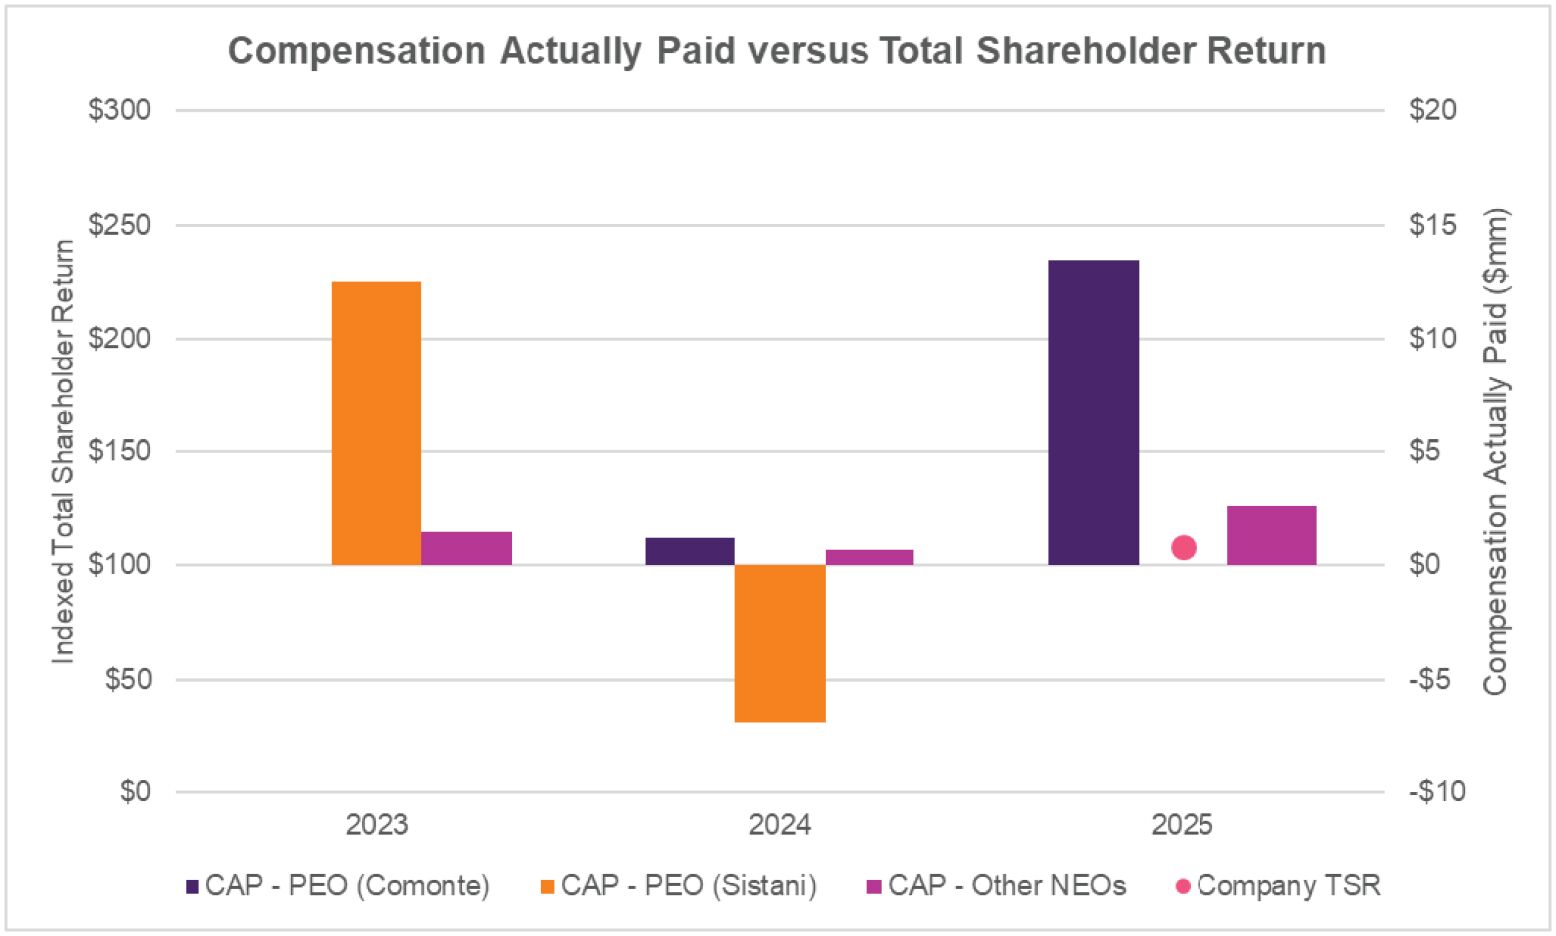
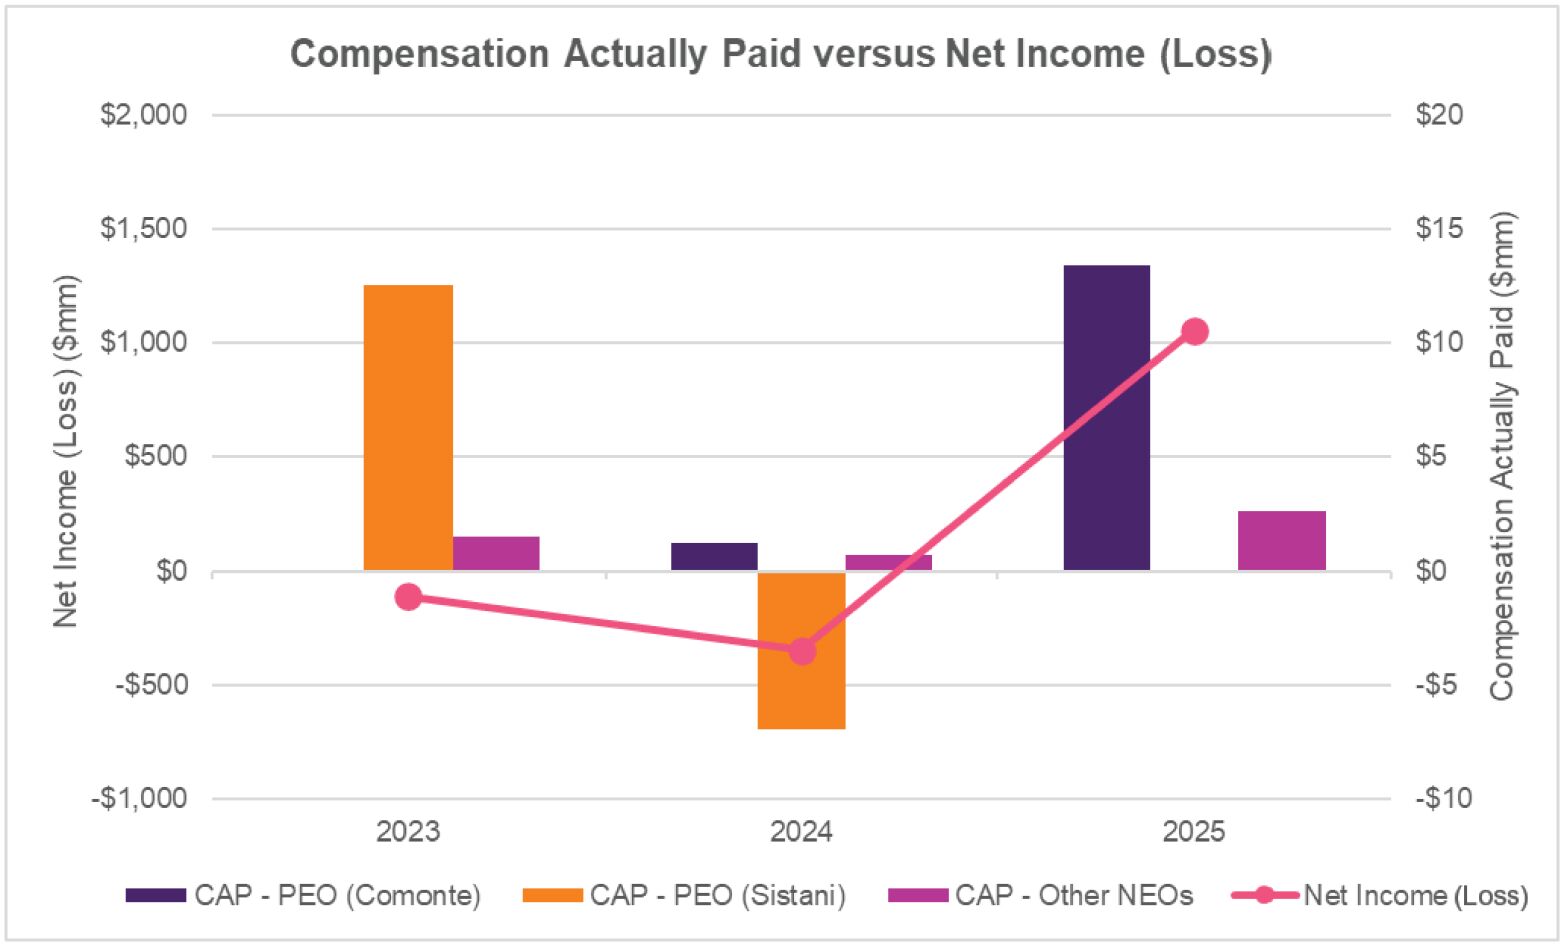
$ | 12,681,801 | $ | 13,413,184 | — | — | $ | 2,519,564 | $ | 2,625,898 | $ | 108 | $ | 1,056.0 | ||||||||||||||||||
2024 |
$ | 994,487 | $ | 1,233,162 | $ | 3,475,350 | ($ | 6,962,509 | ) | $ | 1,129,990 | $ | 687,563 | — | ($ | 345.7 | ) | |||||||||||||||
2023 |
— | — | $ | 8,873,418 | $ | 12,526,695 | $ | 1,401,050 | $ | 1,467,231 | — | ($ | 112.3 | ) | ||||||||||||||||||
| (1) | Ms. Comonte commenced serving as our PEO on September 27, 2024. |
| (2) | The dollar amounts reported in these columns represent the amount of “compensation actually paid” (“CAP”) to our PEOs and the average CAP to our Other NEOs, as computed in accordance with Item 402(v) of Regulation S-K and do not reflect compensation actually realized or received by such individuals. The fair value of PSU awards and Cash Awards were calculated at each valuation date in accordance with FASB ASC Topic 718, based on our cumulative total shareholder return (“TSR”) and were evaluated using a grant date fair value determined by using the Monte Carlo Simulation model on the relevant valuation date and adjusted to reflect actual performance for any completed performance year and an assumption regarding attainment of the performance goals for the remaining performance period. The fair value of RSU and Common Stock awards was calculated at each valuation date in accordance with FASB ASC Topic 718 using the closing price of our Common Stock on the relevant valuation date or, if the market was closed on such date, the last trading day that immediately preceded the relevant valuation date. |
| (3) | Ms. Sistani served as our PEO for the entirety of fiscal 2023 and for the portion of fiscal 2024 preceding Ms. Comonte’s appointment. |
| (4) | The dollar amounts reported in this column represent the average of the total amounts reported for our Other NEOs for each corresponding fiscal year as follows: |
| a. | Fiscal 2025: Jacqueline Cooke and Felicia DellaFortuna |
| b. | Fiscal 2024: Donna Boyer; Jacqueline Cooke; and Heather Stark |
| c. | Fiscal 2023: Heather Stark; Pierre-Olivier Latour; Amanda Tolleson; Michael Colosi; and Michael Lysaght |
| (5) | In connection with our Emergence in June 2025, our post-Emergence Common Stock started trading on June 27, 2025. Accordingly, in reliance on SEC guidance, for purposes of the requirement in Item 402(v)(2)(iv) of Regulation S-K, TSR is being reported using a measurement period from June 27, 2025 through December 31, 2025 and no TSR information is being presented for fiscal 2023, fiscal 2024 or the portion of fiscal 2025 preceding the Emergence. TSR is calculated by dividing (a) the difference between the share price at December 31, 2025 and June 27, 2025 (the beginning of the truncated measurement period), by (b) the share price at as of June 27, 2025. |
To calculate “compensation actually paid” (“CAP”) for our PEO and Other NEOs for fiscal 2025, the following adjustments were made to Summary Compensation Table total pay.
Summary Compensation Table Total ($) |
Deductions from Summary Compensation Table Total ($) |
Additions to Summary Compensation Table Total ($) |
Compensation Actually Paid ($) | |||||
PEO – Tara Comonte | ||||||||
| $12,681,801 | ($5,901,450) | $6,632,833 | $13,413,184 | |||||
Average for Other NEOs indicated above | ||||||||
| $2,519,564 | ($868,820) | $975,154 | $2,625,898 | |||||
Addition of fair value at fiscal year (FY) end, of equity awards granted during the FY that remained outstanding ($) |
Addition of fair value at vesting date, of equity awards granted during the FY that vested during the FY ($) |
Addition of change in fair value at FY end versus prior FY end for awards granted in prior FY that remained outstanding ($) |
Addition of change in fair value at vesting date versus prior FY end for awards granted in prior FY that vested during the FY ($) |
Deduction of the fair value at the prior FY end for awards granted in prior FY that failed to meet their vesting conditions ($) |
Total Equity Adjustments Reflected in Compensation Actually Paid ($) |
|||||||||||||||||||
Chief Executive Officer serving as PEO – Tara Comonte |
||||||||||||||||||||||||
| $ | 6,775,770 | $ | 0 | $ | 0 | ($ | 142,937 | ) | $ | 0 | $ | 6,632,833 | ||||||||||||
Average for Other NEOs indicated above |
||||||||||||||||||||||||
| $ | 997,539 | $ | 0 | $ | 0 | ($ | 22,385 | ) | $ | 0 | $ | 975,154 | ||||||||||||
| (4) | The dollar amounts reported in this column represent the average of the total amounts reported for our Other NEOs for each corresponding fiscal year as follows: |
| a. | Fiscal 2025: Jacqueline Cooke and Felicia DellaFortuna |
| b. | Fiscal 2024: Donna Boyer; Jacqueline Cooke; and Heather Stark |
| c. | Fiscal 2023: Heather Stark; Pierre-Olivier Latour; Amanda Tolleson; Michael Colosi; and Michael Lysaght |
To calculate “compensation actually paid” (“CAP”) for our PEO and Other NEOs for fiscal 2025, the following adjustments were made to Summary Compensation Table total pay.
Summary Compensation Table Total ($) |
Deductions from Summary Compensation Table Total ($) |
Additions to Summary Compensation Table Total ($) |
Compensation Actually Paid ($) | |||||
PEO – Tara Comonte | ||||||||
| $12,681,801 | ($5,901,450) | $6,632,833 | $13,413,184 | |||||
Average for Other NEOs indicated above | ||||||||
| $2,519,564 | ($868,820) | $975,154 | $2,625,898 | |||||
Addition of fair value at fiscal year (FY) end, of equity awards granted during the FY that remained outstanding ($) |
Addition of fair value at vesting date, of equity awards granted during the FY that vested during the FY ($) |
Addition of change in fair value at FY end versus prior FY end for awards granted in prior FY that remained outstanding ($) |
Addition of change in fair value at vesting date versus prior FY end for awards granted in prior FY that vested during the FY ($) |
Deduction of the fair value at the prior FY end for awards granted in prior FY that failed to meet their vesting conditions ($) |
Total Equity Adjustments Reflected in Compensation Actually Paid ($) |
|||||||||||||||||||
Chief Executive Officer serving as PEO – Tara Comonte |
||||||||||||||||||||||||
| $ | 6,775,770 | $ | 0 | $ | 0 | ($ | 142,937 | ) | $ | 0 | $ | 6,632,833 | ||||||||||||
Average for Other NEOs indicated above |
||||||||||||||||||||||||
| $ | 997,539 | $ | 0 | $ | 0 | ($ | 22,385 | ) | $ | 0 | $ | 975,154 | ||||||||||||