The following bar chart shows how the fund’s investment results have varied from year to year, and the following table shows how the fund’s average annual total returns for various periods compare with a broad measure of securities market results and, if applicable, other measures of market results that reflect the fund’s investment universe. This information provides some indication of the risks of investing in the fund. Past investment results (before and after taxes) are not predictive of future investment results. Prior to October 30, 2020, certain fees, such as 12b-1 fees, were not charged on Class 529-F-1 shares. If these expenses had been deducted, results would have been lower. Updated information on the fund’s investment results can be obtained by visiting capitalgroup.com.
The following bar chart shows how the fund’s investment results have varied from year to year, and the following table shows how the fund’s average annual total returns for various periods compare with a broad measure of securities market results and, if applicable, other measures of market results that reflect the fund’s investment universe.
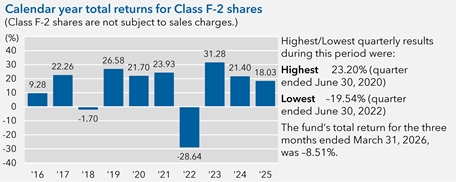
Highest/Lowest quarterly results during this period were:
Highest 23.20% (quarter ended June 30, 2020)
Lowest -19.54% (quarter ended June 30, 2022)
The fund's total return for the three months ended March 31, 2026, was -8.51%.
| Average annual total returns For the periods ended December 31, 2025: | |||||
| Share class | Inception date | 1 year | 5 years | 10 years | Lifetime |
| F-2 − Before taxes | 8/1/2008 | 18.03% | 10.72% | 12.90% | 11.94% |
| − After taxes on distributions | 15.64 | 8.99 | 11.26 | N/A | |
| − After taxes on distributions and sale of fund shares | 12.19 | 8.18 | 10.27 | N/A | |
| Share classes (before taxes) | Inception date | 1 year | 5 years | 10 years | Lifetime |
| A (with maximum sales charge) | 5/1/1967 | 10.99% | 9.17% | 12.00% | 11.52% |
| C | 3/15/2001 | 15.90 | 9.65 | 11.97 | 8.77 |
| F-1 | 3/16/2001 | 17.72 | 10.43 | 12.60 | 9.10 |
| F-3 | 1/27/2017 | 18.17 | 10.84 | N/A | 13.04 |
| 529-A (with maximum sales charge) | 2/15/2002 | 13.62 | 9.65 | 12.20 | 9.31 |
| 529-C | 2/19/2002 | 15.84 | 9.60 | 12.18 | 9.36 |
| 529-E | 3/7/2002 | 17.46 | 10.18 | 12.35 | 9.03 |
| 529-F-1 | 9/17/2002 | 17.93 | 10.63 | 12.83 | 10.78 |
| 529-F-2 | 10/30/2020 | 18.02 | 10.72 | N/A | 13.36 |
| 529-F-3 | 10/30/2020 | 18.10 | 10.78 | N/A | 13.42 |
| R-1 | 6/26/2002 | 16.87 | 9.64 | 11.79 | 9.28 |
| R-2 | 5/21/2002 | 16.85 | 9.62 | 11.79 | 8.78 |
| R-2E | 8/29/2014 | 17.22 | 9.95 | 12.13 | 10.77 |
| R-3 | 6/4/2002 | 17.38 | 10.12 | 12.29 | 9.43 |
| R-4 | 5/20/2002 | 17.72 | 10.45 | 12.63 | 9.56 |
| R-5E | 11/20/2015 | 17.95 | 10.67 | 12.86 | 12.48 |
| R-5 | 5/15/2002 | 18.08 | 10.78 | 12.97 | 9.87 |
| R-6 | 5/1/2009 | 18.14 | 10.84 | 13.02 | 14.22 |
| Indexes | 1 year | 5 years | 10 years | Lifetime (from Class F-2 inception) |
| S&P 500 Index (reflects no deductions for sales charges, account fees, expenses or U.S. federal income taxes) | 17.88% | 14.42% | 14.82% | 12.35% |
After-tax returns are shown only for Class F-2 shares; after-tax returns for other share classes will vary. After-tax returns are calculated using the highest individual federal income tax rates in effect during each year of the periods shown and do not reflect the impact of state and local taxes. Your actual after-tax returns depend on your individual tax situation and likely will differ from the results shown above. In addition, after-tax returns are not relevant if you hold your fund shares through a tax-favored arrangement, such as a 401(k) plan, individual retirement account (IRA) or 529 college savings plan.