The following bar chart and table are intended to help you understand the risks of investing in the Fund. The bar chart shows calendar year returns and the average annual total return table indicates risk by illustrating how much returns can differ from one year to the next and how fund performance compares with that of a broad-based securities market index. These figures assume that all distributions are reinvested. The Fund’s performance will fluctuate, and past performance (before and after taxes) is no guarantee of future results. Updated performance information may be obtained on our website www.sheltoncap.com or by calling (800) 955-9988.
On June 21, 2019, the Cedar Ridge Unconstrained Credit Fund (the “Predecessor Fund”) was reorganized into the Fund. All historic performance and financial information for prior to the reorganization is that of the Predecessor Fund, which was the accounting and performance survivor of the reorganization. Historic information for periods prior to the reorganization for the Institutional Class and Investor Classes shares is based on that of the Institutional and Investor Class shares, respectively, of the Predecessor Fund.
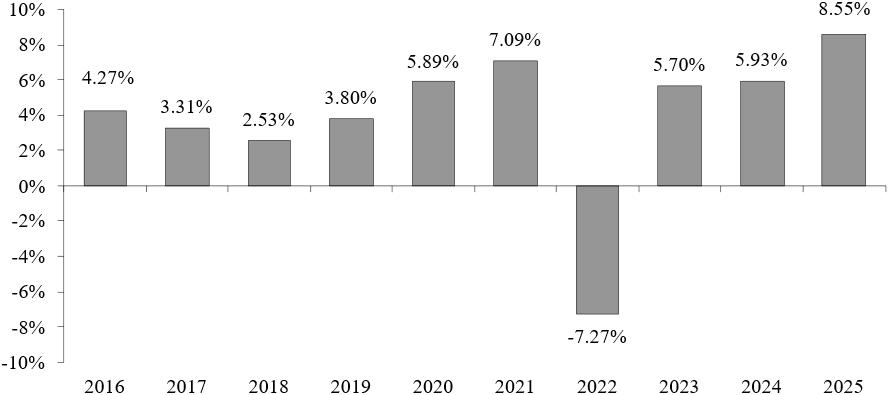
Best Quarter: 10.30% (Q2, )
Worst Quarter: -14.18% (Q1, )
Date of inception: 12/12/2013
The returns above are for the Institutional share class of the Fund. The Investor shares would have substantially similar annual returns to the Institutional share class because the classes are invested in the same portfolio securities. The Investor share class’s returns will be lower over the long-term when compared to the Institutional share class’s returns to the extent that the Institutional share class has lower expenses.
After-tax returns are calculated using the historical highest individual federal marginal income tax rates and do not reflect the impact of state and local taxes. Actual after-tax returns depend on the investor’s tax situation and may differ from those shown, and the after-tax returns shown are not relevant to investors who hold their Fund shares through tax-advantaged arrangements such as 401(k) plans or individual retirement accounts.
| Average Annual Return (for the period ended 12/31/25) Shelton Tactical Credit Fund |
1 year | 5 year | 10 year | |
| Institutional Shares: DEBIX | ||||
| Return Before Taxes | 8.55% | 3.83% | 3.89% | |
| Return After Taxes on Distributions | 6.50% | 2.19% | 2.35% | |
| Return After Taxes on Distributions and Sale of Fund Shares | 5.35% | 2.28% | 2.36% | |
| Investor Shares: DEBTX | ||||
| Return Before Taxes | 8.21% | 3.56% | 3.63% | |
| Bloomberg U.S. Aggregate Bond Index | 7.30% | -0.36% | 2.01% |
It is not possible for individuals to invest directly in an index. Performance figures for an index do not reflect deductions for sales charges, commissions, expenses or taxes.
The following bar chart and table are intended to help you understand the risks of investing in the Fund. The bar chart shows calendar year returns and the average annual total return table indicates risk by illustrating how much returns can differ from one year to the next and how fund performance compares with that of the MSCI All-Country World Ex USA Index, a broad-based securities market index, and the MSCI All-Country World Ex USA Small Cap Index, an additional index that is representative of the Fund’s investment strategy. These figures assume that all distributions are reinvested. The Fund’s performance will fluctuate, and past performance (before and after taxes) is no guarantee of future results. Updated performance information may be obtained on our website www.sheltoncap.com or by calling (800) 955-9988.
On July 28, 2017, the Shelton International Select Equity Fund (the “Predecessor Fund”) was reorganized into the Fund. All historic performance and financial information for prior to the reorganization is that of the Predecessor Fund, which was the accounting and performance survivor of the reorganization. Historic information for periods prior to the reorganization for the Institutional Class and Investor Classes shares is based on that of the Class I shares and Class A shares, respectively, of the Predecessor Fund.
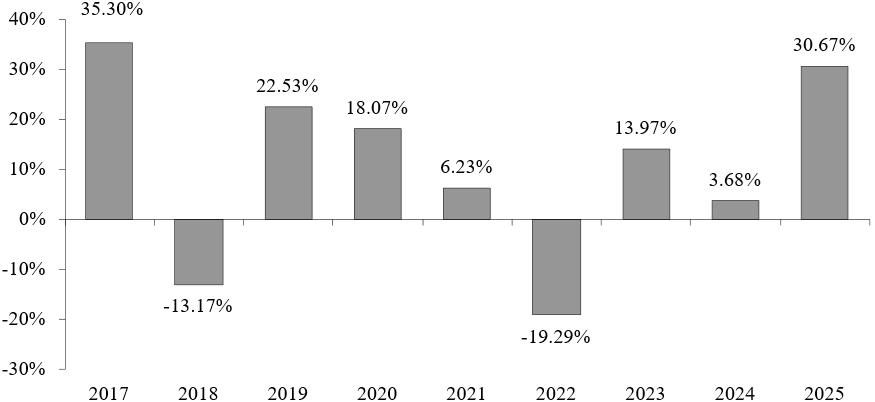
Best Quarter: 17.55% (Q2, )
Worst Quarter: -19.21% (Q1, )
Date of inception: 07/18/2016
The returns above are for the Institutional share class of the Fund. The Investor shares would have substantially similar annual returns to the Institutional share class because the classes are invested in the same portfolio securities. The Investor share class’s returns will be lower over the long-term when compared to the Institutional share class’s returns to the extent that the Institutional share class has lower expenses.
After-tax returns are calculated using the historical highest individual federal marginal income tax rates and do not reflect the impact of state and local taxes. Actual after-tax returns depend on the investor’s tax situation and may differ from those shown, and the after-tax returns shown are not relevant to investors who hold their Fund shares through tax-advantaged arrangements such as 401(k) plans or individual retirement accounts.
| Average Annual Return (for the period ended 12/31/25) Shelton International Select Equity Fund |
1 year | 5 year | Period from Inception* | |||||||||
| Institutional Shares: SISEX | ||||||||||||
| Return Before Taxes | 30.67 | % | 5.77 | % | 8.98 | % | ||||||
| Return After Taxes on Distributions | 29.83 | % | 4.75 | % | 8.11 | % | ||||||
| Return After Taxes on Distributions and Sale of Fund Shares | 19.32 | % | 4.14 | % | 7.09 | % | ||||||
| Investor Shares: SISLX | ||||||||||||
| Return Before Taxes | 30.33 | % | 5.51 | % | 8.70 | % | ||||||
| MSCI All-Country World Ex USA Index (1) | 32.39 | % | 7.90 | % | 8.67 | % | ||||||
| MSCI All-Country World Ex USA Small Cap Index | 29.87 | % | 7.38 | % | 8.77 | % | ||||||
| * Inception date: 07/18/2016 | ||||||||||||
| (1) | The MSCI All-Country World Ex USA Index is a free float-adjusted market capitalization index that is designed to measure developed and developing market equity performance, excluding the U.S. MSCI, Inc. publishes two versions of this Index reflecting the reinvestment of dividends using two different methodologies: gross dividends and net dividends. While both versions reflect reinvested dividends, they differ with respect to the manner in which taxes associated with dividend payments are treated. In calculating the gross dividends version, MSCI reinvests as much as possible of a company’s dividend distributions. The reinvested amount is equal to the total dividend amount distributed to persons residing in the country of the dividend-paying company. Gross total return indexes do not, however, include any tax credits. In calculating the net dividends version, MSCI incorporates reinvested dividends applying the withholding tax rate applicable to foreign non-resident institutional investors that do not benefit from double taxation treaties. |
It is not possible for individuals to invest directly in an index. Performance figures for an index do not reflect deductions for sales charges, commissions, expenses or taxes.
The following bar chart and table are intended to help you understand the risks of investing in the Fund. The bar chart shows calendar year returns and the average annual total return table indicates risk by illustrating how much returns can differ from one year to the next and how fund performance compares with that of a broad-based securities market index. These figures assume that all distributions are reinvested. The Fund’s performance will fluctuate, and past performance (before and after taxes) is no guarantee of future results. Updated performance information may be obtained on our website www.sheltoncap.com or by calling (800) 955-9988.
The Shelton Emerging Markets Fund of SCM Trust is the successor fund to the ICON Emerging Markets Fund (the “Predecessor Fund”), which was reorganized into the Shelton Emerging Markets Fund June 26, 2020. All historic performance and financial information for prior to the Reorganization is that of the Predecessor Fund, which was the accounting and performance survivor of the reorganization. Historic information for prior to the Reorganization for the Institutional Class and Investor Class shares is based on that of the Class S and Class A shares, respectively, of the Predecessor Fund.
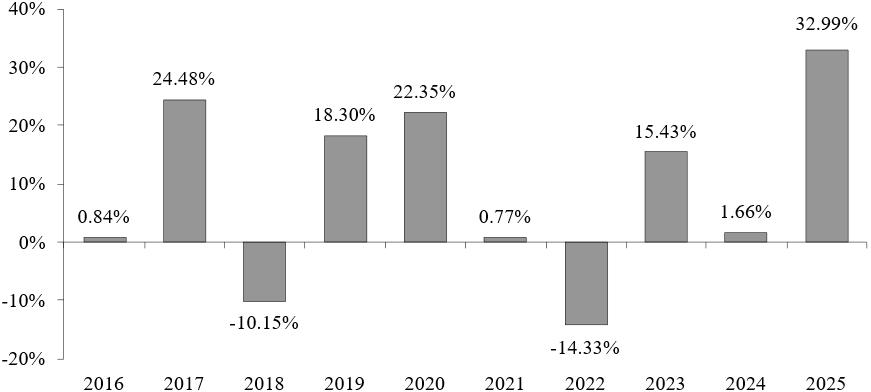
Best Quarter: 31.29% (Q4, )
Worst Quarter: -28.27% (Q1, )
Date of inception: 2/25/1997
The returns above are for the Institutional share class of the Fund. The Investor shares would have substantially similar annual returns to the Institutional share class because the classes are invested in the same portfolio securities. The Investor share class’s returns will be lower over the long-term when compared to the Institutional share class’s returns to the extent that the Institutional share class has lower expenses.
After-tax returns are calculated using the historical highest individual federal marginal income tax rates and do not reflect the impact of state and local taxes. Actual after-tax returns depend on the investor’s tax situation and may differ from those shown, and the after-tax returns shown are not relevant to investors who hold their Fund shares through tax-advantaged arrangements such as 401(k) plans or individual retirement accounts.
| Average Annual Return (for the period ended 12/31/25) Shelton Emerging Markets Fund |
1 year | 5 year | 10 year | |||||||||
| Institutional Shares: EMSQX | ||||||||||||
| Return Before Taxes | 32.99 | % | 6.14 | % | 8.20 | % | ||||||
| Return After Taxes on Distributions | 27.39 | % | 4.07 | % | 6.99 | % | ||||||
| Return After Taxes on Distributions and Sale of Fund Shares | 22.21 | % | 4.18 | % | 6.43 | % | ||||||
| Investor Shares: EMSLX | ||||||||||||
| Return Before Taxes | 32.63 | % | 5.87 | % | 7.93 | % | ||||||
| MSCI Emerging Markets Index | 33.57 | % | 4.19 | % | 8.41 | % | ||||||
It is not possible for individuals to invest directly in an index. Performance figures for an index do not reflect deductions for sales charges, commissions, expenses or taxes.
When the Fund has completed a full calendar year of investment operations, this section will include charts that show annual total returns, highest and lowest quarterly returns and average annual total returns (before and after taxes) compared to a benchmark selected for the Fund. Updated performance is available on the Fund’s website www.sheltoncap.com or by calling (800) 955-9988.
The following bar chart and table are intended to help you understand the risks of investing in the Fund. The bar chart shows calendar year returns and the average annual total return table indicates risk by illustrating how much returns can differ from one year to the next and how fund performance compares with that of a broad-based securities market index. These figures assume that all distributions are reinvested. The Fund’s performance will fluctuate, and past performance (before and after taxes) is no guarantee of future results. Updated performance information may be obtained on our website www.iconfunds.com or by calling (800) 764-0442.
The ICON Equity Income Fund of SCM Trust is the successor fund to two funds of ICON Funds trust, the ICON Equity Income Fund (the “Predecessor Equity Income Fund”) and the ICON Risk-Managed Balanced Fund (the “Predecessor Risk-Managed Fund”). The Predecessor Equity Income Fund was reorganized into a new series of SCM Trust as the ICON Equity Income Fund (the “Successor Fund”) after the close of business on July 10, 2020, and the Predecessor Risk-Managed Fund was reorganized into the Successor Fund after the close of business on September 25, 2020. All historic performance and financial information for prior to the reorganization is that of the Predecessor Equity Income Fund, which was the accounting and performance survivor of each reorganization. Historic information for prior to the reorganization for the Institutional Class and Investor Classes shares is based on that of the Class S and Class A shares, respectively, of the Predecessor Equity Income Fund.
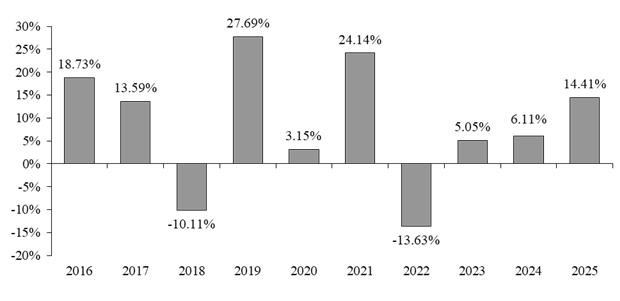
Best Quarter: 17.25% (Q4, )
Worst Quarter: -28.91% (Q1, )
Date of inception: 11/8/2002
The returns above are for the Institutional share class of the Fund. The Investor shares would have substantially similar annual returns to the Institutional share class because the classes are invested in the same portfolio securities. The Investor share class’s returns will be lower over the long-term when compared to the Institutional share class’s returns to the extent that the Institutional share class has lower expenses.
After-tax returns are calculated using the historical highest individual federal marginal income tax rates and do not reflect the impact of state and local taxes. Actual after-tax returns depend on the investor’s tax situation and may differ from those shown, and the after-tax returns shown are not relevant to investors who hold their Fund shares through tax-advantaged arrangements such as 401(k) plans or individual retirement accounts.
| Average Annual Return (for the period ended 12/31/25) | ||||||||||||
| ICON Equity Income Fund | 1 year | 5 year | 10 year | |||||||||
| Institutional Shares: IOEZX | ||||||||||||
| Return Before Taxes | 14.41 | % | 6.44 | % | 8.12 | % | ||||||
| Return After Taxes on Distributions | 12.84 | % | 3.97 | % | 5.16 | % | ||||||
| Return After Taxes on Distributions and Sale of Fund Shares | 9.02 | % | 4.18 | % | 4.86 | % | ||||||
| Investor Shares: IEQAX | ||||||||||||
| Return Before Taxes | 14.13 | % | 6.18 | % | 7.85 | % | ||||||
| S&P 1500 Index | 17.02 | % | 13.95 | % | 14.45 | % | ||||||
It is not possible for individuals to invest directly in an index. Performance figures for an index do not reflect deductions for sales charges, commissions, expenses or taxes.
The following bar chart and table are intended to help you understand the risks of investing in the Fund. The bar chart shows calendar year returns and the average annual total return table indicates risk by illustrating how much returns can differ from one year to the next and how fund performance compares with that of the U.S. Aggregate Bond Index, a broad-based securities market index, and the Bloomberg U.S. Universal ex MBS Total Return Index Value Hedged USD, an index more representative of the Fund’s investment strategy. These figures assume that all distributions are reinvested. The Fund’s performance will fluctuate, and past performance (before and after taxes) is no guarantee of future results. Updated performance information may be obtained on our website www.iconfunds.com or by calling (800) 764-0442.
The ICON Flexible Bond Fund of SCM Trust is the successor fund to the ICON Flexible Income Fund of ICON Funds trust (the “Predecessor Fund”). The Predecessor Fund was reorganized into a new series of SCM Trust as the ICON Flexible Bond Fund after the close of business on July 10, 2020. All historic performance and financial information for prior to the reorganization is that of the Predecessor Fund, which was the accounting and performance survivor of the reorganization. Historic information for prior to the reorganization for the Institutional Class and Investor Classes shares is based on that of the Class S and Class A shares, respectively, of the Predecessor Fund.
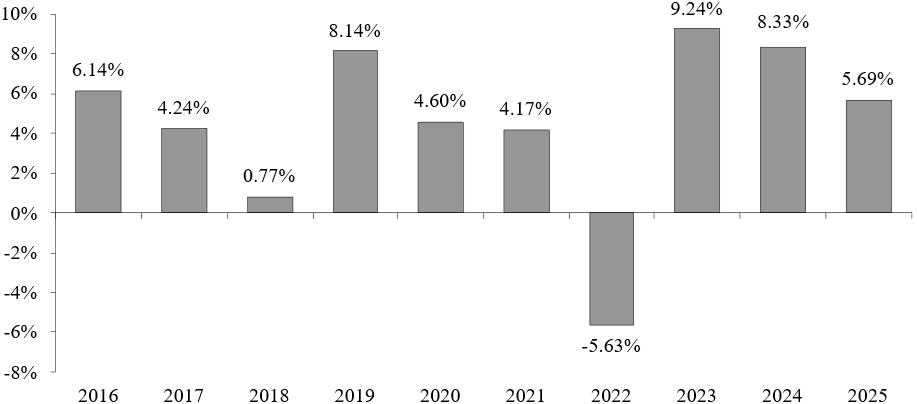
Best Quarter: 8.06% (Q2, )
Worst Quarter: -9.96% (Q1, )
Date of inception: 10/21/2002
The returns above are for the Institutional share class of the Fund. The Investor shares would have substantially similar annual returns to the Institutional share class because the classes are invested in the same portfolio securities. The Investor share class’s returns will be lower over the long-term when compared to the Institutional share class’s returns to the extent that the Institutional share class has lower expenses.
After-tax returns are calculated using the historical highest individual federal marginal income tax rates and do not reflect the impact of state and local taxes. Actual after-tax returns depend on the investor’s tax situation and may differ from those shown, and the after-tax returns shown are not relevant to investors who hold their Fund shares through tax-advantaged arrangements such as 401(k) plans or individual retirement accounts.
| Average Annual Return (for the period ended 12/31/25) | ||||||||||||
| ICON Flexible Bond Fund | 1 year | 5 year | 10 year | |||||||||
| Institutional Shares: IOBZX | ||||||||||||
| Return Before Taxes | 5.69 | % | 4.22 | % | 4.48 | % | ||||||
| Return After Taxes on Distributions | 3.11 | % | 1.94 | % | 1.43 | % | ||||||
| Return After Taxes on Distributions and Sale of Fund Shares | 3.54 | % | 2.28 | % | 1.55 | % | ||||||
| Investor Shares: IOBAX | ||||||||||||
| Return Before Taxes | 5.47 | % | 4.00 | % | 4.23 | % | ||||||
| Bloomberg U.S. Aggregate Bond Index | 7.30 | % | -0.36 | % | 2.01 | % | ||||||
| Bloomberg U.S. Universal ex MBS Total Return Index Value Hedged USD | 7.31 | % | 0.02 | % | 2.68 | % | ||||||
It is not possible for individuals to invest directly in an index. Performance figures for an index do not reflect deductions for sales charges, commissions, expenses or taxes.
The following bar chart and table are intended to help you understand the risks of investing in the Fund. The bar chart shows calendar year returns and the average annual total return table indicates risk by illustrating how much returns can differ from one year to the next and how fund performance compares with that of a broad-based securities market index. These figures assume that all distributions are reinvested. The Fund’s performance will fluctuate, and past performance (before and after taxes) is no guarantee of future results. Updated performance information may be obtained on our website www.iconfunds.com or by calling (800) 764-0442.
The ICON Equity Fund of SCM Trust is the successor fund to three funds of ICON Funds trust, the ICON Fund, the ICON Long/Short Fund, and the ICON Opportunities Fund (the “Predecessor Funds”). The Predecessor Funds were reorganized into a new series of SCM Trust as the ICON Equity Fund after the close of business on July 10, 2020. All historic performance and financial information for prior to the reorganization is that of the predecessor ICON Long/Short Fund, which was the accounting and performance survivor of each reorganization. Historic information for prior to the reorganization for the Institutional Class and Investor Classes shares is based on that of the Class S and Class A shares, respectively, of the predecessor ICON Long/Short Fund.
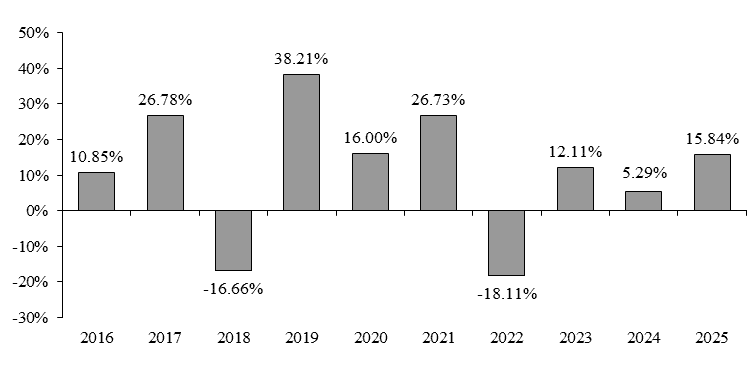
Best Quarter: 22.91% (Q2, )
Worst Quarter: -28.51% (Q1, )
Date of inception: 10/17/2002
The returns above are for the Institutional share class of the Fund. The Investor shares would have substantially similar annual returns to the Institutional share class because the classes are invested in the same portfolio securities. The Investor share class’s returns will be lower over the long-term when compared to the Institutional share class’s returns to the extent that the Institutional share class has lower expenses.
After-tax returns are calculated using the historical highest individual federal marginal income tax rates and do not reflect the impact of state and local taxes. Actual after-tax returns depend on the investor’s tax situation and may differ from those shown, and the after-tax returns shown are not relevant to investors who hold their Fund shares through tax-advantaged arrangements such as 401(k) plans or individual retirement accounts.
Average Annual Return (for the period ended 12/31/25)
ICON Equity Fund | 1 year | 5 year | 10 year | |||||||||
| Institutional Shares: IOLZX | ||||||||||||
| Return Before Taxes | 15.84 | % | 7.23 | % | 10.29 | % | ||||||
| Return After Taxes on Distributions | 13.16 | % | 4.72 | % | 8.88 | % | ||||||
| Return After Taxes on Distributions and Sale of Fund Shares | 11.48 | % | 5.41 | % | 8.49 | % | ||||||
| Investor Shares: ISTAX | ||||||||||||
| Return Before Taxes | 15.55 | % | 6.97 | % | 10.00 | % | ||||||
| S&P 1500 Index | 17.02 | % | 13.95 | % | 14.45 | % | ||||||
It is not possible for individuals to invest directly in an index. Performance figures for an index do not reflect deductions for sales charges, commissions, expenses or taxes.
The following bar chart and table are intended to help you understand the risks of investing in the Fund. The bar chart shows calendar year returns and the average annual total return table indicates risk by illustrating how much returns can differ from one year to the next and how fund performance compares with that of the S&P 1500 Index, a broad-based securities market index, and the S&P 1500 Financials Index, an index more representative of the Fund’s investment strategy. These figures assume that all distributions are reinvested. The Fund’s performance will fluctuate, and past performance (before and after taxes) is no guarantee of future results. Updated performance information may be obtained on our website www.iconfunds.com or by calling (800) 764-0442.
The ICON Consumer Select Fund of SCM Trust is the successor fund to three funds of ICON Funds trust, the ICON Consumer Discretionary Fund (the “Predecessor Consumer Discretionary Fund”), the ICON Financial Fund (the “Predecessor Financial Fund”) and the ICON Consumer Staples Fund (the “Predecessor Consumer Staples Fund”). The Predecessor Consumer Discretionary Fund and the Predecessor Financial Fund were reorganized into a new series of SCM Trust as the ICON Consumer Select Fund after the close of business on July 10, 2020, and the Predecessor Consumer Staples Fund was reorganized into the Successor Fund after the close of business on July 31, 2020. All historic performance and financial information for prior to the organization is that of the Predecessor Financial Fund which was the accounting and performance survivor of each reorganization. Historic information for prior to the reorganization for the Institutional Class and Investor Classes shares is based on that of the Class S and Class A shares, respectively, of the Predecessor Financial Fund.
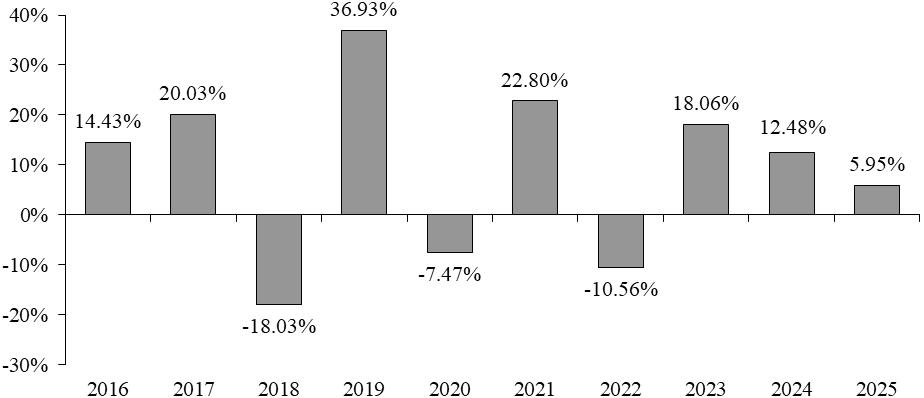
Best Quarter: 18.46% ()
Worst Quarter: -36.93% ()
Date of inception: 07/1/1997
The returns above are for the Institutional share class of the Fund. The Investor shares would have substantially similar annual returns to the Institutional share class because the classes are invested in the same portfolio securities. The Investor share class’s returns will be lower over the long-term when compared to the Institutional share class’s returns to the extent that the Institutional share class has lower expenses.
After-tax returns are calculated using the historical highest individual federal marginal income tax rates and do not reflect the impact of state and local taxes. Actual after-tax returns depend on the investor’s tax situation and may differ from those shown, and the after-tax returns shown are not relevant to investors who hold their Fund shares through tax-advantaged arrangements such as 401(k) plans or individual retirement accounts.
Average Annual Return (for the period ended 12/31/25) ICON Consumer Select Fund | 1 year | 5 year | 10 year | |||||||||
| Institutional Shares: ICFSX | ||||||||||||
| Return Before Taxes | 5.95 | % | 9.09 | % | 8.23 | % | ||||||
| Return After Taxes on Distributions | 3.73 | % | 6.46 | % | 6.61 | % | ||||||
| Return After Taxes on Distributions and Sale of Fund Shares | 5.51 | % | 7.04 | % | 6.48 | % | ||||||
| Investor Shares: ICFAX | ||||||||||||
| Return Before Taxes | 5.74 | % | 8.81 | % | 7.92 | % | ||||||
| S&P 1500 Index | 17.02 | % | 13.95 | % | 14.45 | % | ||||||
| S&P 1500 Financials Index | 14.34 | % | 14.90 | % | 12.90 | % | ||||||
It is not possible for individuals to invest directly in an index. Performance figures for an index do not reflect deductions for sales charges, commissions, expenses or taxes.
The following bar chart and table are intended to help you understand the risks of investing in the Fund. The bar chart shows calendar year returns and the average annual total return table indicates risk by illustrating how much returns can differ from one year to the next and how fund performance compares with that of the S&P 1500 Index, a broad-based securities market index, and the S&P North American Natural Resources Index, an index more representative of the Fund’s investment strategy. These figures assume that all distributions are reinvested. The Fund’s performance will fluctuate, and past performance (before and after taxes) is no guarantee of future results. Updated performance information may be obtained on our website www.iconfunds.com or by calling (800) 764-0442.
The ICON Natural Resources and Infrastructure Fund of SCM Trust is the successor fund to three funds of ICON Funds trust, the ICON Energy Fund, the ICON Industrials Fund, and the ICON Natural Resources Fund (the “Predecessor Funds”). The Predecessor Funds were reorganized into a new series of SCM Trust as the ICON Natural Resources and Infrastructure Fund after the close of business on July 10, 2020. All historic performance and financial information for prior to the reorganization is that of the predecessor ICON Natural Resources Fund which was the accounting and performance survivor of each reorganization. Historic information for prior to the reorganization for the Institutional Class and Investor Classes shares is based on that of the Class S and Class A shares, respectively, of the predecessor ICON Natural Resources Fund.
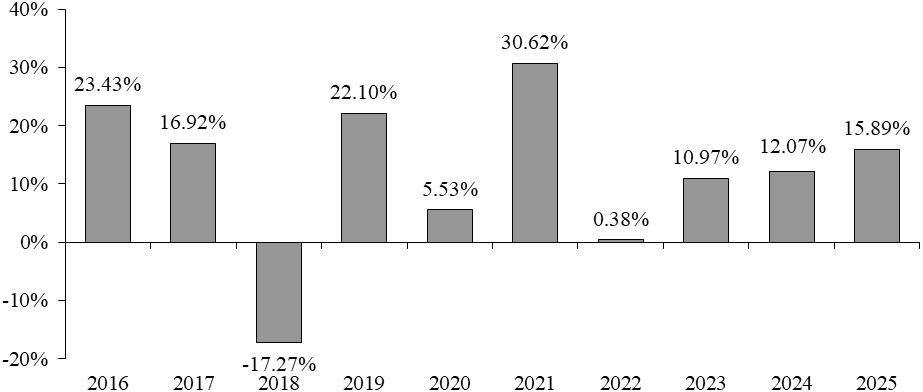
Best Quarter: 21.44% ()
Worst Quarter: -32.95% ()
Date of inception: 05/05/1997
The returns above are for the Institutional share class of the Fund. The Investor shares would have substantially similar annual returns to the Institutional share class because the classes are invested in the same portfolio securities. The Investor share class’s returns will be lower over the long-term when compared to the Institutional share class’s returns to the extent that the Institutional share class has lower expenses.
After-tax returns are calculated using the historical highest individual federal marginal income tax rates and do not reflect the impact of state and local taxes. Actual after-tax returns depend on the investor’s tax situation and may differ from those shown, and the after-tax returns shown are not relevant to investors who hold their Fund shares through tax-advantaged arrangements such as 401(k) plans or individual retirement accounts.
Average Annual Return (for the period ended 12/31/25) ICON Natural Resources and Infrastructure Fund | 1 year | 5 year | 10 year | |||||||||
| Institutional Shares: ICBMX | ||||||||||||
| Return Before Taxes | 15.89 | % | 13.57 | % | 11.26 | % | ||||||
| Return After Taxes on Distributions | 12.80 | % | 11.32 | % | 9.11 | % | ||||||
| Return After Taxes on Distributions and Sale of Fund Shares | 10.87 | % | 10.45 | % | 8.44 | % | ||||||
| Investor Shares: ICBAX | ||||||||||||
| Return Before Taxes | 15.89 | % | 13.57 | % | 11.26 | % | ||||||
| S&P 1500 Index | 17.02 | % | 13.95 | % | 14.45 | % | ||||||
| S&P North American Natural Resources Index | 21.11 | % | 20.54 | % | 23.87 | % | ||||||
It is not possible for individuals to invest directly in an index. Performance figures for an index do not reflect deductions for sales charges, commissions, expenses or taxes.
The following bar chart and table are intended to help you understand the risks of investing in the Fund. The bar chart shows calendar year returns and the average annual total return table indicates risk by illustrating how much returns can differ from one year to the next and how fund performance compares with that of the S&P 1500 Index, a broad-based securities market index, and the S&P 1500 Information Technology Index, an index more representative of the Fund’s investment strategy. These figures assume that all distributions are reinvested. The Fund’s performance will fluctuate, and past performance (before and after taxes) is no guarantee of future results. Updated performance information may be obtained on our website www.iconfunds.com or by calling (800) 764-0442.
The ICON Health and Information Technology Fund of SCM Trust is the successor fund to two funds of ICON Funds trust, the ICON Information Technology Fund, and the ICON Healthcare Fund (the “Predecessor Funds”). The Predecessor Funds were reorganized into a new series of SCM Trust as the ICON Health and Information Technology after the close of business on July 10, 2020. All historic performance and financial information for prior to the reorganization is that of the predecessor ICON Information Technology Fund which was the accounting and performance survivor of each reorganization. Historic information for prior to the reorganization for the Institutional Class and Investor Classes shares is based on that of the Class S and Class A shares, respectively, of the predecessor ICON Information Technology Fund.
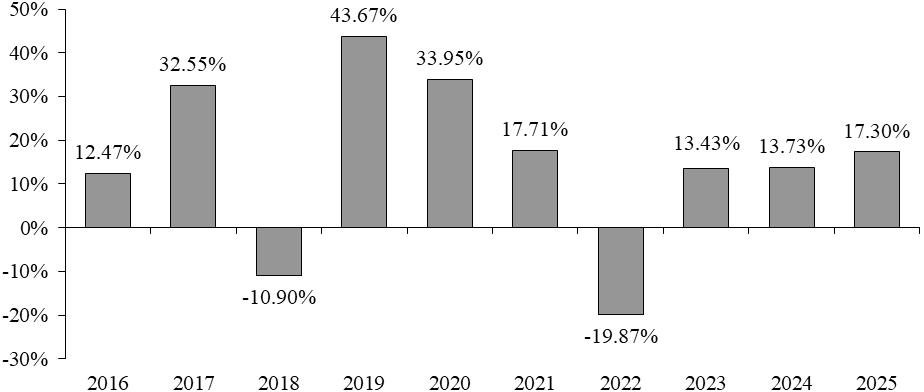
Best Quarter: 28.62% ()
Worst Quarter: -18.55% ()
Date of inception: 02/19/1997
The returns above are for the Institutional share class of the Fund. The Investor shares would have substantially similar annual returns to the Institutional share class because the classes are invested in the same portfolio securities. The Investor share class’s returns will be lower over the long-term when compared to the Institutional share class’s returns to the extent that the Institutional share class has lower expenses.
After-tax returns are calculated using the historical highest individual federal marginal income tax rates and do not reflect the impact of state and local taxes. Actual after-tax returns depend on the investor’s tax situation and may differ from those shown, and the after-tax returns shown are not relevant to investors who hold their Fund shares through tax-advantaged arrangements such as 401(k) plans or individual retirement accounts.
Average Annual Return (for the period ended 12/31/25) ICON Health and Information Technology Fund | 1 year | 5 year | 10 year | |||||||||
| Institutional Shares: ICTEX | ||||||||||||
| Return Before Taxes | 17.30 | % | 7.38 | % | 13.82 | % | ||||||
| Return After Taxes on Distributions | 12.92 | % | 4.37 | % | 10.50 | % | ||||||
| Return After Taxes on Distributions and Sale of Fund Shares | 13.98 | % | 5.40 | % | 10.58 | % | ||||||
| Investor Shares: ICTTX | ||||||||||||
| Return Before Taxes | 17.06 | % | 7.11 | % | 13.51 | % | ||||||
| S&P 1500 Index | 17.02 | % | 13.95 | % | 14.45 | % | ||||||
| S&P 1500 Information Technology Index | 23.81 | % | 20.48 | % | 23.87 | % | ||||||
It is not possible for individuals to invest directly in an index. Performance figures for an index do not reflect deductions for sales charges, commissions, expenses or taxes.
The following bar chart and table are intended to help you understand the risks of investing in the Fund. The bar chart shows calendar year returns and the average annual total return table indicates risk by illustrating how much returns can differ from one year to the next and how fund performance compares with that of the S&P 1500 Index, a broad-based securities market index, and the S&P 1500 Utilities Index, an index more representative of the Fund’s investment strategy. These figures assume that all distributions are reinvested. The Fund’s performance will fluctuate, and past performance (before and after taxes) is no guarantee of future results. Updated performance information may be obtained on our website www.iconfunds.com or by calling (800) 764-0442.
The ICON Utilities and Income Fund of SCM Trust is the successor fund to a series of ICON Funds trust, the ICON Utilities Fund (the “Predecessor Fund”). The Predecessor Fund was reorganized into a new series of SCM Trust as the ICON Utilities and Income Fund after the close of business on July 10, 2020. All historic performance and financial information for prior to the reorganization is that of the predecessor ICON Utilities Fund which was the accounting and performance survivor of the reorganization. Historic information for prior to the reorganization for the Institutional Class and Investor Classes shares is based on that of the Class A and Class S shares, respectively, of the predecessor ICON Utilities Fund.
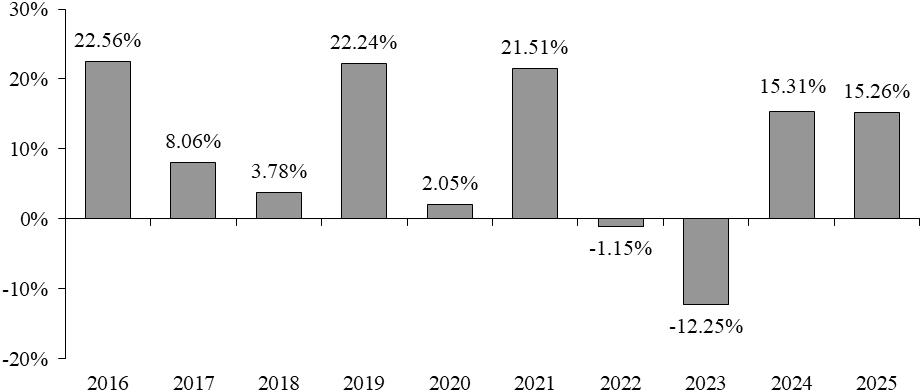
Best Quarter: 17.29% ()
Worst Quarter: -17.64% ()
Date of inception: 07/09/1997
The returns above are for the Institutional share class of the Fund. The Investor shares would have substantially similar annual returns to the Institutional share class because the classes are invested in the same portfolio securities. The Investor share class’s returns will be lower over the long-term when compared to the Institutional share class’s returns to the extent that the Institutional share class has lower expenses.
After-tax returns are calculated using the historical highest individual federal marginal income tax rates and do not reflect the impact of state and local taxes. Actual after-tax returns depend on the investor’s tax situation and may differ from those shown, and the after-tax returns shown are not relevant to investors who hold their Fund shares through tax-advantaged arrangements such as 401(k) plans or individual retirement accounts.
Average Annual Return (for the period ended 12/31/25) ICON Utilities and Income Fund | 1 year | 5 year | 10 year | |||||||||
| Institutional Shares: ICTUX | ||||||||||||
| Return Before Taxes | 15.26 | % | 6.97 | % | 9.16 | % | ||||||
| Return After Taxes on Distributions | 14.45 | % | 5.42 | % | 6.25 | % | ||||||
| Return After Taxes on Distributions and Sale of Fund Shares | 9.60 | % | 5.02 | % | 5.80 | % | ||||||
| Investor Shares: ICTVX | ||||||||||||
| Return Before Taxes | 14.91 | % | 6.72 | % | 8.88 | % | ||||||
| S&P 1500 Index | 17.02 | % | 13.95 | % | 14.45 | % | ||||||
| S&P 1500 Utilities Index | 16.09 | % | 9.67 | % | 10.49 | % | ||||||
It is not possible for individuals to invest directly in an index. Performance figures for an index do not reflect deductions for sales charges, commissions, expenses or taxes.