The bar chart and performance table shown below provide some indication of the risks and variability of investing in the Ave Maria Growth Fund by showing the Fund’s performance from year to year for each of the last ten calendar years, and by showing how the Fund’s average annual total returns for the 1-, 5- and 10-year periods ended December 31, 2025 compare with the S&P 500® Index. The S&P 500 Equal Weight® Index (consisting of the stocks in the S&P 500® Index with a fixed weight allocation) is included as a secondary index because it is more representative of the Fund’s asset allocations than the S&P 500® Index. How the Fund has performed in the past (before and after taxes) is not necessarily an indication of how the Fund will perform in the future. Updated performance information, current through the most recent month end, is available on the Fund’s website (www.avemariafunds.com) or by calling 1-888-726-9331.
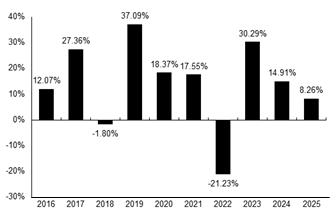
During the periods shown in the bar chart, the highest return for a quarter was 24.35% during the quarter ended June 30, 2020, and the lowest return for a quarter was -20.45% during the quarter ended March 31, 2020.
After-tax returns are calculated using the historical highest individual federal marginal income tax rates and do not reflect the impact of state and local taxes. Actual after-tax returns depend on an investor’s tax situation and may differ from those shown, and after-tax returns shown are not relevant to investors who hold their Fund shares through tax-deferred arrangements, such as 401(k) plans or individual retirement accounts.
| ave maria growth fund | One Year |
Five Years |
Ten Years | ||
| Return Before Taxes | 8.26% | 8.46% | 13.06% | ||
| Return After Taxes on Distributions | 6.88% | 7.01% | 11.56% | ||
| Return After Taxes on Distributions and Sale of Fund Shares |
5.89% | 6.47% | 10.51% | ||
| S&P 500® INDEX (reflects no deduction for fees, expenses, or taxes) | 17.88% | 14.42% | 14.82% | ||
| S&P 500 EQUAL WEIGHT® INDEX (reflects no deduction for fees, expenses, or taxes) | 11.43% | 10.48% | 11.71% |
The bar chart and performance table shown below provide some indication of the risks and variability of investing in the Ave Maria Rising Dividend Fund by showing the Fund’s performance from year to year for each of the last ten calendar years, and by showing how the Fund’s average annual total returns for the 1-, 5- and 10-year periods ended December 31, 2025 compare with the S&P 500® Index and the S&P 500® Dividend Aristocrats® Index. The S&P 500® Index is used as a primary index in order to comply with the regulation that requires the Fund’s primary benchmark to represent the overall applicable market. The S&P 500® Dividend Aristocrats® Index is included as an additional comparative index because it is representative of the market sectors in which the Fund may invest. How the Fund has performed in the past (before and after taxes) is not necessarily an indication of how the Fund will perform in the future. Updated performance information, current through the most recent month end, is available on the Fund’s website (www.avemariafunds.com) or by calling 1-888-726-9331.
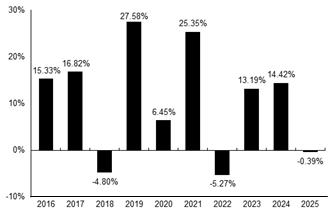
During the periods shown in the bar chart, the highest return for a quarter was 21.75% during the quarter ended June 30, 2020, and the lowest return for a quarter was -26.87% during the quarter ended March 31, 2020.
After-tax returns are calculated using the historical highest individual federal marginal income tax rates and do not reflect the impact of state and local taxes. Actual after-tax returns depend on an investor’s tax situation and may differ from those shown, and after-tax returns shown are not relevant to investors who hold their Fund shares through tax-deferred arrangements, such as 401(k) plans or individual retirement accounts.
| ave maria rising dividend fund | One Year |
Five Years |
Ten Years | ||
| Return Before Taxes | -0.39% | 8.90% | 10.31% | ||
| Return After Taxes on Distributions | -1.62% | 7.28% | 8.62% | ||
| Return After Taxes on Distributions and Sale of Fund Shares |
0.67% | 6.88% | 8.09% | ||
| S&P 500® INDEX (reflects no deduction for fees, expenses, or taxes) | 17.88% | 14.42% | 14.82% | ||
| S&P 500® Dividend Aristocrats® INDEX (reflects no deduction for fees, expenses, or taxes) | 7.28% | 8.04% | 10.49% |
The Fund is newly organized and therefore does not have a performance history for a full calendar year to report. When the Fund has returns for a full calendar year, this Prospectus will include performance information, which will give some indication of the risks and variability of investing in the Fund by showing the Fund’s performance from year to year, and by showing how the Fund’s average annual total returns compare with those of a broad measure of market performance. How the Fund has performed in the past (before and after taxes) is not necessarily an indication of how it will perform in the future. Updated performance information, current through the most recent month-end is available on the Fund’s website at www.avemariafunds.com or by calling 1-888-726-9331.
The bar chart and performance table shown below provide some indication of the risks and variability of investing in the Ave Maria Value Fund by showing the Fund’s performance from year to year for each of the last ten calendar years, and by showing how the Fund’s average annual total returns for the 1-, 5- and 10-year periods ended December 31, 2025 compare with the S&P 500® Index. The S&P 500® Index is used as a primary index in order to comply with the regulation that requires the Fund’s primary benchmark to represent the overall applicable market. The S&P MidCap 400® Index is included as an additional comparative index because it is representative of the market sectors in which the Fund may invest. How the Fund has performed in the past (before and after taxes) is not necessarily an indication of how the Fund will perform in the future. Updated performance information, current through the most recent month end, is available on the Fund’s website (www.avemariafunds.com) or by calling 1-888-726-9331.
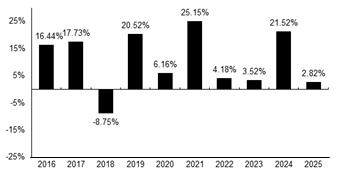
During the periods shown in the bar chart, the highest return for a quarter was 20.00% during the quarter ended December 31, 2020, and the lowest return for a quarter was -28.51% during the quarter ended March 31, 2020.
After-tax returns are calculated using the historical highest individual federal marginal income tax rates and do not reflect the impact of state and local taxes. Actual after-tax returns depend on an investor’s tax situation and may differ from those shown, and after-tax returns shown are not relevant to investors who hold their Fund shares through tax-deferred arrangements, such as 401(k) plans or individual retirement accounts.
| ave maria value fund | One Year |
Five Years |
Ten Years | ||
| Return Before Taxes | 2.82% | 11.02% | 10.44% | ||
| Return After Taxes on Distributions | 2.74% | 9.89% | 9.21% | ||
| Return After Taxes on Distributions and Sale of Fund Shares |
1.73% | 8.64% | 8.30% | ||
| S&P 500® INDEX (reflects no deduction for fees, expenses, or taxes) | 17.88% | 14.42% | 14.82% | ||
| S&P MIDCAP 400® INDEX (reflects no deduction for fees, expenses, or taxes) | 7.50% | 9.12% | 10.72% |
The bar chart and performance table shown below provide some indication of the risks and variability of investing in the Ave Maria World Equity Fund by showing the Fund’s performance from year to year for each of the last ten calendar years, and by showing how the Fund’s average annual total returns for the 1-, 5- and 10-year periods ending December 31, 2025 compare with those of a broad measure of market performance. How the Fund has performed in the past (before and after taxes) is not necessarily an indication of how the Fund will perform in the future. Certain performance information reflects fee reductions and/or expense reimbursements by the Adviser; without such fee reductions and/or expense reimbursements, returns would be less than those shown. Updated performance information, current through the most recent month end, is available on the Fund’s website (www.avemariafunds.com) or by calling 1-888-726-9331.
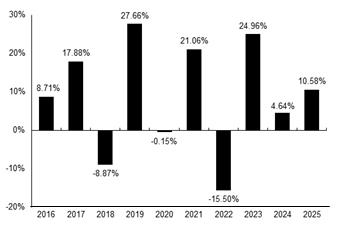
During the periods shown in the bar chart, the highest return for a quarter was 17.06% during the quarter ended June 30, 2020, and the lowest return for a quarter was -28.14% during the quarter ended March 31, 2020.
After-tax returns are calculated using the historical highest individual federal marginal income tax rates and do not reflect the impact of state and local taxes. Actual after-tax returns depend on an investor’s tax situation and may differ from those shown, and after-tax returns shown are not relevant to investors who hold their Fund shares through tax-deferred arrangements, such as 401(k) plans or individual retirement accounts.
| ave maria world equity fund | One Year |
Five Years |
Ten Years | ||
| Return Before Taxes | 10.58% | 8.14% | 8.21% | ||
| Return After Taxes on Distributions | 10.01% | 7.76% | 7.69% | ||
| Return After Taxes on Distributions and Sale of Fund Shares |
6.79% | 6.44% | 6.63% | ||
| MSCI ACWI INDEX (reflects
no deduction for fees, expenses, or taxes) |
22.34% | 11.19% | 11.72% |
The bar chart and performance table shown below provide some indication of the risks and variability of investing in the Ave Maria Growth Focused Fund by showing the Fund’s performance for each full calendar year over the lifetime of the Fund, and by showing how the Fund’s average annual total returns for the 1- and 5-year periods ended December 31, 2025, and the period since its inception compare with the S&P 500® Index. The S&P 500® Index is used as a primary index in order to comply with the regulation that requires the Fund’s primary benchmark to represent the overall applicable market. The S&P MidCap 400 Growth® Index is included as an additional comparative index because it is representative of the market sectors in which the Fund may invest. How the Fund has performed in the past (before and after taxes) is not necessarily an indication of how the Fund will perform in the future. Certain performance information reflects fee reductions and/or expense reimbursements by the Adviser; without such fee reductions and/or expense reimbursements, returns would be less than those shown. Updated performance information, current through the most recent month end is available on the Fund’s website (www.avemariafunds.com) or by calling 1-888-726-9331.
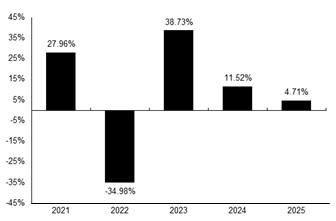
During the periods shown in the bar chart, the highest return for a quarter was 15.31% during the quarter ended June 30, 2025, and the lowest return for a quarter was -22.43% during the quarter ended June 30, 2022.
After-tax returns are calculated using the historical highest individual federal marginal income tax rates and do not reflect the impact of state and local taxes. Actual after-tax returns depend on an investor’s tax situation and may differ from those shown, and after-tax returns shown are not relevant to investors who hold their Fund shares through tax-deferred arrangements, such as 401(k) plans or individual retirement accounts.
| ave maria growth focused fund | One Year |
Five Years |
Since
Inception (May 1, 2020) |
| Return Before Taxes | 4.71% | 6.15% | 9.59% |
| Return After Taxes on Distributions | 4.71% | 5.92% | 9.37% |
| Return After Taxes on Distributions and Sale of Fund Shares |
2.79% | 4.80% | 7.63% |
| S&P 500® INDEX (reflects no deduction for fees, expenses, or taxes) | 17.88% | 14.42% | 18.63% |
| S&P MIDCAP 400 GROWTH® INDEX (reflects no deduction for fees, expenses, or taxes) | 7.46% | 7.12% | 13.80% |
The bar chart and performance table shown below provide some indication of the risks and variability of investing in the Ave Maria Value Focused Fund by showing the Fund’s performance from year to year for each of the last ten calendar years, and by showing how the Fund’s average annual total returns for the 1-, 5- and 10-year periods ended December 31, 2025 compare with those of a broad measure of market performance. The Fund’s performance results prior to April 28, 2025 were achieved without the use of the morally responsible investment process that is designed to avoid investments in companies that are contrary to the core values and teachings of the Roman Catholic Church. The Fund’s performance results during portions of 2016 were achieved using an investment strategy that differs from its current more focused strategy. The S&P 500® Index is used as a primary index in order to comply with the regulation that requires the Fund’s primary benchmark to represent the overall applicable market. The S&P Composite 1500® Index is used as a secondary index because it is representative of the securities that may be purchased by the Fund. Certain performance information reflects fee reductions and/or expense reimbursements by the Adviser; without such fee reductions and/or expense reimbursements, returns would be less than those shown. How the Fund has performed in the past (before and after taxes) is not necessarily an indication of how the Fund will perform in the future. Updated performance information, current through the most recent month-end, is available on the Fund’s website (www.avemariafunds.com) or by calling 1-888-726-9331.
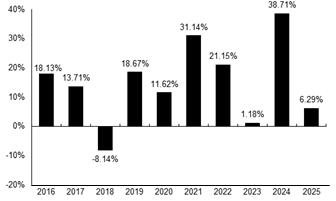
During the periods shown in the bar chart, the highest return for a quarter was 32.32% during the quarter ended March 31, 2021, and the lowest return for a quarter was -27.83% during the quarter ended March 31, 2020.
After-tax returns are calculated using the historical highest individual federal marginal income tax rates and do not reflect the impact of state and local taxes. Actual after-tax returns depend on an investor’s tax situation and may differ from those shown, and after-tax returns shown are not relevant to investors who hold their Fund shares through tax-deferred arrangements, such as 401(k) plans or individual retirement accounts.
| ave maria value focused fund | One Year |
Five Years |
Ten Years | ||
| Return Before Taxes | 6.29% | 18.84% | 14.50% | ||
| Return After Taxes on Distributions | 6.19% | 17.43% | 13.48% | ||
| Return After Taxes on Distributions and Sale of Fund Shares |
3.80% | 15.12% | 11.97% | ||
| S&P 500® Index (reflects no deduction for fees, expenses, or taxes) | 17.88% | 14.42% | 14.82% | ||
| S&P Composite 1500® Index (reflects no deduction for fees, expenses, or taxes) | 17.02% | 13.96% | 14.46% |
The bar chart and performance table shown below provide some indication of the risks and variability of investing in the Ave Maria Bond Fund by showing the Fund’s performance from year to year for each of the last ten calendar years, and by showing how the Fund’s average annual total returns for the 1, 5- and 10-year periods ended December 31, 2025 compare with those of the Bloomberg U.S. Aggregate Bond Index and the Bloomberg Intermediate U.S. Government/Credit Bond Index. The Bloomberg U.S. Aggregate Bond Index is used as a primary index in order to comply with the regulation that requires the Fund’s primary benchmark to represent the overall applicable market. The Bloomberg Intermediate U.S. Government/Credit Bond Index is included as an additional comparative index because it is representative of the market sectors in which the Fund may invest. How the Fund has performed in the past (before and after taxes) is not necessarily an indication of how the Fund will perform in the future. Updated performance information, current through the most recent month end, is available on the Fund’s website (www.avemariafunds.com) or by calling 1-888-726-9331.
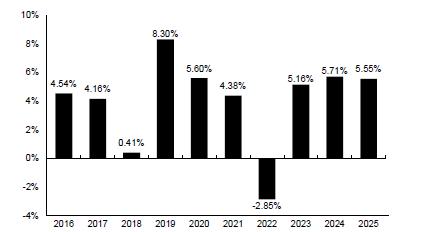
During the periods shown in the bar chart, the highest return for a quarter was 6.35% during the quarter ended June 30, 2020, and the lowest return for a quarter was -5.70% during the quarter ended March 31, 2020.
After-tax returns are calculated using the historical highest individual federal marginal income tax rates and do not reflect the impact of state and local taxes. Actual after-tax returns depend on an investor’s tax situation and may differ from those shown, and after-tax returns shown are not relevant to investors who hold their Fund shares through tax-deferred arrangements, such as 401(k) plans or individual retirement accounts.
| ave maria bond fund | One Year |
Five Years |
Ten Years | ||
| Return Before Taxes | 5.55% | 3.54% | 4.05% | ||
| Return After Taxes on Distributions | 4.19% | 2.46% | 3.06% | ||
| Return After Taxes on Distributions and Sale of Fund Shares |
3.37% | 2.33% | 2.82% | ||
| BLOOMBERG U.S. AGGREGATE BOND INDEX (reflects no deduction for fees, expenses, or taxes) | 7.30% | -0.36% | 2.01% | ||
| BLOOMBERG INTERMEDIATE U.S. GOVERNMENT/CREDIT BOND INDEX (reflects
no deduction for fees, expenses, or taxes) |
6.97% | 0.96% | 2.29% |