The Portfolio seeks to provide long-term capital appreciation.
This table describes the fees and expenses that you may pay if you buy, hold and sell shares of the Portfolio. The table and the example do not include any fees or sales charges imposed by your variable annuity or variable life insurance contract. If they were included, your costs would be higher. Please refer to your variable contract prospectus for information on the separate account fees and expenses associated with your contract.
|
Shareholder Fees (fees paid directly from your investment) |
Class I Shares |
Class II Shares |
Class III Shares |
||||||||||||
|
Maximum Sales Charge (Load) Imposed on Purchases (as a percentage of offering price) |
None |
None |
None |
||||||||||||
|
Maximum Deferred Sales Charge (Load) (as a percentage of redemption proceeds) |
None |
None |
None |
||||||||||||
|
Maximum Sales Charge (Load) Imposed on Reinvested Dividends and Other Distributions |
None |
None |
None |
||||||||||||
| Redemption Fee (as a percentage of amount redeemed) |
None |
None |
None |
||||||||||||
|
Annual Portfolio Operating Expenses (expenses that you pay each year as a percentage of the value of your investment) |
|||||||||||||||
|
Management Fees |
0.54 |
% |
0.54 |
% |
0.54 |
% |
|||||||||
|
Distribution and Service (12b-1) Fees |
None |
0.25 |
% |
0.15 |
% |
||||||||||
|
Other Expenses(1) |
0.15 |
% |
0.15 |
% |
0.15 |
% |
|||||||||
|
Total Annual Portfolio Operating Expenses |
0.69 |
% |
0.94 |
% |
0.84 |
% |
|||||||||
(1) The "Other Expenses" for Class III shares are based on estimated amounts.
This Example is intended to help you compare the cost of investing in the Portfolio with the cost of investing in other mutual funds.
The Example assumes that you invest $10,000 in the Portfolio for the time periods indicated and then redeem all of your shares at the end of those periods. You would pay the same expenses if you did not redeem your shares. However, each variable contract and separate account involves fees and expenses that are not included in the Example. If these fees and expenses were included in the Example, your overall expenses would be higher. The Example also assumes that your investment has a 5% return each year and that the Portfolio's operating expenses remain the same (except that the Example reflects any applicable contractual fee waivers/expense reimbursement arrangements for only the first year). Although your actual costs may be higher or lower, based upon these assumptions your costs would be:
|
1 Year |
3 Years |
5 Years |
10 Years |
||||||||||||||||
|
Class I |
$ |
70 |
$ |
221 |
$ |
384 |
$ |
859 |
|||||||||||
|
Class II |
$ |
96 |
$ |
300 |
$ |
520 |
$ |
1,155 |
|||||||||||
|
Class III |
$ |
86 |
$ |
268 |
$ |
466 |
$ |
1,037 |
|||||||||||
|
1 Year |
3 Years |
5 Years |
10 Years |
||||||||||||||||
|
Class I |
$ |
70 |
$ |
221 |
$ |
384 |
$ |
859 |
|||||||||||
|
Class II |
$ |
96 |
$ |
300 |
$ |
520 |
$ |
1,155 |
|||||||||||
|
Class III |
$ |
86 |
$ |
268 |
$ |
466 |
$ |
1,037 |
|||||||||||
The Portfolio pays transaction costs, such as commissions, when it buys and sells securities or instruments (or "turns over" its portfolio). These costs, which are not reflected in annual portfolio operating expenses or in the Example, affect the Portfolio's performance. A higher portfolio turnover rate may indicate higher transaction costs. During the most recent fiscal year ended December 31, 2025, the Portfolio's portfolio turnover rate was 115% of the average value of its portfolio.
Under normal circumstances, the Portfolio invests at least 80% of its net assets (plus the amount of any borrowings for investment purposes) in the equity securities of mid-capitalization companies. Securities will be selected using a proprietary quantitative model and will consist primarily of equity securities of companies with similar capitalizations of the companies included in the Russell Midcap® Growth Index. However, the Portfolio may invest in securities outside the Russell Midcap® Growth Index capitalization range. The model systematically tracks and ranks the characteristics of large- and mid-capitalization growth issuers located in the United States, and is designed to select stocks based on an analysis of a wide range of factors, such as relative value, earnings quality, market sentiment, and thematic insights. The Portfolio's sub-adviser is BlackRock Investment Management, LLC ("BlackRock" or the "Sub-Adviser"). The growth investment style generally involves investing in stocks of companies that have shown historical and/or expected above-average growth in such financial metrics as revenue, earnings, cash flow and profit margin.
The Portfolio primarily seeks to buy common stock and may also invest in preferred stock and convertible securities listed in U.S. equity markets.
Equity securities include common stock, preferred stock, securities convertible into common stock and securities or other instruments whose price is linked to the value of common stock. Preferred stock is a class of stock that often pays dividends at a specified rate and has preference over common stock in dividend payments and liquidation of assets. Convertible securities typically pay current income as either interest (debt security convertibles) or dividends (preferred stock), and their value usually reflects both the stream of current income payments and the market value of the underlying common stock.
The Portfolio may use derivatives, including futures, to gain equity exposure and to manage cash flows into or out of the Portfolio effectively. Derivatives are financial instruments whose value is derived from underlying market factors or another asset, such as a security, a commodity, a currency or an index.
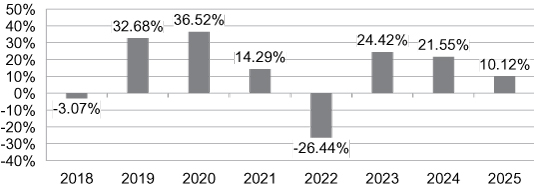
The bar chart and performance table below show the variability of the Portfolio's returns, which is some indication of the risks of investing in the Portfolio. The bar chart shows performance of the Portfolio's Class I shares for each full calendar year since the Portfolio's inception and the table shows how the average annual total returns of the Portfolio's Class I shares compared with the returns of two indexes. The Russell Midcap® Growth Index serves as the Portfolio's performance index because the Adviser believes it is more representative of the Portfolio's investment strategy. The Russell 1000® Index serves as the Portfolio's regulatory index and provides a broad measure of market performance. The performance in the bar chart and the table does not include the effect of variable contract charges. If variable contract charges had been included, performance would have been lower. Because all of the Portfolio's shares are invested in the same portfolio of securities, returns for the Portfolio's Class II shares differ only to the extent that the classes do not have the same expenses. You should be aware that the Portfolio's past performance may not be an indication of how the Portfolio will perform in the future.
|
Highest Quarter |
2nd Quarter 2020 |
29.93 |
% |
||||||||
|
Lowest Quarter |
2nd Quarter 2022 |
-20.75 |
% |
||||||||
|
One Year |
Five Years |
Since Inception (November 1, 2017) |
|||||||||||||
|
Class I shares return before taxes |
10.12 |
% |
6.96 |
% |
12.12 |
% |
|||||||||
|
Class II shares return before taxes |
9.90 |
% |
6.69 |
% |
11.85 |
% |
|||||||||
|
Russell Midcap® Growth Index (reflects no deduction for fees, expenses or taxes) |
8.66 |
% |
6.65 |
% |
11.96 |
% |
|||||||||
|
Russell 1000® Index (reflects no deduction for fees, expenses or taxes) |
17.37 |
% |
13.59 |
% |
14.30 |
% |
|||||||||