The Fund acquired all of the assets and liabilities of the TrueShares Structured Outcome (January) ETF, a series of Listed Funds Trust (the “Predecessor Fund”), in a tax-free reorganization on August 8, 2025. In connection with this acquisition, shares of the Predecessor Fund were exchanged for shares of the Fund. The Predecessor Fund had an investment objective and strategies that were, in all material respects, the same as those of the Fund, and was managed in a manner that, in all material respects, complied with the investment guidelines and restrictions of the Fund. The Fund is a continuation of the Predecessor Fund, and therefore, the performance information includes the performance of the Predecessor Fund.
The performance information presented below provides some indication of the risks of investing in the Fund by showing how the Fund’s performance can change from year to year and over time. The bar chart below shows the Fund’s performance for calendar years ended December 31. The table illustrates how the Fund’s average annual returns for the 1 year and since inception periods compare with those of the S&P 500 Total Return Index, a broad measure of market performance, and the S&P 500 Price Index, which is integral to the Fund’s investment strategy and is comprised of the same components as the S&P 500 Total Return Index but does not include dividends in its calculation. The Fund’s past performance, before and after taxes, does not necessarily indicate how it will perform in the future.
Effective May 1, 2024, the Adviser began managing the Predecessor Fund directly. Prior to May 1, 2024, the Predecessor Fund was managed on a day-to-day basis by an investment sub-adviser. The Predecessor Fund’s performance for periods prior to May 1, 2024, may have differed had the Predecessor Fund been managed directly by the Adviser. Updated performance information is available on the Fund’s website at www.true-shares.com.
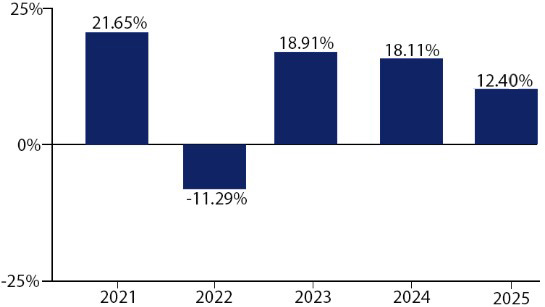
During the period of time shown in the bar chart, the highest quarterly return was 8.97% for the quarter ended December 31, 2023, and the lowest quarterly return was -11.01% for the quarter ended June 30, 2022.
| Average
Annual Total Returns (for the Periods Ended December 31, 2025) |
||||
| TrueShares Structured Outcome (January) ETF | One Year | Five Years | Since
Inception (12/31/2020) | |||
| Return Before Taxes | 12.40% | 11.24% | 11.24% | |||
| Return After Taxes on Distributions | 11.76% | 10.24% | 10.24% | |||
| Return After Taxes on Distributions and Sale of Fund Shares | 7.35% | 8.44% | 8.44% | |||
| S&P
500 Price Index1 (reflects no deductions for fees, expenses, or taxes) |
16.39% | 12.75% | 12.75% | |||
| S&P
500 Total Return Index (reflects no deductions for fees, expenses, or taxes) |
17.88% | 14.42% | 14.42% | |||
| 1 | Unlike the S&P 500 Total Return Index, the S&P 500 Price Index excludes dividends. The returns of the S&P 500 Price Index are lower than the S&P 500 Total Return Index due to such exclusion of dividends. | |||||
After-tax returns are calculated using the historical highest individual federal marginal income tax rates during the period covered by the table above and do not reflect the impact of state and local taxes. Actual after-tax returns depend on an investor’s tax situation and may differ from those shown. After-tax returns shown are not relevant to investors who hold their Shares through tax-deferred arrangements such as an individual retirement account (“IRA”) or other tax-advantaged accounts. In certain cases, the figure representing “Return After Taxes on Distributions and Sale of Shares” may be higher than the other return figures for the same period. A higher after-tax return results when a capital loss occurs upon redemption and provides an assumed tax deduction that benefits the investor.
The Fund acquired all of the assets and liabilities of the TrueShares Structured Outcome (February) ETF, a series of Listed Funds Trust (the “Predecessor Fund”), in a tax-free reorganization on August 8, 2025. In connection with this acquisition, shares of the Predecessor Fund were exchanged for shares of the Fund. The Predecessor Fund had an investment objective and strategies that were, in all material respects, the same as those of the Fund, and was managed in a manner that, in all material respects, complied with the investment guidelines and restrictions of the Fund. The Fund is a continuation of the Predecessor Fund, and therefore, the performance information includes the performance of the Predecessor Fund.
The performance information presented below provides some indication of the risks of investing in the Fund by showing how the Fund’s performance can change from year to year and over time. The bar chart below shows the Fund’s performance for calendar years ended December 31. The table illustrates how the Fund’s average annual returns for the 1 year and since inception periods compare with those of the S&P 500 Total Return Index, a broad measure of market performance, and the S&P 500 Price Index, which is integral to the Fund’s investment strategy and is comprised of the same components as the S&P 500 Total Return Index but does not include dividends in its calculation. The Fund’s past performance, before and after taxes, does not necessarily indicate how it will perform in the future.
Effective May 1, 2024, the Adviser began managing the Predecessor Fund directly. Prior to May 1, 2024, the Predecessor Fund was managed on a day-to-day basis by an investment sub-adviser. The Predecessor Fund’s performance for periods prior to May 1, 2024, may have differed had the Predecessor Fund been managed directly by the Adviser. Updated performance information is available on the Fund’s website at www.true-shares.com.
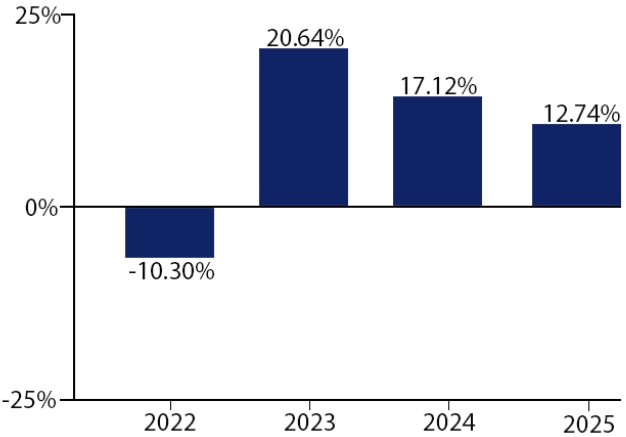
During the period of time shown in the bar chart, the highest quarterly return was 8.47% for the quarter ended December 31, 2023, and the lowest quarterly return was -10.75% for the quarter ended June 30, 2022.
| Average
Annual Total Returns (for the Periods Ended December 31, 2025) |
|||
| TrueShares Structured Outcome (February) ETF | One Year | Since
Inception (1/29/2021) | |||
| Return Before Taxes | 12.74% | 11.69% | |||
| Return After Taxes on Distributions | 11.33% | 10.47% | |||
| Return After Taxes on Distributions and Sale of Fund Shares | 7.55% | 8.72% | |||
| S&P
500 Price Index1 (reflects no deductions for fees, expenses, or taxes) |
16.39% | 13.22% | |||
| S&P
500 Total Return Index (reflects no deductions for fees, expenses, or taxes) |
17.88% | 14.91% | |||
| 1 | Unlike the S&P 500 Total Return Index, the S&P 500 Price Index excludes dividends. The returns of the S&P 500 Price Index are lower than the S&P 500 Total Return Index due to such exclusion of dividends. | ||||
After-tax returns are calculated using the historical highest individual federal marginal income tax rates during the period covered by the table above and do not reflect the impact of state and local taxes. Actual after-tax returns depend on an investor’s tax situation and may differ from those shown. After-tax returns shown are not relevant to investors who hold their Shares through tax-deferred arrangements such as an individual retirement account (“IRA”) or other tax-advantaged accounts. In certain cases, the figure representing “Return After Taxes on Distributions and Sale of Shares” may be higher than the other return figures for the same period. A higher after-tax return results when a capital loss occurs upon redemption and provides an assumed tax deduction that benefits the investor.
The Fund acquired all of the assets and liabilities of the TrueShares Structured Outcome (March) ETF, a series of Listed Funds Trust (the “Predecessor Fund”), in a tax-free reorganization on August 8, 2025. In connection with this acquisition, shares of the Predecessor Fund were exchanged for shares of the Fund. The Predecessor Fund had an investment objective and strategies that were, in all material respects, the same as those of the Fund, and was managed in a manner that, in all material respects, complied with the investment guidelines and restrictions of the Fund. The Fund is a continuation of the Predecessor Fund, and therefore, the performance information includes the performance of the Predecessor Fund.
The performance information presented below provides some indication of the risks of investing in the Fund by showing how the Fund’s performance can change from year to year and over time. The bar chart below shows the Fund’s performance for calendar years ended December 31. The table illustrates how the Fund’s average annual returns for the 1 year and since inception periods compare with those of the S&P 500 Total Return Index, a broad measure of market performance, and the S&P 500 Price Index, which is integral to the Fund’s investment strategy and is comprised of the same components as the S&P 500 Total Return Index but does not include dividends in its calculation. The Fund’s past performance, before and after taxes, does not necessarily indicate how it will perform in the future.
Effective May 1, 2024, the Adviser began managing the Predecessor Fund directly. Prior to May 1, 2024, the Predecessor Fund was managed on a day-to-day basis by an investment sub-adviser. The Predecessor Fund’s performance for periods prior to May 1, 2024, may have differed had the Predecessor Fund been managed directly by the Adviser. Updated performance information is available on the Fund’s website at www.true-shares.com.
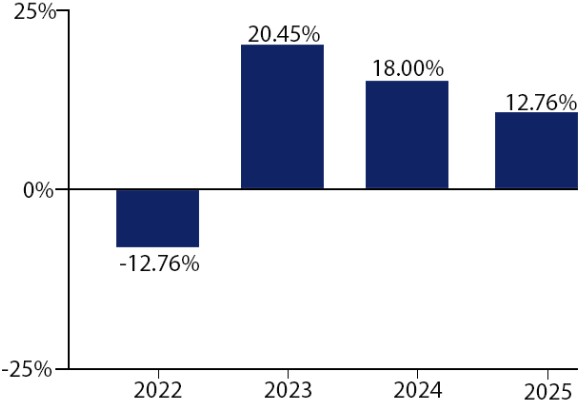
During the period of time shown in the bar chart, the highest quarterly return was 8.71% for the quarter ended December 31, 2023, and the lowest quarterly return was -11.28% for the quarter ended June 30, 2022.
| Average
Annual Total Returns (for the Periods Ended December 31, 2025) |
|||
| TrueShares Structured Outcome (March) ETF | One Year | Since
Inception (2/26/2021) | ||
| Return Before Taxes | 12.76% | 10.74% | ||
| Return After Taxes on Distributions | 11.31% | 9.11% | ||
| Return After Taxes on Distributions and Sale of Fund Shares | 7.56% | 7.71% | ||
| S&P
500 Price Index1 (reflects no deductions for fees, expenses, or taxes) |
16.39% | 12.84% | ||
| S&P
500 Total Return Index (reflects no deductions for fees, expenses, or taxes) |
17.88% | 14.52% | ||
| 1 | Unlike the S&P 500 Total Return Index, the S&P 500 Price Index excludes dividends. The returns of the S&P 500 Price Index are lower than the S&P 500 Total Return Index due to such exclusion of dividends. | |||
After-tax returns are calculated using the historical highest individual federal marginal income tax rates during the period covered by the table above and do not reflect the impact of state and local taxes. Actual after-tax returns depend on an investor’s tax situation and may differ from those shown. After-tax returns shown are not relevant to investors who hold their Shares through tax-deferred arrangements such as an individual retirement account (“IRA”) or other tax-advantaged accounts. In certain cases, the figure representing “Return After Taxes on Distributions and Sale of Shares” may be higher than the other return figures for the same period. A higher after-tax return results when a capital loss occurs upon redemption and provides an assumed tax deduction that benefits the investor.
The Fund acquired all of the assets and liabilities of the TrueShares Structured Outcome (April) ETF, a series of Listed Funds Trust (the “Predecessor Fund”), in a tax-free reorganization on August 8, 2025. In connection with this acquisition, shares of the Predecessor Fund were exchanged for shares of the Fund. The Predecessor Fund had an investment objective and strategies that were, in all material respects, the same as those of the Fund, and was managed in a manner that, in all material respects, complied with the investment guidelines and restrictions of the Fund. The Fund is a continuation of the Predecessor Fund, and therefore, the performance information includes the performance of the Predecessor Fund.
The performance information presented below provides some indication of the risks of investing in the Fund by showing how the Fund’s performance can change from year to year and over time. The bar chart below shows the Fund’s performance for calendar years ended December 31. The table illustrates how the Fund’s average annual returns for the 1 year and since inception periods compare with those of the S&P 500 Total Return Index, a broad measure of market performance, and the S&P 500 Price Index, which is integral to the Fund’s investment strategy and is comprised of the same components as the S&P 500 Total Return Index but does not include dividends in its calculation. The Fund’s past performance, before and after taxes, does not necessarily indicate how it will perform in the future.
Effective May 1, 2024, the Adviser began managing the Predecessor Fund directly. Prior to May 1, 2024, the Predecessor Fund was managed on a day-to-day basis by an investment sub-adviser. The Predecessor Fund’s performance for periods prior to May 1, 2024, may have differed had the Predecessor Fund been managed directly by the Adviser. Updated performance information is available on the Fund’s website at www.true-shares.com.
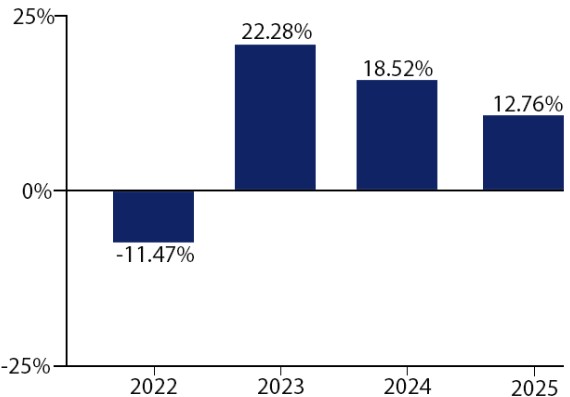
During the period of time shown in the bar chart, the highest quarterly return was 8.70% for the quarter ended December 31, 2023, and the lowest quarterly return was -11.06% for the quarter ended June 30, 2022.
| Average
Annual Total Returns (for the Periods Ended December 31, 2025) |
| TrueShares Structured Outcome (April) ETF | One Year | Since
Inception (3/31/2021) | |
| Return Before Taxes | 12.76% | 11.02% | |
| Return After Taxes on Distributions | 11.28% | 10.13% | |
| Return After Taxes on Distributions and Sale of Fund Shares | 7.56% | 8.32% | |
| S&P
500 Price Index1 (reflects no deductions for fees, expenses, or taxes) |
16.39% | 12.12% | |
| S&P
500 Total Return Index (reflects no deductions for fees, expenses, or taxes) |
17.88% | 13.78% | |
| 1 | Unlike the S&P 500 Total Return Index, the S&P 500 Price Index excludes dividends. The returns of the S&P 500 Price Index are lower than the S&P 500 Total Return Index due to such exclusion of dividends. |
After-tax returns are calculated using the historical highest individual federal marginal income tax rates during the period covered by the table above and do not reflect the impact of state and local taxes. Actual after-tax returns depend on an investor’s tax situation and may differ from those shown. After-tax returns shown are not relevant to investors who hold their Shares through tax-deferred arrangements such as an individual retirement account (“IRA”) or other tax-advantaged accounts. In certain cases, the figure representing “Return After Taxes on Distributions and Sale of Shares” may be higher than the other return figures for the same period. A higher after-tax return results when a capital loss occurs upon redemption and provides an assumed tax deduction that benefits the investor.
The Fund acquired all of the assets and liabilities of the TrueShares Structured Outcome (May) ETF, a series of Listed Funds Trust (the “Predecessor Fund”), in a tax-free reorganization on August 8, 2025. In connection with this acquisition, shares of the Predecessor Fund were exchanged for shares of the Fund. The Predecessor Fund had an investment objective and strategies that were, in all material respects, the same as those of the Fund, and was managed in a manner that, in all material respects, complied with the investment guidelines and restrictions of the Fund. The Fund is a continuation of the Predecessor Fund, and therefore, the performance information includes the performance of the Predecessor Fund.
The performance information presented below provides some indication of the risks of investing in the Fund by showing how the Fund’s performance can change from year to year and over time. The bar chart below shows the Fund’s performance for calendar years ended December 31. The table illustrates how the Fund’s average annual returns for the 1 year and since inception periods compare with those of the S&P 500 Total Return Index, a broad measure of market performance, and the S&P 500 Price Index, which is integral to the Fund’s investment strategy and is comprised of the same components as the S&P 500 Total Return Index but does not include dividends in its calculation. The Fund’s past performance, before and after taxes, does not necessarily indicate how it will perform in the future.
Effective May 1, 2024, the Adviser began managing the Predecessor Fund directly. Prior to May 1, 2024, the Predecessor Fund was managed on a day-to-day basis by an investment sub-adviser. The Predecessor Fund’s performance for periods prior to May 1, 2024, may have differed had the Predecessor Fund been managed directly by the Adviser. Updated performance information is available on the Fund’s website at www.true-shares.com.
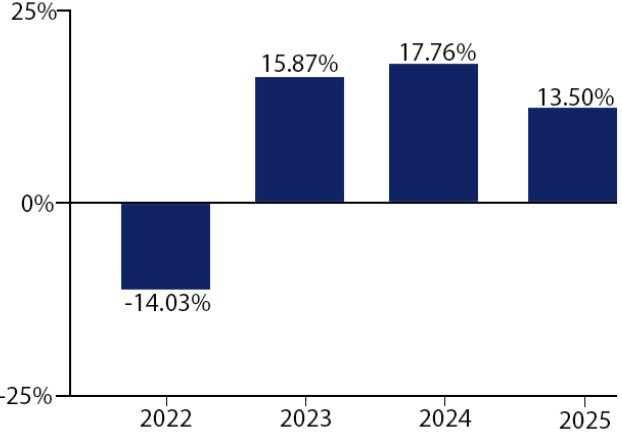
During the period of time shown in the bar chart, the highest quarterly return was 8.49% for the quarter ended June 30, 2025, and the lowest quarterly return was -12.59% for the quarter ended June 30, 2022.
| Average
Annual Total Returns (for the Periods Ended December 31, 2025) |
| TrueShares Structured Outcome (May) ETF | One Year | Since
Inception (4/30/2021) | |
| Return Before Taxes | 13.50% | 8.59% | |
| Return After Taxes on Distributions | 12.53% | 7.72% | |
| Return After Taxes on Distributions and Sale of Fund Shares | 8.00% | 6.33% | |
| S&P
500 Price Index1 (reflects no deductions for fees, expenses, or taxes) |
16.39% | 11.12% | |
| S&P
500 Total Return Index (reflects no deductions for fees, expenses, or taxes) |
17.88% | 12.78% | |
| 1 | Unlike the S&P 500 Total Return Index, the S&P 500 Price Index excludes dividends. The returns of the S&P 500 Price Index are lower than the S&P 500 Total Return Index due to such exclusion of dividends. |
After-tax returns are calculated using the historical highest individual federal marginal income tax rates during the period covered by the table above and do not reflect the impact of state and local taxes. Actual after-tax returns depend on an investor’s tax situation and may differ from those shown. After-tax returns shown are not relevant to investors who hold their Shares through tax-deferred arrangements such as an individual retirement account (“IRA”) or other tax-advantaged accounts. In certain cases, the figure representing “Return After Taxes on Distributions and Sale of Shares” may be higher than the other return figures for the same period. A higher after-tax return results when a capital loss occurs upon redemption and provides an assumed tax deduction that benefits the investor.
The Fund acquired all of the assets and liabilities of the TrueShares Structured Outcome (June) ETF, a series of Listed Funds Trust (the “Predecessor Fund”), in a tax-free reorganization on August 8, 2025. In connection with this acquisition, shares of the Predecessor Fund were exchanged for shares of the Fund. The Predecessor Fund had an investment objective and strategies that were, in all material respects, the same as those of the Fund, and was managed in a manner that, in all material respects, complied with the investment guidelines and restrictions of the Fund. The Fund is a continuation of the Predecessor Fund, and therefore, the performance information includes the performance of the Predecessor Fund.
The performance information presented below provides some indication of the risks of investing in the Fund by showing how the Fund’s performance can change from year to year and over time. The bar chart below shows the Fund’s performance for calendar years ended December 31. The table illustrates how the Fund’s average annual returns for the 1 year and since inception periods compare with those of the S&P 500 Total Return Index, a broad measure of market performance, and the S&P 500 Price Index, which is integral to the Fund’s investment strategy and is comprised of the same components as the S&P 500 Total Return Index but does not include dividends in its calculation. The Fund’s past performance, before and after taxes, does not necessarily indicate how it will perform in the future.
Effective May 1, 2024, the Adviser began managing the Predecessor Fund directly. Prior to May 1, 2024, the Predecessor Fund was managed on a day-to-day basis by an investment sub-adviser. The Predecessor Fund’s performance for periods prior to May 1, 2024, may have differed had the Predecessor Fund been managed directly by the Adviser. Updated performance information is available on the Fund’s website at www.true-shares.com.
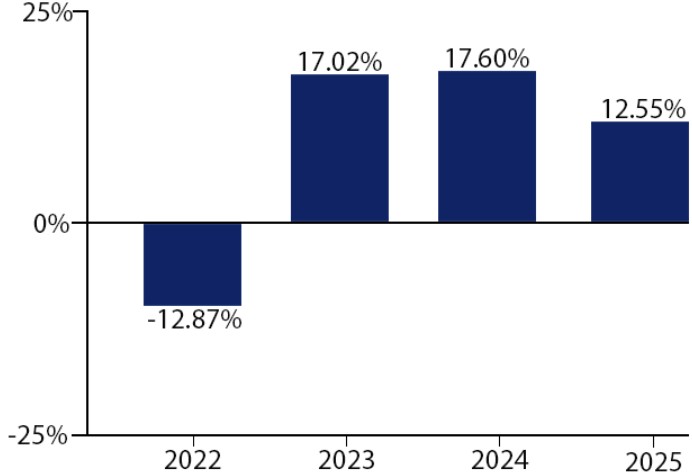
During the period of time shown in the bar chart, the highest quarterly return was 8.73% for the quarter ended December 31, 2023, and the lowest quarterly return was -11.52% for the quarter ended June 30, 2022.
| Average
Annual Total Returns (for the Periods Ended December 31, 2025) |
| TrueShares Structured Outcome (June) ETF | One Year | Since Inception (5/28/2021) | |
| Return Before Taxes | 12.55% | 9.00% | |
| Return After Taxes on Distributions | 11.53% | 7.79% | |
| Return After Taxes on Distributions and Sale of Fund Shares | 7.43% | 6.49% | |
| S&P
500 Price Index1 (reflects no deductions for fees, expenses, or taxes) |
16.39% | 11.19% | |
| S&P
500 Total Return Index (reflects no deductions for fees, expenses, or taxes) |
17.88% | 12.84% | |
| 1 | Unlike the S&P 500 Total Return Index, the S&P 500 Price Index excludes dividends. The returns of the S&P 500 Price Index are lower than the S&P 500 Total Return Index due to such exclusion of dividends. |
After-tax returns are calculated using the historical highest individual federal marginal income tax rates during the period covered by the table above and do not reflect the impact of state and local taxes. Actual after-tax returns depend on an investor’s tax situation and may differ from those shown. After-tax returns shown are not relevant to investors who hold their Shares through tax-deferred arrangements such as an individual retirement account (“IRA”) or other tax-advantaged accounts. In certain cases, the figure representing “Return After Taxes on Distributions and Sale of Shares” may be higher than the other return figures for the same period. A higher after-tax return results when a capital loss occurs upon redemption and provides an assumed tax deduction that benefits the investor.
The Fund acquired all of the assets and liabilities of the TrueShares Structured Outcome (July) ETF, a series of Listed Funds Trust (the “Predecessor Fund”), in a tax-free reorganization on September 9, 2025. In connection with this acquisition, shares of the Predecessor Fund were exchanged for shares of the Fund. The Predecessor Fund had an investment objective and strategies that were, in all material respects, the same as those of the Fund, and was managed in a manner that, in all material respects, complied with the investment guidelines and restrictions of the Fund. The Fund is a continuation of the Predecessor Fund, and therefore, the performance information includes the performance of the Predecessor Fund.
The performance information presented below provides some indication of the risks of investing in the Fund by showing how the Fund’s performance can change from year to year and over time. The bar chart below shows the Fund’s performance for calendar years ended December 31. The table illustrates how the Fund’s average annual returns for the 1 year and since inception periods compare with those of the S&P 500 Total Return Index, a broad measure of market performance, and the S&P 500 Price Index, which is integral to the Fund’s investment strategy and is comprised of the same components as the S&P 500 Total Return Index but does not include dividends in its calculation. The Fund’s past performance, before and after taxes, does not necessarily indicate how it will perform in the future.
Effective May 1, 2024, the Adviser began managing the Predecessor Fund directly. Prior to May 1, 2024, the Predecessor Fund was managed on a day-to-day basis by an investment sub-adviser. The Predecessor Fund’s performance for periods prior to May 1, 2024, may have differed had the Predecessor Fund been managed directly by the Adviser. Updated performance information is available on the Fund’s website at www.true-shares.com.
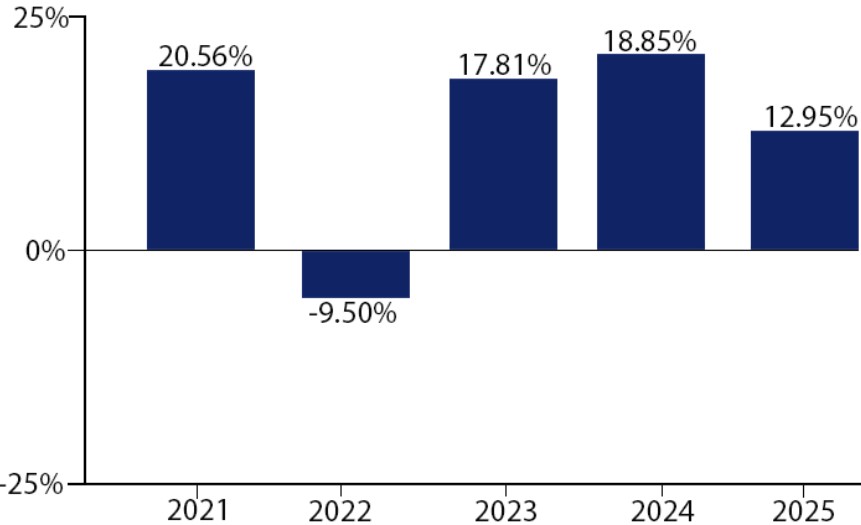
During the period of time shown in the bar chart, the highest quarterly return was 8.31% for the quarter ended June 30, 2025, and the lowest quarterly return was -7.32% for the quarter ended June 30, 2022.
| Average
Annual Total Returns (for the Periods Ended December 31, 2025) |
| TrueShares Structured Outcome (July) ETF | One Year | Five Years | Since Inception (6/30/2020) | |
| Return Before Taxes | 12.95% | 11.53% | 13.58% | |
| Return After Taxes on Distributions | 8.07% | 9.94% | 12.11% | |
| Return After Taxes on Distributions and Sale of Fund Shares | 7.70% | 8.45% | 10.27% | |
| S&P
500 Price Index1 (reflects no deductions for fees, expenses, or taxes) |
16.39% | 12.75% | 15.47% | |
| S&P
500 Total Return Index (reflects no deductions for fees, expenses, or taxes) |
17.88% | 14.42% | 17.21% | |
| 1 | Unlike the S&P 500 Total Return Index, the S&P 500 Price Index excludes dividends. The returns of the S&P 500 Price Index are lower than the S&P 500 Total Return Index due to such exclusion of dividends. |
After-tax returns are calculated using the historical highest individual federal marginal income tax rates during the period covered by the table above and do not reflect the impact of state and local taxes. Actual after-tax returns depend on an investor’s tax situation and may differ from those shown. After-tax returns shown are not relevant to investors who hold their Shares through tax-deferred arrangements such as an individual retirement account (“IRA”) or other tax-advantaged accounts. In certain cases, the figure representing “Return After Taxes on Distributions and Sale of Shares” may be higher than the other return figures for the same period. A higher after-tax return results when a capital loss occurs upon redemption and provides an assumed tax deduction that benefits the investor.
The Fund acquired all of the assets and liabilities of the TrueShares Structured Outcome (August) ETF, a series of Listed Funds Trust (the “Predecessor Fund”), in a tax-free reorganization on September 9, 2025. In connection with this acquisition, shares of the Predecessor Fund were exchanged for shares of the Fund. The Predecessor Fund had an investment objective and strategies that were, in all material respects, the same as those of the Fund, and was managed in a manner that, in all material respects, complied with the investment guidelines and restrictions of the Fund. The Fund is a continuation of the Predecessor Fund, and therefore, the performance information includes the performance of the Predecessor Fund.
The performance information presented below provides some indication of the risks of investing in the Fund by showing how the Fund’s performance can change from year to year and over time. The bar chart below shows the Fund’s performance for calendar years ended December 31. The table illustrates how the Fund’s average annual returns for the 1 year and since inception periods compare with those of the S&P 500 Total Return Index, a broad measure of market performance, and the S&P 500 Price Index, which is integral to the Fund’s investment strategy and is comprised of the same components as the S&P 500 Total Return Index but does not include dividends in its calculation. The Fund’s past performance, before and after taxes, does not necessarily indicate how it will perform in the future.
Effective May 1, 2024, the Adviser began managing the Predecessor Fund directly. Prior to May 1, 2024, the Predecessor Fund was managed on a day-to-day basis by an investment sub-adviser. The Predecessor Fund’s performance for periods prior to May 1, 2024, may have differed had the Predecessor Fund been managed directly by the Adviser. Updated performance information is available on the Fund’s website at www.true-shares.com.
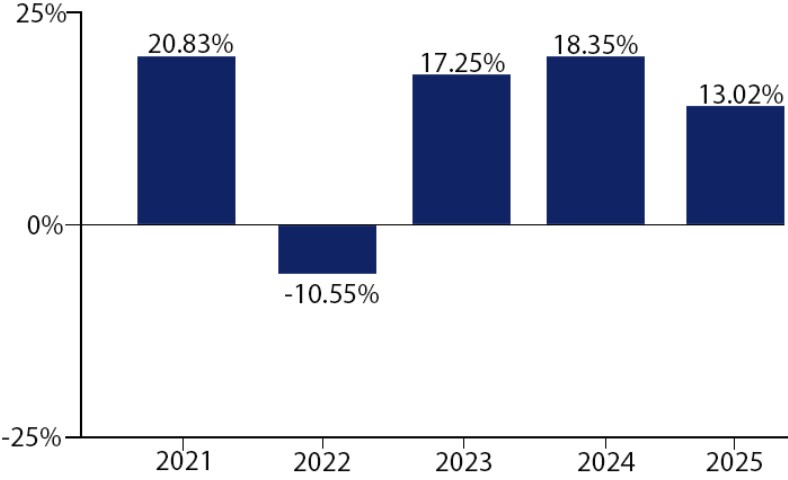
During the period of time shown in the bar chart, the highest quarterly return was 8.30% for the quarter ended June 30, 2025, and the lowest quarterly return was -8.33% for the quarter ended June 30, 2022.
| Average
Annual Total Returns (for the Periods Ended December 31, 2025) |
| TrueShares Structured Outcome (August) ETF | One Year | Five Years | Since Inception (7/31/2020) | |
| Return Before Taxes | 13.02% | 11.13% | 12.48% | |
| Return After Taxes on Distributions | 11.42% | 10.13% | 11.54% | |
| Return After Taxes on Distributions and Sale of Fund Shares | 7.72% | 8.38% | 9.57% | |
| S&P
500 Price Index1 (reflects no deductions for fees, expenses, or taxes) |
16.39% | 12.75% | 14.59% | |
| S&P
500 Total Return Index (reflects no deductions for fees, expenses, or taxes) |
17.88% | 14.42% | 16.32% | |
| 1 | Unlike the S&P 500 Total Return Index, the S&P 500 Price Index excludes dividends. The returns of the S&P 500 Price Index are lower than the S&P 500 Total Return Index due to such exclusion of dividends. |
After-tax returns are calculated using the historical highest individual federal marginal income tax rates during the period covered by the table above and do not reflect the impact of state and local taxes. Actual after-tax returns depend on an investor’s tax situation and may differ from those shown. After-tax returns shown are not relevant to investors who hold their Shares through tax-deferred arrangements such as an individual retirement account (“IRA”) or other tax-advantaged accounts. In certain cases, the figure representing “Return After Taxes on Distributions and Sale of Shares” may be higher than the other return figures for the same period. A higher after-tax return results when a capital loss occurs upon redemption and provides an assumed tax deduction that benefits the investor.
The Fund acquired all of the assets and liabilities of the TrueShares Structured Outcome (September) ETF, a series of Listed Funds Trust (the “Predecessor Fund”), in a tax-free reorganization on August 8, 2025. In connection with this acquisition, shares of the Predecessor Fund were exchanged for shares of the Fund. The Predecessor Fund had an investment objective and strategies that were, in all material respects, the same as those of the Fund, and was managed in a manner that, in all material respects, complied with the investment guidelines and restrictions of the Fund. The Fund is a continuation of the Predecessor Fund, and therefore, the performance information includes the performance of the Predecessor Fund.
The performance information presented below provides some indication of the risks of investing in the Fund by showing how the Fund’s performance can change from year to year and over time. The bar chart below shows the Fund’s performance for calendar years ended December 31. The table illustrates how the Fund’s average annual returns for the 1 year and since inception periods compare with those of the S&P 500 Total Return Index, a broad measure of market performance, and the S&P 500 Price Index, which is integral to the Fund’s investment strategy and is comprised of the same components as the S&P 500 Total Return Index but does not include dividends in its calculation. The Fund’s past performance, before and after taxes, does not necessarily indicate how it will perform in the future.
Effective May 1, 2024, the Adviser began managing the Predecessor Fund directly. Prior to May 1, 2024, the Predecessor Fund was managed on a day-to-day basis by an investment sub-adviser. The Predecessor Fund’s performance for periods prior to May 1, 2024, may have differed had the Predecessor Fund been managed directly by the Adviser. Updated performance information is available on the Fund’s website at www.true-shares.com.
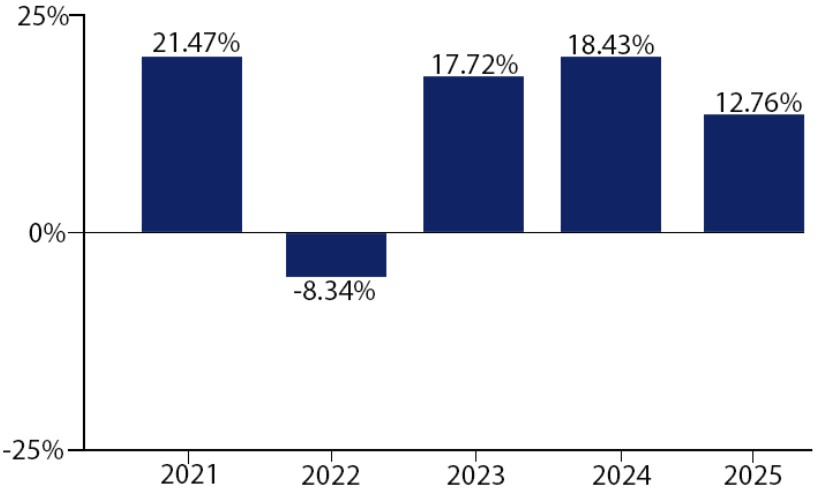
During the period of time shown in the bar chart, the highest quarterly return was 8.59% for the quarter ended December 31, 2023, and the lowest quarterly return was -9.13% for the quarter ended June 30, 2022.
| Average
Annual Total Returns (for the Periods Ended December 31, 2025) |
| TrueShares Structured Outcome (September) ETF | One Year | Five Years | Since
Inception (8/31/2020) | |
| Return Before Taxes | 12.76% | 11.85% | 12.38% | |
| Return After Taxes on Distributions | 11.78% | 10.96% | 11.55% | |
| Return After Taxes on Distributions and Sale of Fund Shares | 7.56% | 9.01% | 9.52% | |
| S&P
500 Price Index1 (reflects no deductions for fees, expenses, or taxes) |
16.39% | 12.75% | 13.39% | |
| S&P
500 Total Return Index (reflects no deductions for fees, expenses, or taxes) |
17.88% | 14.42% | 15.09% | |
| 1 | Unlike the S&P 500 Total Return Index, the S&P 500 Price Index excludes dividends. The returns of the S&P 500 Price Index are lower than the S&P 500 Total Return Index due to such exclusion of dividends. |
After-tax returns are calculated using the historical highest individual federal marginal income tax rates during the period covered by the table above and do not reflect the impact of state and local taxes. Actual after-tax returns depend on an investor’s tax situation and may differ from those shown. After-tax returns shown are not relevant to investors who hold their Shares through tax-deferred arrangements such as an individual retirement account (“IRA”) or other tax-advantaged accounts. In certain cases, the figure representing “Return After Taxes on Distributions and Sale of Shares” may be higher than the other return figures for the same period. A higher after-tax return results when a capital loss occurs upon redemption and provides an assumed tax deduction that benefits the investor.
The Fund acquired all of the assets and liabilities of the TrueShares Structured Outcome (October) ETF, a series of Listed Funds Trust (the “Predecessor Fund”), in a tax-free reorganization on August 8, 2025. In connection with this acquisition, shares of the Predecessor Fund were exchanged for shares of the Fund. The Predecessor Fund had an investment objective and strategies that were, in all material respects, the same as those of the Fund, and was managed in a manner that, in all material respects, complied with the investment guidelines and restrictions of the Fund. The Fund is a continuation of the Predecessor Fund, and therefore, the performance information includes the performance of the Predecessor Fund.
The performance information presented below provides some indication of the risks of investing in the Fund by showing how the Fund’s performance can change from year to year and over time. The bar chart below shows the Fund’s performance for calendar years ended December 31. The table illustrates how the Fund’s average annual returns for the 1 year, 5 year and since inception periods compare with those of the S&P 500 Total Return Index, a broad measure of market performance, and the S&P 500 Price Index, which is integral to the Fund’s investment strategy and is comprised of the same components as the S&P 500 Total Return Index but does not include dividends in its calculation. The Fund’s past performance, before and after taxes, does not necessarily indicate how it will perform in the future.
Effective May 1, 2024, the Adviser began managing the Predecessor Fund directly. Prior to May 1, 2024, the Predecessor Fund was managed on a day-to-day basis by an investment sub-adviser. The Predecessor Fund’s performance for periods prior to May 1, 2024 may have differed had the Predecessor Fund been managed directly by the Adviser. Updated performance information is available on the Fund’s website at www.true-shares.com.
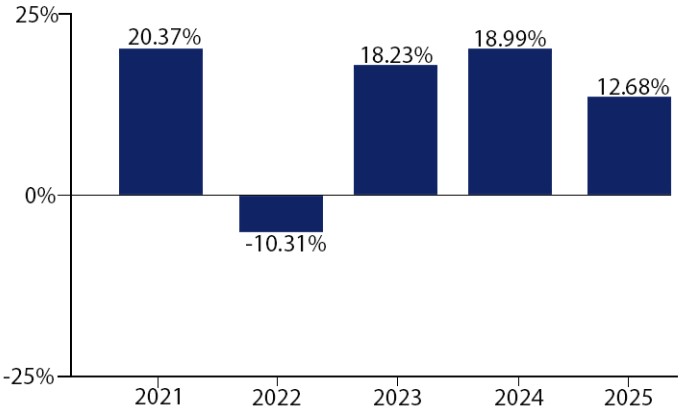
During the period of time shown in the bar chart, the highest quarterly return was 8.44% for the quarter ended December 31, 2023, and the lowest quarterly return was -10.13% for the quarter ended June 30, 2022.
| Average
Annual Total Returns (for the Periods Ended December 31, 2025) |
| TrueShares Structured Outcome (October) ETF | One Year | Five Years | Since
Inception (9/30/2020) | |
| Return Before Taxes | 12.68% | 11.34% | 12.57% | |
| Return After Taxes on Distributions | 10.93% | 10.54% | 11.80% | |
| Return After Taxes on Distributions and Sale of Fund Shares | 7.52% | 8.65% | 9.71% | |
| S&P
500 Price Index1 (reflects no deductions for fees, expenses, or taxes) |
16.39% | 12.75% | 14.48% | |
| S&P
500 Total Return Index (reflects no deductions for fees, expenses, or taxes) |
17.88% | 14.42% | 16.20% | |
| 1 | Unlike the S&P 500 Total Return Index, the S&P 500 Price Index excludes dividends. The returns of the S&P 500 Price Index are lower than the S&P 500 Total Return Index due to such exclusion of dividends. |
After-tax returns are calculated using the historical highest individual federal marginal income tax rates during the period covered by the table above and do not reflect the impact of state and local taxes. Actual after-tax returns depend on an investor’s tax situation and may differ from those shown. After-tax returns shown are not relevant to investors who hold their Shares through tax-deferred arrangements such as an individual retirement account (“IRA”) or other tax-advantaged accounts. In certain cases, the figure representing “Return After Taxes on Distributions and Sale of Shares” may be higher than the other return figures for the same period. A higher after-tax return results when a capital loss occurs upon redemption and provides an assumed tax deduction that benefits the investor.
The Fund acquired all of the assets and liabilities of the TrueShares Structured Outcome (November) ETF, a series of Listed Funds Trust (the “Predecessor Fund”), in a tax-free reorganization on August 8, 2025. In connection with this acquisition, shares of the Predecessor Fund were exchanged for shares of the Fund. The Predecessor Fund had an investment objective and strategies that were, in all material respects, the same as those of the Fund, and was managed in a manner that, in all material respects, complied with the investment guidelines and restrictions of the Fund. The Fund is a continuation of the Predecessor Fund, and therefore, the performance information includes the performance of the Predecessor Fund.
The performance information presented below provides some indication of the risks of investing in the Fund by showing how the Fund’s performance can change from year to year and over time. The bar chart below shows the Fund’s performance for calendar years ended December 31. The table illustrates how the Fund’s average annual returns for the 1 year, 5 year and since inception periods compare with those of the S&P 500 Total Return Index, a broad measure of market performance, and the S&P 500 Price Index, which is integral to the Fund’s investment strategy and is comprised of the same components as the S&P 500 Total Return Index but does not include dividends in its calculation. The Fund’s past performance, before and after taxes, does not necessarily indicate how it will perform in the future.
Effective May 1, 2024, the Adviser began managing the Predecessor Fund directly. Prior to May 1, 2024, the Predecessor Fund was managed on a day-to-day basis by an investment sub-adviser. The Predecessor Fund’s performance for periods prior to May 1, 2024, may have differed had the Predecessor Fund been managed directly by the Adviser. Updated performance information is available on the Fund’s website at www.true-shares.com.
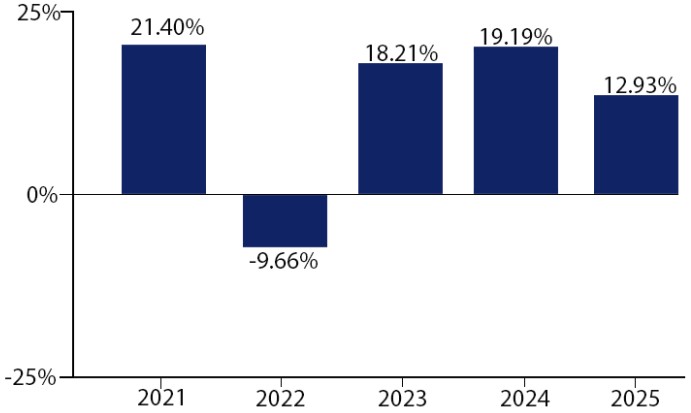
During the period of time shown in the bar chart, the highest quarterly return was 8.64% for the quarter ended December 31, 2023, and the lowest quarterly return was -10.19% for the quarter ended June 30, 2022.
| Average
Annual Total Returns (for the Periods Ended December 31, 2025) |
| TrueShares Structured Outcome (November) ETF | One Year | Five Years | Since Inception (10/30/2020) | |
| Return Before Taxes | 12.93% | 11.78% | 13.54% | |
| Return After Taxes on Distributions | 11.36% | 10.94% | 12.72% | |
| Return After Taxes on Distributions and Sale of Fund Shares | 7.67% | 8.99% | 10.49% | |
| S&P
500 Price Index1 (reflects no deductions for fees, expenses, or taxes) |
16.39% | 12.75% | 15.35% | |
| S&P
500 Total Return Index (reflects no deductions for fees, expenses, or taxes) |
17.88% | 14.42% | 17.08% | |
| 1 | Unlike the S&P 500 Total Return Index, the S&P 500 Price Index excludes dividends. The returns of the S&P 500 Price Index are lower than the S&P 500 Total Return Index due to such exclusion of dividends. |
After-tax returns are calculated using the historical highest individual federal marginal income tax rates during the period covered by the table above and do not reflect the impact of state and local taxes. Actual after-tax returns depend on an investor’s tax situation and may differ from those shown. After-tax returns shown are not relevant to investors who hold their Shares through tax-deferred arrangements such as an individual retirement account (“IRA”) or other tax-advantaged accounts. In certain cases, the figure representing “Return After Taxes on Distributions and Sale of Shares” may be higher than the other return figures for the same period. A higher after-tax return results when a capital loss occurs upon redemption and provides an assumed tax deduction that benefits the investor.
The Fund acquired all of the assets and liabilities of the TrueShares Structured Outcome (December) ETF, a series of Listed Funds Trust (the “Predecessor Fund”), in a tax-free reorganization on August 8, 2025. In connection with this acquisition, shares of the Predecessor Fund were exchanged for shares of the Fund. The Predecessor Fund had an investment objective and strategies that were, in all material respects, the same as those of the Fund, and was managed in a manner that, in all material respects, complied with the investment guidelines and restrictions of the Fund. The Fund is a continuation of the Predecessor Fund, and therefore, the performance information includes the performance of the Predecessor Fund.
The performance information presented below provides some indication of the risks of investing in the Fund by showing how the Fund’s performance can change from year to year and over time. The bar chart below shows the Fund’s performance for calendar years ended December 31. The table illustrates how the Fund’s average annual returns for the 1 year, 5 year and since inception periods compare with those of the S&P 500 Total Return Index, a broad measure of market performance, and the S&P 500 Price Index, which is integral to the Fund’s investment strategy and is comprised of the same components as the S&P 500 Total Return Index but does not include dividends in its calculation. The Fund’s past performance, before and after taxes, does not necessarily indicate how it will perform in the future.
Effective May 1, 2024, the Adviser began managing the Predecessor Fund directly. Prior to May 1, 2024, the Predecessor Fund was managed on a day-to-day basis by an investment sub-adviser. The Predecessor Fund’s performance for periods prior to May 1, 2024 may have differed had the Predecessor Fund been managed directly by the Adviser. Updated performance information is available on the Fund’s website at www.true-shares.com.
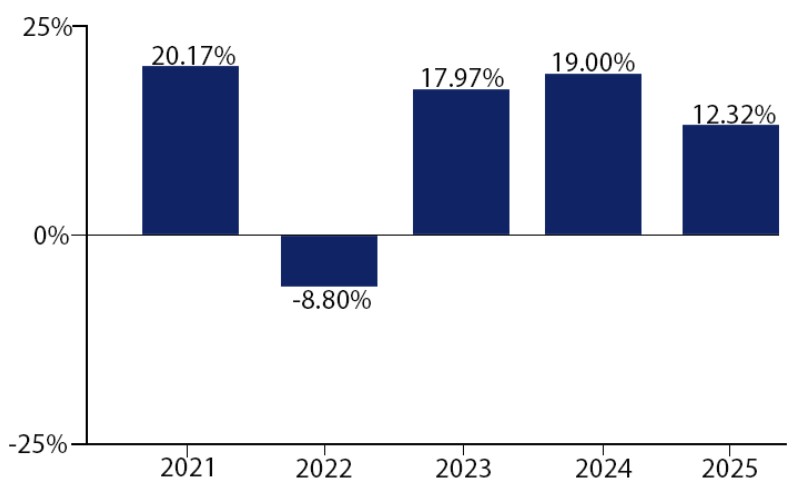
During the period of time shown in the bar chart, the highest quarterly return was 8.62% for the quarter ended December 31, 2022, and the lowest quarterly return was -10.71% for the quarter ended June 30, 2022.
| Average
Annual Total Returns (for the Periods Ended December 31, 2025) |
| TrueShares Structured Outcome (December) ETF | One Year | Five Years | Since
Inception (11/30/2020) | |
| Return Before Taxes | 12.32% | 11.56% | 11.74% | |
| Return After Taxes on Distributions | 10.88% | 10.77% | 10.96% | |
| Return After Taxes on Distributions and Sale of Fund Shares | 7.30% | 8.83% | 8.99% | |
| S&P
500 Price Index1 (reflects no deductions for fees, expenses, or taxes) |
16.39% | 12.75% | 13.33% | |
| S&P
500 Total Return Index (reflects no deductions for fees, expenses, or taxes) |
17.88% | 14.42% | 15.02% | |
| 1 | Unlike the S&P 500 Total Return Index, the S&P 500 Price Index excludes dividends. The returns of the S&P 500 Price Index are lower than the S&P 500 Total Return Index due to such exclusion of dividends. |
After-tax returns are calculated using the historical highest individual federal marginal income tax rates during the period covered by the table above and do not reflect the impact of state and local taxes. Actual after-tax returns depend on an investor’s tax situation and may differ from those shown. After-tax returns shown are not relevant to investors who hold their Shares through tax-deferred arrangements such as an individual retirement account (“IRA”) or other tax-advantaged accounts. In certain cases, the figure representing “Return After Taxes on Distributions and Sale of Shares” may be higher than the other return figures for the same period. A higher after-tax return results when a capital loss occurs upon redemption and provides an assumed tax deduction that benefits the investor.
The Fund acquired all of the assets and liabilities of the TrueShares Technology, AI & Deep Learning ETF, a series of Listed Funds Trust (the “Predecessor Fund”), in a tax-free reorganization on June 13, 2025. In connection with this acquisition, shares of the Predecessor Fund were exchanged for shares of the Fund. The Predecessor Fund had an investment objective and strategies that were, in all material respects, the same as those of the Fund, and was managed in a manner that, in all material respects, complied with the investment guidelines and restrictions of the Fund. The Fund is a continuation of the Predecessor Fund, and therefore, the performance information includes the performance of the Predecessor Fund.
The performance information presented below provides some indication of the risks of investing in the Fund by showing how the Fund’s performance can change from year to year and over time. The bar chart below shows the Fund’s performance for calendar years ended December 31. The table illustrates how the Fund’s average annual returns for the one year, five year and since inception periods compare with those of a broad-based securities market index intended to represent the overall domestic and international equity market. The Predecessor Fund’s past performance, before and after taxes, does not necessarily indicate how it will perform in the future. Updated performance information is available on the Fund’s website at www.True-Shares.com.
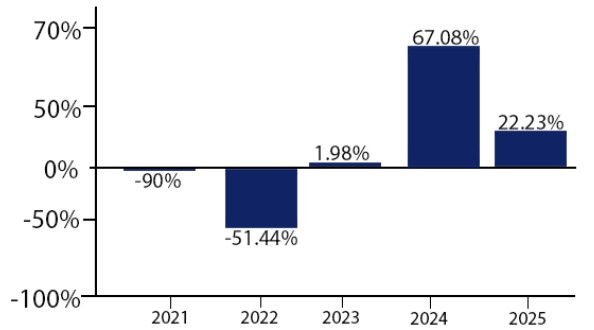
During the period of time shown in the bar chart, the highest quarterly return was 29.82% for the quarter ended June 30, 2025, and the lowest quarterly return was -30.13% for the quarter ended June 30, 2022.
| Average Annual Total Returns (for the Periods Ended December 31, 2025) | ||||
| TrueShares Technology, AI & Deep Learning ETF | One Year | Five Years | Since Inception
(2/28/2020) | |
| Return Before Taxes | 22.23% | 0.04% | 11.70% | |
| Return After Taxes on Distributions | 22.23% | 0.03% | 11.69% | |
| Return After Taxes on Distributions and Sale of Fund Shares | 13.16% | 0.03% | 9.42% | |
| NASDAQ
Composite Total Return Index (reflects no deductions for fees, expenses, or taxes) |
21.14% | 13.35% | 19.54% |
After-tax returns are calculated using the historical highest individual federal marginal income tax rates during the period covered by the table above and do not reflect the impact of state and local taxes. Actual after-tax returns depend on an investor’s tax situation and may differ from those shown. After-tax returns shown are not relevant to investors who hold their Shares through tax-deferred arrangements such as an individual retirement account (“IRA”) or other tax-advantaged accounts. In certain cases, the figure representing “Return After Taxes on Distributions and Sale of Shares” may be higher than the other return figures for the same period. A higher after-tax return results when a capital loss occurs upon redemption and provides an assumed tax deduction that benefits the investor.
The Fund acquired all of the assets and liabilities of The Opal Dividend Income ETF, a series of Listed Funds Trust (the “Predecessor Fund”), in a tax-free reorganization on June 13, 2025. In connection with this acquisition, shares of the Predecessor Fund were exchanged for shares of the Fund. The Predecessor Fund had an investment objective and strategies that were, in all material respects, the same as those of the Fund, and was managed in a manner that, in all material respects, complied with the investment guidelines and restrictions of the Fund. The Fund is a continuation of the Predecessor Fund, and therefore, the performance information includes the performance of the Predecessor Fund.
The performance information presented below provides some indication of the risks of investing in the Fund by showing the extent to which the Fund’s performance can change from year to year and over time. The bar chart below shows the Fund’s performance for the calendar years ended December 31. The table illustrates how the Fund’s average annual returns for the one year and since inception periods compare with those of a broad measure of market performance. The Fund’s past performance, before and after taxes, does not necessarily indicate how it will perform in the future. Updated performance information is available on the Fund’s website at www.True-Shares.com.
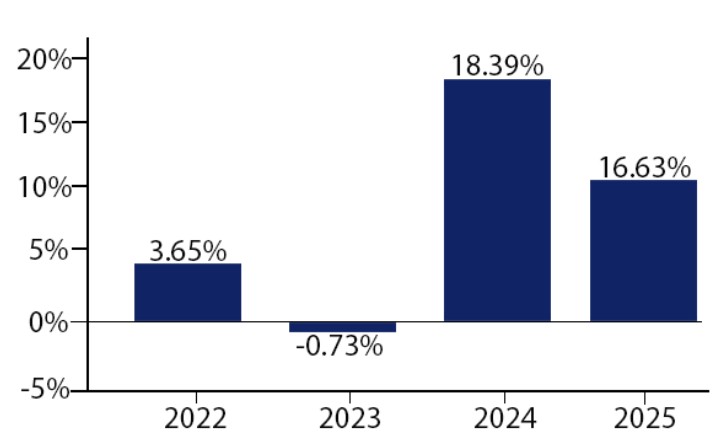
During the period of time shown in the bar chart, the highest quarterly return was 13.04% for the quarter ended December 31, 2022, and the lowest quarterly return was -6.91% for the quarter ended June 30, 2022.
| Average Annual Total Returns (for the Periods Ended December 31, 2025) | ||||
| Polen Dividend Income ETF | One Year | Since Inception
(1/27/2021) | ||
| Return Before Taxes | 16.63% | 11.46% | ||
| Return After Taxes on Distributions | 15.88% | 10.56% | ||
| Return After Taxes on Distributions and Sale of Fund Shares | 10.33% | 8.92% | ||
| S&P
500 Total Return Index (reflects no deductions for fees, expenses, or taxes) |
17.88% | 14.67% |
After-tax returns are calculated using the historical highest individual federal marginal income tax rates during the period covered by the table above and do not reflect the impact of state and local taxes. Actual after-tax returns depend on an investor’s tax situation and may differ from those shown. After-tax returns shown are not relevant to investors who hold their Shares through tax-deferred arrangements such as an individual retirement account (“IRA”) or other tax-advantaged accounts. In certain cases, the figure representing “Return After Taxes on Distributions and Sale of Shares” may be higher than the other return figures for the same period. A higher after-tax return results when a capital loss occurs upon redemption and provides an assumed tax deduction that benefits the investor.
The Fund acquired all of the assets and liabilities of the TrueShares Eagle Global Renewable Energy Income ETF, a series of Listed Funds Trust (the “Predecessor Fund”), in a tax-free reorganization on June 13, 2025. In connection with this acquisition, shares of the Predecessor Fund were exchanged for shares of the Fund. The Predecessor Fund had an investment objective and strategies that were, in all material respects, the same as those of the Fund, and was managed in a manner that, in all material respects, complied with the investment guidelines and restrictions of the Fund. The Fund is a continuation of the Predecessor Fund, and therefore, the performance information includes the performance of the Predecessor Fund.
The performance information presented below provides some indication of the risks of investing in the Fund by showing how the Fund’s performance can change from year to year and over time. The bar chart below shows the Fund’s performance for the calendar years ended December 31. The table illustrates how the Fund’s average annual returns for the one year and since inception periods compare with those of the MSCI World Net USD Index, a broad measure of market performance, and the S&P Global Infrastructure Total Return Index, a supplemental index. The Fund’s past performance, before and after taxes, does not necessarily indicate how it will perform in the future. Updated performance information is available on the Fund’s website at www.True-Shares.com.
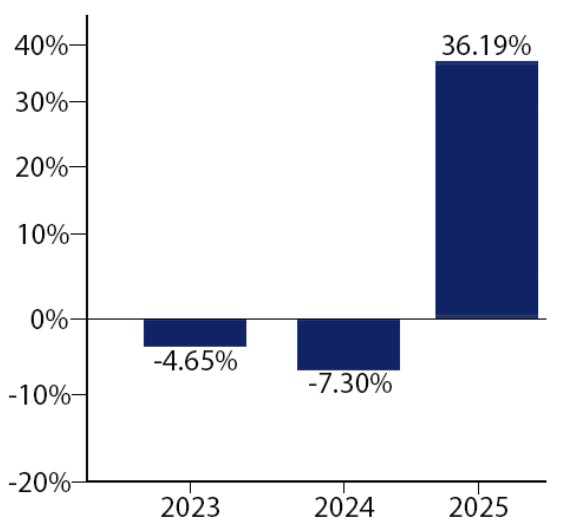
During the period of time shown in the bar chart, the highest quarterly return was 14.49% for the quarter ended September 30, 2024 and the lowest quarterly return was -16.66% for the quarter ended December 31, 2024.
| Average Annual Total Returns (for the Periods Ended December 31, 2025) | |||
| TrueShares Eagle Global Renewable Energy Income ETF | One Year |
Since Inception | |
| Return Before Taxes | 36.19% | 5.95% | |
| Return After Taxes on Distributions | 35.99% | 5.99% | |
| Return After Taxes on Distributions and Sale of Fund Shares | 22.24% | 5.09% | |
MSCI World Net USD Index (reflects no deduction for fees, expenses, or taxes) |
21.09% | 19.71% | |
| S&P
Global Infrastructure Total Return Index (reflects no deductions for fees, expenses, or taxes) |
22.58% | 13.73% |
After-tax returns are calculated using the historical highest individual federal marginal income tax rates during the period covered by the table above and do not reflect the impact of state and local taxes. Actual after-tax returns depend on an investor’s tax situation and may differ from those shown. After-tax returns shown are not relevant to investors who hold their Shares through tax-deferred arrangements such as an individual retirement account (“IRA”) or other tax-advantaged accounts. In certain cases, the figure representing “Return After Taxes on Distributions and Sale of Shares” may be higher than the other return figures for the same period. A higher after-tax return results when a capital loss occurs upon redemption and provides an assumed tax deduction that benefits the investor.
The Fund acquired all of the assets and liabilities of the RiverNorth Patriot ETF, a series of Listed Funds Trust (the “Predecessor Fund”), in a tax-free reorganization on June 13, 2025. In connection with this acquisition, shares of the Predecessor Fund were exchanged for shares of the Fund. The Predecessor Fund had an investment objective and strategies that were, in all material respects, the same as those of the Fund, and was managed in a manner that, in all material respects, complied with the investment guidelines and restrictions of the Fund. The Fund is a continuation of the Predecessor Fund, and therefore, the performance information includes the performance of the Predecessor Fund.
The performance information presented below provides some indication of the risks of investing in the Fund by showing the extent to which the Fund’s performance can change from year to year and over time. The bar chart below shows the Fund’s performance for the calendar years ended December 31. The table illustrates how the Fund’s average annual returns for the 1 year and since inception periods compare with those of the S&P 900 Total Return Index, which reflects a broad measure of market performance. The Fund’s past performance, before and after taxes, does not necessarily indicate how it will perform in the future. Updated performance information is available on the Fund’s website at www.true-shares.com.
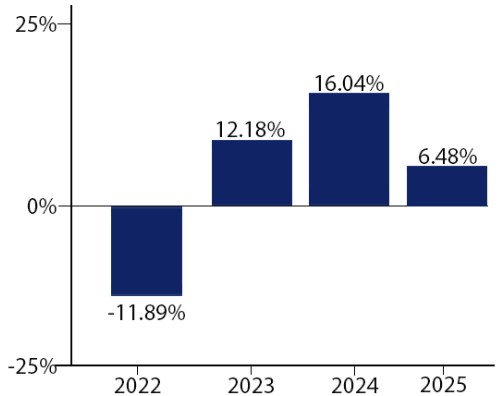
During the period of time shown in the bar chart, the highest quarterly return was 10.73% for the quarter ended December 31, 2023, and the lowest quarterly return was -13.94% for the quarter ended June 30, 2022.
| Average
Annual Total Returns (for the Periods Ended December 31, 2025) |
| RiverNorth Patriot ETF | One Year | Since
Inception (12/31/2021) | |
| Return Before Taxes | 6.48% | 5.13% | |
| Return After Taxes on Distributions | 6.09% | 4.78% | |
| Return After Taxes on Distributions and Sale of Fund Shares | 4.10% | 3.90% | |
| S&P
900 Index Total Return (reflects no deductions for fees, expenses, or taxes) |
17.30% | 10.80% | |
After-tax returns are calculated using the historical highest individual federal marginal income tax rates during the period covered by the table above and do not reflect the impact of state and local taxes. Actual after-tax returns depend on an investor’s tax situation and may differ from those shown. After-tax returns shown are not relevant to investors who hold their Shares through tax-deferred arrangements such as an individual retirement account (“IRA”) or other tax-advantaged accounts. In certain cases, the figure representing “Return After Taxes on Distributions and Sale of Shares” may be higher than the other return figures for the same period. A higher after-tax return results when a capital loss occurs upon redemption and provides an assumed tax deduction that benefits the investor.
The Fund acquired all of the assets and liabilities of the RiverNorth Enhanced Pre-Merger SPAC ETF, a series of Listed Funds Trust (the “Predecessor Fund”), in a tax-free reorganization on June 13, 2025. In connection with this acquisition, shares of the Predecessor Fund were exchanged for shares of the Fund. The Predecessor Fund had an investment objective and strategies that were, in all material respects, the same as those of the Fund, and was managed in a manner that, in all material respects, complied with the investment guidelines and restrictions of the Fund. The Fund is a continuation of the Predecessor Fund, and therefore, the performance information includes the performance of the Predecessor Fund.
The performance information presented below provides some indication of the risks of investing in the Fund by showing the extent to which the Fund’s performance can change from year to year and over time. The bar chart below shows the Fund’s performance for the calendar years ended December 31. The table illustrates how the Fund’s average annual returns for the 1 year and since inception periods compare with those of the ICE BofA Broad U.S. Market Index, a broad measure of market performance intended to represent the overall U.S. equity market, and the ICE BofA 0-3 Year U.S. Treasury Index, which provides a measure of the short term US treasury market. The Fund’s past performance, before and after taxes, does not necessarily indicate how it will perform in the future. Updated performance information is available on the Fund’s website at www.true-shares.com.
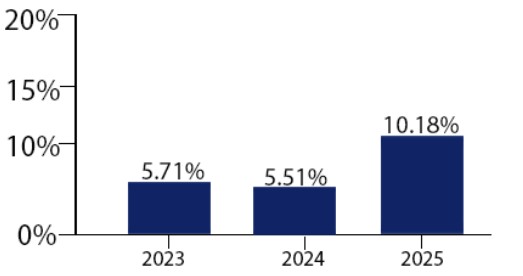
During the period of time shown in the bar chart, the highest quarterly return was 4.49% for the quarter ended June 30, 2025, and the lowest quarterly return was 0.16% for the quarter ended December 31, 2023.
| Average
Annual Total Returns (for the Periods Ended December 31, 2025) |
| RiverNorth Enhanced Pre-Merger SPAC ETF | One Year | Since
Inception (7/11/2022) |
| Return Before Taxes | 10.18% | 6.72% |
| Return After Taxes on Distributions | 5.75% | 4.40% |
| Return After Taxes on Distributions and Sale of Fund Shares | 6.44% | 4.28% |
| ICE BofA Broad U.S. Market Index | 7.15% | 3.05% |
| ICE
BofA 0-3 Year U.S. Treasury Index (reflects no deductions for fees, expenses, or taxes) |
4.86% | 3.94% |
After-tax returns are calculated using the historical highest individual federal marginal income tax rates during the period covered by the table above and do not reflect the impact of state and local taxes. Actual after-tax returns depend on an investor’s tax situation and may differ from those shown. After-tax returns shown are not relevant to investors who hold their Shares through tax-deferred arrangements such as an individual retirement account (“IRA”) or other tax-advantaged accounts. In certain cases, the figure representing “Return After Taxes on Distributions and Sale of Shares” may be higher than the other return figures for the same period. A higher after-tax return results when a capital loss occurs upon redemption and provides an assumed tax deduction that benefits the investor.