The bar chart and performance table below show how the Fund has performed in the past and provide some indication of the risks of investing in the Fund. The bar chart shows how the performance of the Class A Shares of the Fund has varied from year to year. The returns in the bar chart do not include the deduction of any applicable sales charges on Class A Shares. If sales charges had been included, the returns would be less than those shown in the bar chart.
The table compares the average annual total returns of each class of shares of the Fund for the periods ended December 31, 2025, as compared to a broader index measuring market performance. For Class A Shares of the Fund, the returns in the table include the deduction of the maximum applicable sales charge. Prior to April 30, 2017, the maximum applicable sales charge on Class A Shares of the Fund was 4.75%. On April 30, 2017, the maximum applicable sales charge on Class A Shares of the Fund was reduced to 3.50%. The table also shows the impact of taxes on the Class A Shares of the Fund. Past performance (before and after taxes) is not necessarily an indication of how the Fund will perform in the future.
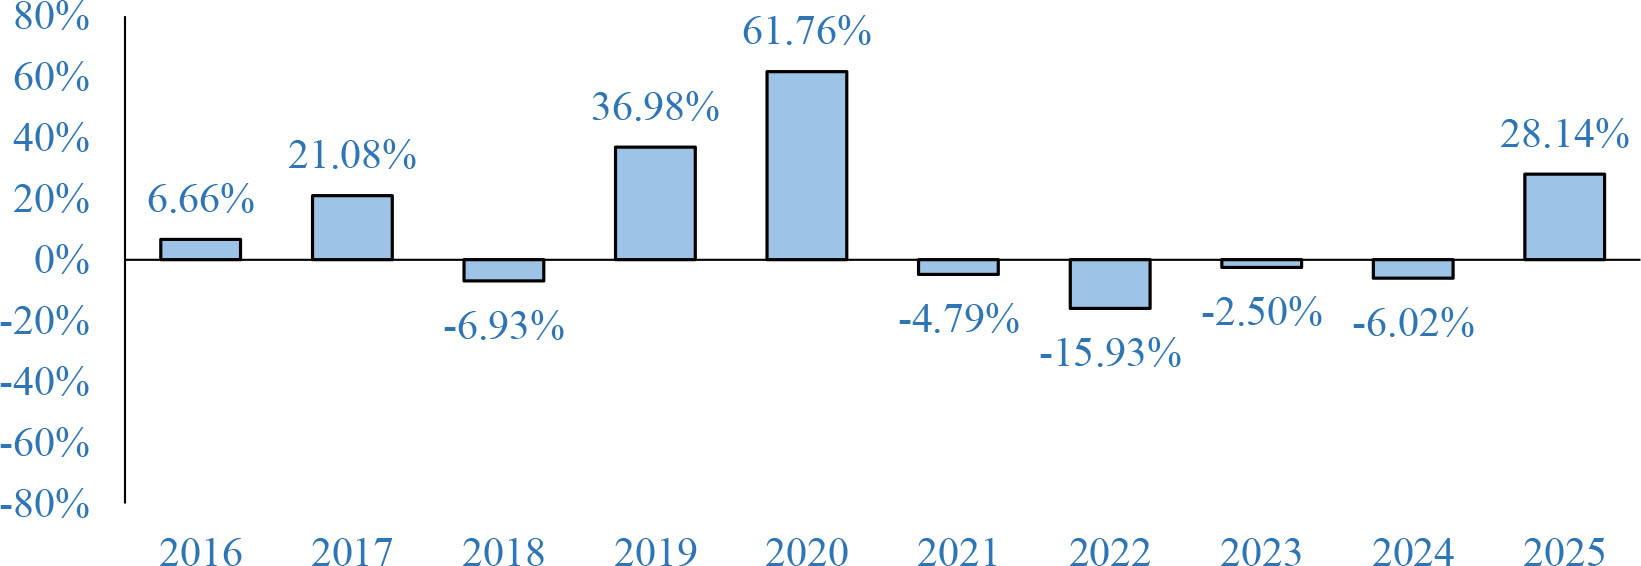
During the period shown in the bar chart, the highest return for a quarter was 27.58% for the quarter ended December 31, 2020, and the lowest return for a quarter was -16.37% for the quarter ended September 30, 2023.
|
One Year |
Five Years |
Ten Years | |||
| Return Before Taxes | |||||
| Class A Shares | 23.66% | -1.93% | 9.08% | ||
| Investor Shares | 27.82% | -1.48% | 9.34% | ||
| Return After Taxes – Class A Shares Return After Taxes on Distributions | 27.76% | -2.24% | 8.16% | ||
| Return After Taxes on Distributions and Sale of Fund Shares | 16.89% | -1.10% | 7.29% | ||
| S&P 500® Index (reflects no deduction of fees, expenses and taxes) | 17.88% | 14.42% | 14.82% |
After-tax returns are calculated using the historical highest individual federal marginal income tax rates and do not reflect the impact of state and local taxes. Your actual after-tax returns depend on your tax situation and may differ from those shown. After-tax returns shown are not relevant to investors who hold their Fund shares through tax-deferred arrangements, such as 401(k) plans or individual retirement accounts. Investors should consult their tax advisers regarding their personal tax situations.
The S&P 500® Index is an unmanaged index of approximately 500 leading companies in leading industries of the U.S. economy.